. 2022 Mar 4;7(69):eabg5539.
doi: 10.1126/sciimmunol.abg5539. Epub 2022 Mar 4.

Single-cell transcriptional profiling informs efficient reprogramming of human somatic cells to cross-presenting dendritic cells

Affiliations

Single-cell transcriptional profiling informs efficient reprogramming of human somatic cells to cross-presenting dendritic cells

Fábio F Rosa et al. Sci Immunol. .

Abstract

Type 1 conventional dendritic cells (cDC1s) are rare immune cells critical for the induction of antigen-specific cytotoxic CD8+ T cells, although the genetic program driving human cDC1 specification remains largely unexplored. We previously identified PU.1, IRF8, and BATF3 transcription factors as sufficient to induce cDC1 fate in mouse fibroblasts, but reprogramming of human somatic cells was limited by low efficiency. Here, we investigated single-cell transcriptional dynamics during human cDC1 reprogramming. Human induced cDC1s (hiDC1s) generated from embryonic fibroblasts gradually acquired a global cDC1 transcriptional profile and expressed antigen presentation signatures, whereas other DC subsets were not induced at the single-cell level during the reprogramming process. We extracted gene modules associated with successful reprogramming and identified inflammatory signaling and the cDC1-inducing transcription factor network as key drivers of the process. Combining IFN-γ, IFN-β, and TNF-α with constitutive expression of cDC1-inducing transcription factors led to improvement of reprogramming efficiency by 190-fold. hiDC1s engulfed dead cells, secreted inflammatory cytokines, and performed antigen cross-presentation, key cDC1 functions. This approach allowed efficient hiDC1 generation from adult fibroblasts and mesenchymal stromal cells. Mechanistically, PU.1 showed dominant and independent chromatin targeting at early phases of reprogramming, recruiting IRF8 and BATF3 to shared binding sites. The cooperative binding at open enhancers and promoters led to silencing of fibroblast genes and activation of a cDC1 program. These findings provide mechanistic insights into human cDC1 specification and reprogramming and represent a platform for generating patient-tailored cDC1s, a long-sought DC subset for vaccination strategies in cancer immunotherapy.


Conflict of interest statement

Competing interests: F.F.R., C.F.P. and C-F.P. have equity interest in Asgard Therapeutics AB, which develops cancer immunotherapies based in DC reprogramming technologies. F.F.R., C.F.P. and C-F.P. are inventors of PCT/IB2018/052378 and priority application filed on 2021-05-19 by Asgard Therapeutics protecting the intellectual property described here.

Figures

Fig. 1
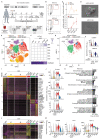
Fig. 1. PU.1, IRF8 and BATF3 induce global DC1 gene expression program in human fibroblasts.
(A) HEF were co-transduced with Dox-inducible lentiviral particles encoding M2rtTA (UbC-M2rtTA) and PU.1, IRF8 and BATF3 (PIB, TetO-PIB). Purified PIB-transduced HEFs (hiDC) were profiled by single-cell RNA-seq at day 3 (CD45+), day 6 (CD45+) and day 9 (CD45+HLA-DR-, hiDC d9 DR-; CD45+HLA-DR+, hiDC d9 DR+). HEF and peripheral blood cDC1 (HLA-DR+CD11C+CD141+), DC2 (HLA-DR+CD11C+CD141-CD1C+) and pDC cells (HLA-DR+CD11C-CD123+) were included as controls. (B) Flow cytometry analysis of hiDCs at day 3 and 9 after addition of Dox. (C) Kinetics of hiDC d9 DR- (top) and hiDC d9 DR+ (bottom) cell emergence (n=5-8, mean ± SD). (D) Scanning electron microscopy of hiDCs and M2rtTA control at day 9. Scale bars, 10 μm. (E) t-SNE plot of single-cell transcriptomes showing 45,870 single cells. (F) Integration of single-cell data with published DC subset data (DC1-DC6 (7)) using scPred (22). Heat map shows the percentage of single cells affiliated to DC1-DC6 subsets or unaffiliated. (G) t-SNE of single cells affiliated by scPred. (H) Violin plots showing gene expression distribution of cDC1-specific genes in hiDCs d9 and cDC1s. Log values of gene counts are shown. (I) Heat map showing differentially expressed genes across profiled populations and grouped in 5 clusters. (J) Violin plots showing expression distribution of genes selected from cluster 3. (K) Top five Reactome pathway enrichment analysis for each gene cluster using Enrichr. (L) Heat map and (M) violin plots showing expression of genes associated with antigen cross-presentation pathway across profiled populations.
Fig. 2
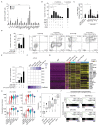
Fig. 2. Pseudo-temporal ordering of single cells highlights gene modules and pathways associated with successful and unsuccessful cDC1 reprogramming.
(A) Monocle 3 reconstruction of single-cell trajectories for HEF, hiDC at day 3, day 6, day 9 (d9 DR- and d9 DR+) unaffiliated or affiliated with DC1 and scPred-filtered cDC1s. (B) cDC1 reprogramming trajectory colored by relative trajectory position (pseudotime) (left). Whisker box plots showing pseudotime distribution by cell type (right). (C) scVelo (26) single-cell velocities visualized in a tSNE plot. Arrows indicate direction and thickness indicates speed along cDC1 reprogramming trajectory. (D) Heat map highlighting 6 gene clusters (A-F) showing gene expression dynamics along scVelo latent time. (E) Top 5 Reactome pathway enrichment analysis of clusters A-F. (F) Heat map showing mean expression values of gene modules by cell-type differentially expressed along cDC1 reprogramming trajectory. (G) Violin plots showing expression distribution of genes associated with unsuccessful and successful DC reprogramming. Log values of gene counts are shown. (H) Flow cytometry analysis of CD226 expression in d9 DR- and d9 DR+ hiDCs. (I) Classification with published DC subset data (DC1-DC6 (7)) using scPred (22). (J) Percentage of CD45+HLA-DR+ cells at day 9 generated by co-transduction of Dox-inducible PIB with indicated transcription factors (n=4, mean ± SD). M2rtTA- and PIB-transduced cells were included as controls. ** p<0.005; **** p<0.00005.
Fig. 3
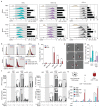
Fig. 3. Inflammatory cytokine signaling and enforced expression of transcription factors enable human cDC1 reprogramming at high efficiency.
(A) Quantification of hiDCs (CD45+HLA-DR+) at day 9 obtained in the presence of single cytokines and (B) combinations of two or three cytokines. Non-transduced HEF were included as control (n=2-5, mean ± SD). (C) Quantification of reprogrammed cells (tdT+MHC-II+ in live GFP+ cells) obtained by transducing Clec9a-tdTomato (tdT) reporter mouse embryonic fibroblasts with lentiviral particles encoding GFP and PIB driven by Dox-inducible (TetO) or constitutive promoters (UbC, SFFV, PGK, EF1S, EF1 and EF1i promoters). (D) Quantification of hiDCs at day 9 generated with TetO-PIB or SFFV-PIB, in the presence or absence of IFN-γ, IFN-β and IFN-α (n=3-9, mean ± SD). (E) Quantification of hiDC yield after 9 days per input fibroblast. (F) hiDCs at day 9 generated in the four conditions were FACS sorted and profiled by scRNA-seq. Heat map shows the percentage of single cells affiliated to the DC1-DC6 subsets (7) by scPred (22). (G) Heat map showing relative expression of genes commonly upregulated in hiDCs in the four conditions and in cDC1s. (H) Violin plots showing expression distribution of antigen-presentation genes. Log values of gene counts are shown. (I) Single-cell distribution along the cDC1 reprogramming pseudotime by condition. (J) GSEA for successful cDC1 reprogramming (genes included in modules 13, 3, 15, 17, and 9) between hiDC day 9 and HEF. Normalized enrichment score (NES) and False discovery rate (FDR) q-values are shown. * p<0.05; ** p<0.005; *** p<0.0005; **** p<0.00005.
Fig. 4
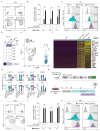
Fig. 4. Optimized DC reprogramming protocol allows generation of functional human cDC1-like cells.
(A) Median fluorescence intensity (MFI) of CD40 and CD80 expression in hiDCs (CD45+HLA-DR+) at day 9 generated with SFFV-PIB in the absence or presence of IFN-γ, IFN-β and IFN-α (hiDC+cyt) and in peripheral blood CD141+CLEC9A+ cDC1. Cells were stimulated overnight with TLR agonists LPS, Poly I:C, R848 or the three combined (All) (n=3-7, mean ± SD). (B and C) Quantification of CellVue Far Red-labeled dead cell engulfment by hiDC and hiDC+cyt at day 9 after 2-hour incubation. HEF cultured without and with cytokines (HEF+cyt) and CD141+CLEC9A+ cDC1 were included as controls (n=3-12, mean ± SD). (D) Time lapse microscopy of dead cell engulfment (red) by FACS purified hiDCs (arrowhead). Scale bar, 100 μm. (E) Dead cell engulfment by CD45+HLA-DR+CD226+ and CD45+HLA-DR+CD226- hiDC and hiDC+cyt (n=6-7, mean ± SD). (F) Cytokine secretion of purified hiDC and hiDC+cyt at day 9 after overnight incubation with TLR agonists. HEFs cultured without and with cytokines, monocyte-derived DCs (moDC) and purified CD141+CLEC9A+XCR1+ cDC1 were included as controls (n=3-12, mean ± SD). (G) HEF, HEF+cyt, hiDC, hiDC+cyt, moDC and cDC1 were primed overnight with LPS, Poly I:C and R848, pulsed with CMV protein for 3 hours, washed and co-cultured with CD8+ T cells harvested from CMV+ donors. Antigen cross-presentation was quantified by measuring IFN-γ levels in the supernatant 24 h after co-culture (n=2-4, mean ± SD). * p<0.05; ** p<0.005; *** p<0.0005; **** p<0.00005.
Fig. 5
Fig. 5. Efficient cDC1 reprogramming of adult fibroblasts and mesenchymal stromal cells.
(A) Flow cytometry analysis and (B) quantification of hiDC (CD45+HLA-DR+) at day 9 generated from human dermal fibroblasts (HDF) in the absence (SFFV-PIB) or presence of IFN-Y, IFN-β and IFN-α (SFFV-PIB+cyt) from three independent donors. HDF cultured in the absence (-) or presence of cytokines (+cyt) were included as controls (n=3-12, mean ± SD). (C) Expression of CD40 and CD80 in HDF-derived hiDC. (D) HDF-derived hiDC were FACS sorted and profiled by scRNA-seq. Heat map shows the percentage of single cells affiliated to DC1-6 subsets (7) by scPred (22). (E) t-SNE of single cell transcriptomes showing HDFs, HDF-derived hiDCs and cDC1s. (F) Heat map showing relative expression of genes upregulated during cDC1 reprogramming of HDF and expressed in cDC1s. cDC1 and antigen presentation genes are highlighted in bold and shown in (G) as violin plots. Log values of gene counts are shown. (H) Strategy to derive hiDC from human Mesenchymal Stromal Cells (MSC) under xeno-free conditions. MSC were isolated from three healthy donors, FACS-purified (Lin-CD45-CD271+), expanded in pHPL media, transduced and cultured in X-VIVO 15. (I and J) Quantification of MSC-derived hiDCs at day 9 generated with or without cytokines (n=3-7, mean ± SD). (K) Flow cytometry analysis of CD40 and CD80 in MSC-derived hiDCs. ns - non significant; **** p<0.00005.
Fig. 6
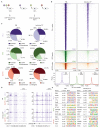
Fig. 6. PU.1 has dominant and independent chromatin targeting capacity, recruiting IRF8 and BATF3 to shared binding sites.
(A) Strategy to profile chromatin binding sites of PU.1, IRF8 and BATF3 (PIB) at early stages of reprogramming. HDFs were transduced with PIB (left) or individual factors (right) and analyzed by ChIP-seq after 48 hours. (B) Heatmaps showing genome-wide distribution of PU.1, IRF8 and BATF3 when expressed in combination (left) or individually (right). Signal is displayed within an 8 kb window centered on individual peaks. The number of peaks in each condition is shown. Average signal intensity of peaks is depicted (bottom). (C) Pie charts showing genomic distribution of PU.1, IRF8 and BATF3 peaks when expressed together or individually. (D) PU.1, IRF8 and BATF3 occupancy profile at the C1orf54 and ZNF366 loci. Boxes highlight PU.1 peaks when expressed individually or combined with IRF8 and BATF3. (E) De novo motif prediction analysis for PIB or individual transcription factor target sites.
Fig. 7
Fig. 7. PU.1, IRF8 and BATF3 cooperatively bind at fibroblast and cDC1 genes marked with open chromatin marks.
(A) Venn diagram shows genome-wide peak overlap between PU.1, IRF8 and BATF3 (PIB). (B) De novo motif prediction analysis for co-bound sites. (C) Motif comparison between enriched PU.1-IRF and BATF motifs. Jaccard similarity coefficient = 0.02. (D) Immunoblots showing immunoprecipitation (IP) for PU.1 (top), IRF8 (middle), and BATF3 (bottom) in HEK293T cells 24 hours after transfection with PIB (left). Co-immunoprecipitation (Co-IP) performed with 1, 2 and 5 million (M) cells after transfection with PIB (right). Non-immunoprecipitated input (10%), and IgG isotype antibody were used as controls. (E) Heat map showing differentially expressed genes between HDFs and hiDC at day 9 that are bound by either PU.1, IRF8 and BATF3 or the three factors (intersect). (F) Heatmaps of normalized read coverages of chromatin marks in HDFs for co-bound sites. The signal is displayed within an 8 kb window and centered on transcription factor binding sites. Average signal intensity of histone marks at PIB intersection peaks is shown in the upper panel. (G) Heatmaps for chromatin state enrichment showing the percentage of genome occupancy for PU.1 (P), IRF8 (I) and BATF3 (B) when expressed together. Genome occupancy of co-bound sites (PIB intersect) is shown on the right. (H) Model for the mechanism of action of PIB to set in motion cDC1 reprogramming.

References

    1. Cabeza-Cabrerizo M, Cardoso A, Minutti CM, Pereira da Costa M, Reis ESC. Dendritic Cells Revisited. Annual review of immunology. 2021;39:131–166. - PubMed
    1. Lee J, Zhou YJ, Ma W, Zhang W, Aljoufi A, Luh T, Lucero K, Liang D, Thomsen M, Bhagat G, Shen Y, Liu K. Lineage specification of human dendritic cells is marked by IRF8 expression in hematopoietic stem cells and multipotent progenitors. Nature immunology. 2017;18:877–888. - PMC - PubMed
    1. Poulin LF, Reyal Y, Uronen-Hansson H, Schraml BU, Sancho D, Murphy KM, Hakansson UK, Moita LF, Agace WW, Bonnet D, Reis e Sousa C. DNGR-1 is a specific and universal marker of mouse and human Batf3-dependent dendritic cells in lymphoid and nonlymphoid tissues. Blood. 2012;119:6052–6062. - PubMed
    1. Schönheit J, Kuhl C, Marie Gebhardt L, Francisco F, Klett P, Riemke M, Scheller G, Huang R, Naumann A, Leutz C, Stocking C, et al. PU.1 Level-Directed Chromatin Structure Remodeling at the Irf8 Gene Drives Dendritic Cell Commitment. Cell reports. 2013;3:1617–1628. - PubMed
    1. Grajales-Reyes GE, Iwata A, Albring J, Wu X, Tussiwand R, Kc W, Kretzer NM, Briseno CG, Durai V, Bagadia P, Haldar M, et al. Batf3 maintains autoactivation of Irf8 for commitment of a CD8alpha(+) conventional DC clonogenic progenitor. Nature immunology. 2015;16:708–717. - PMC - PubMed

Publication types

Substances