. 2022 Mar 4;7(69):eabj1080.
doi: 10.1126/sciimmunol.abj1080. Epub 2022 Mar 4.

Bile acid-sensitive tuft cells regulate biliary neutrophil influx

Affiliations

Bile acid-sensitive tuft cells regulate biliary neutrophil influx

Claire E O'Leary et al. Sci Immunol. .

Abstract

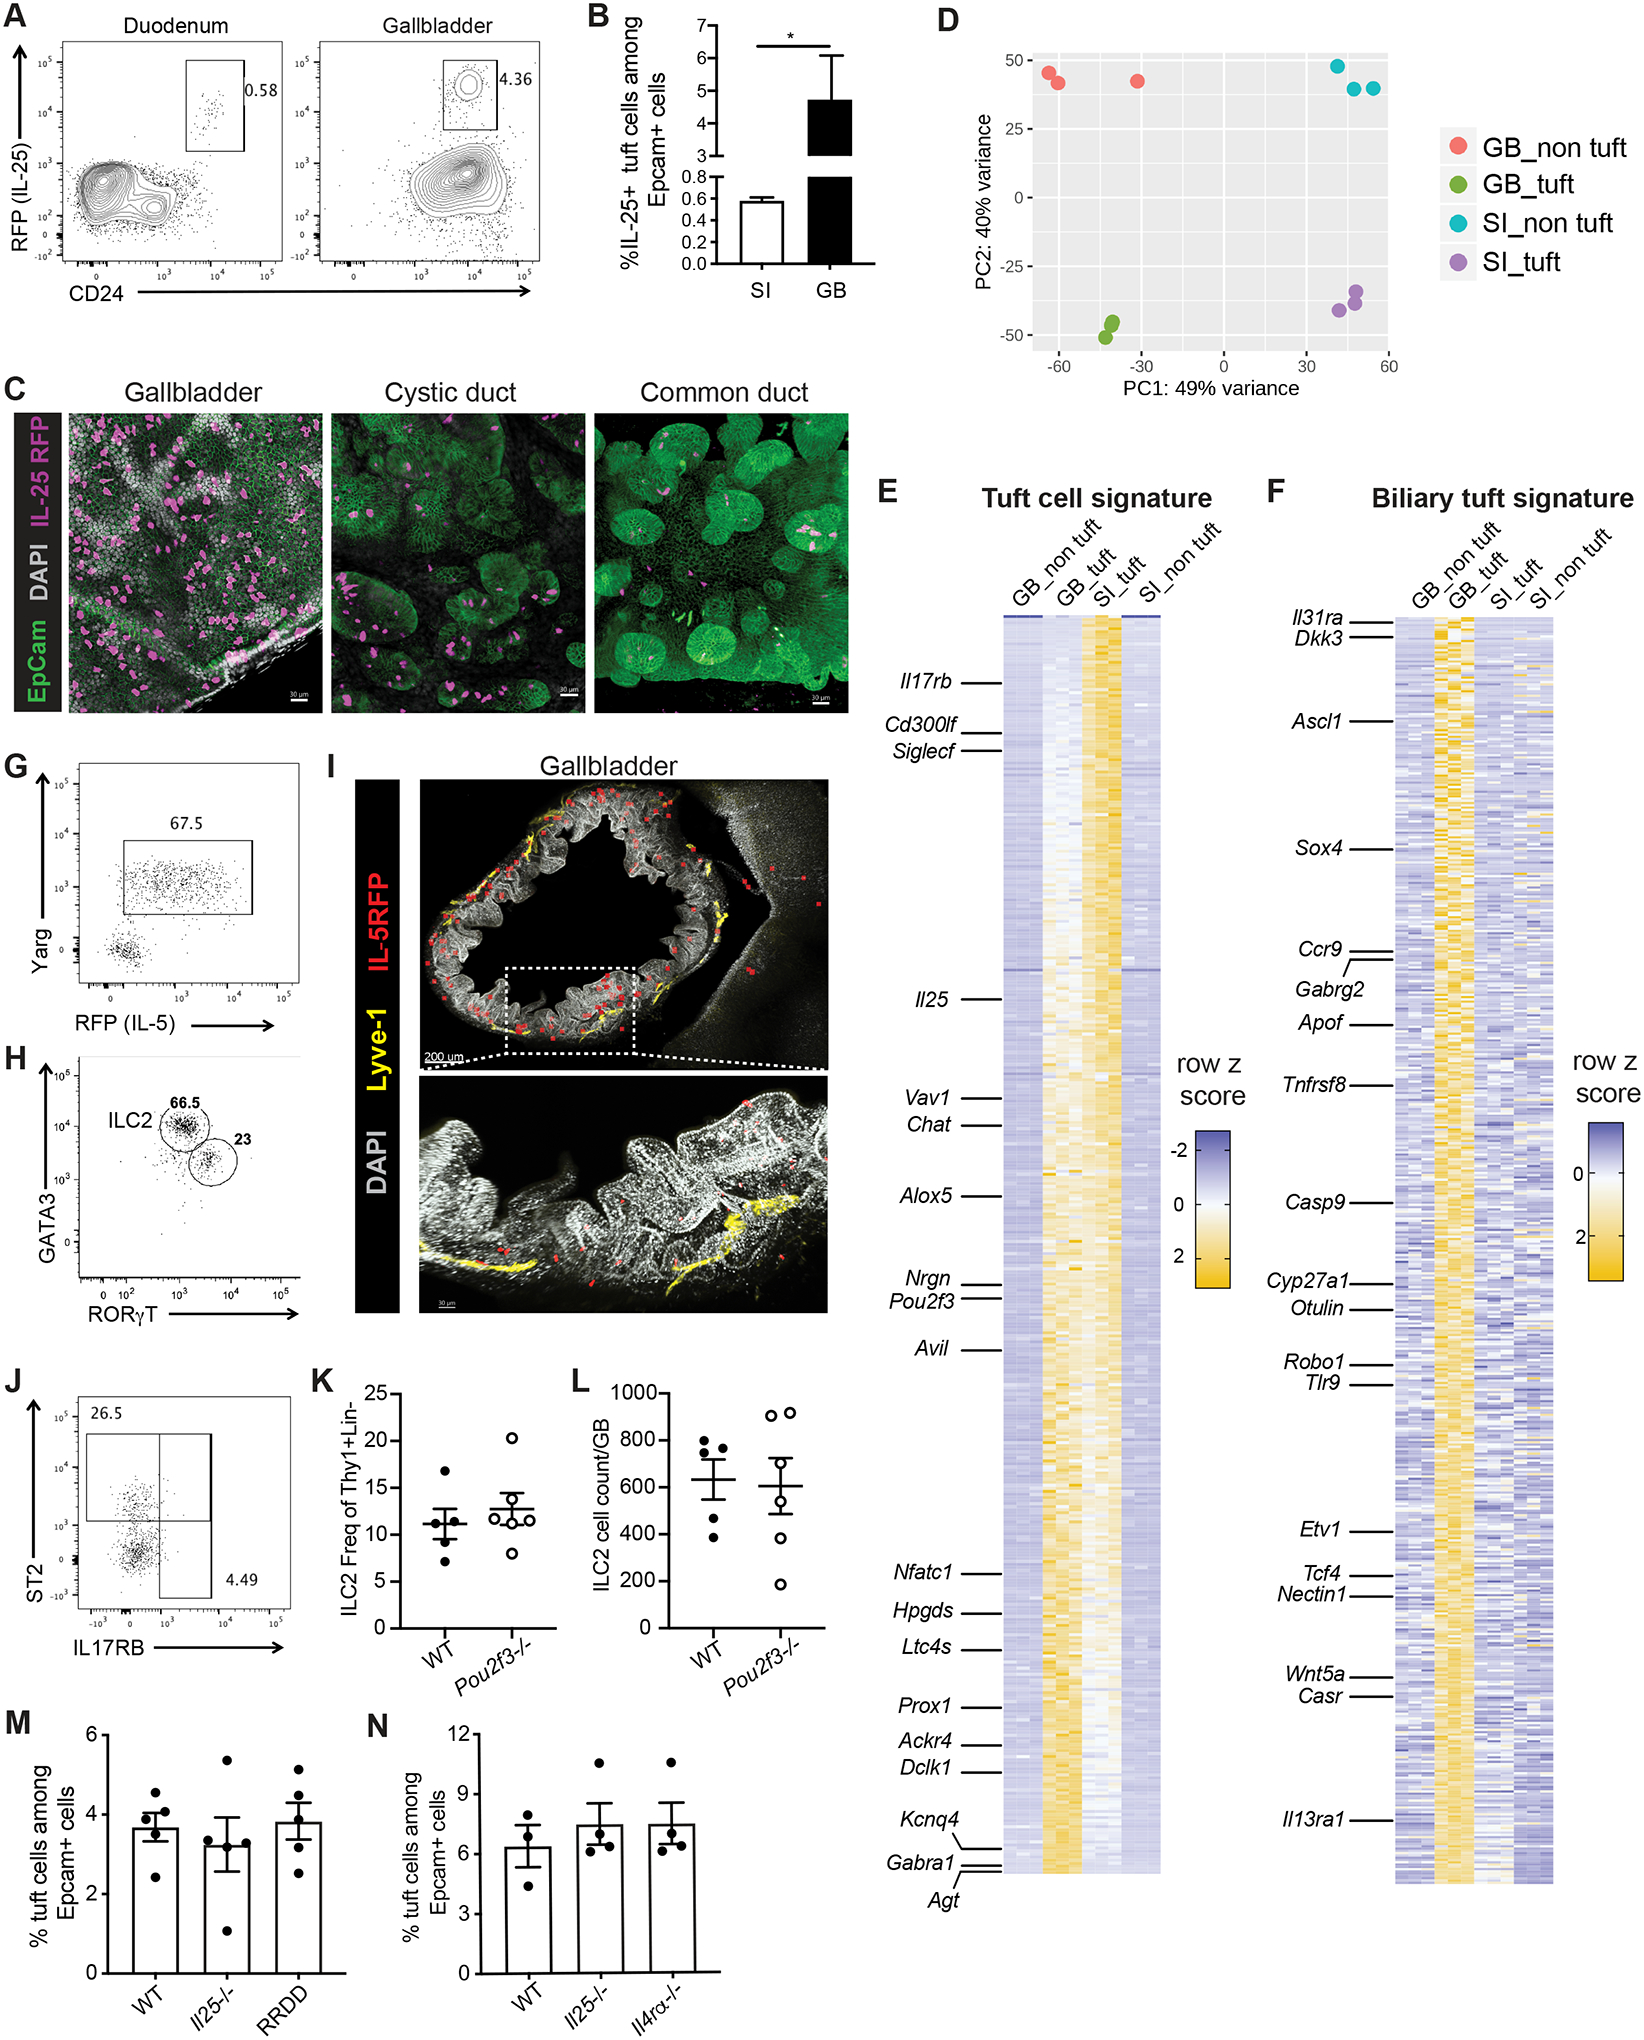
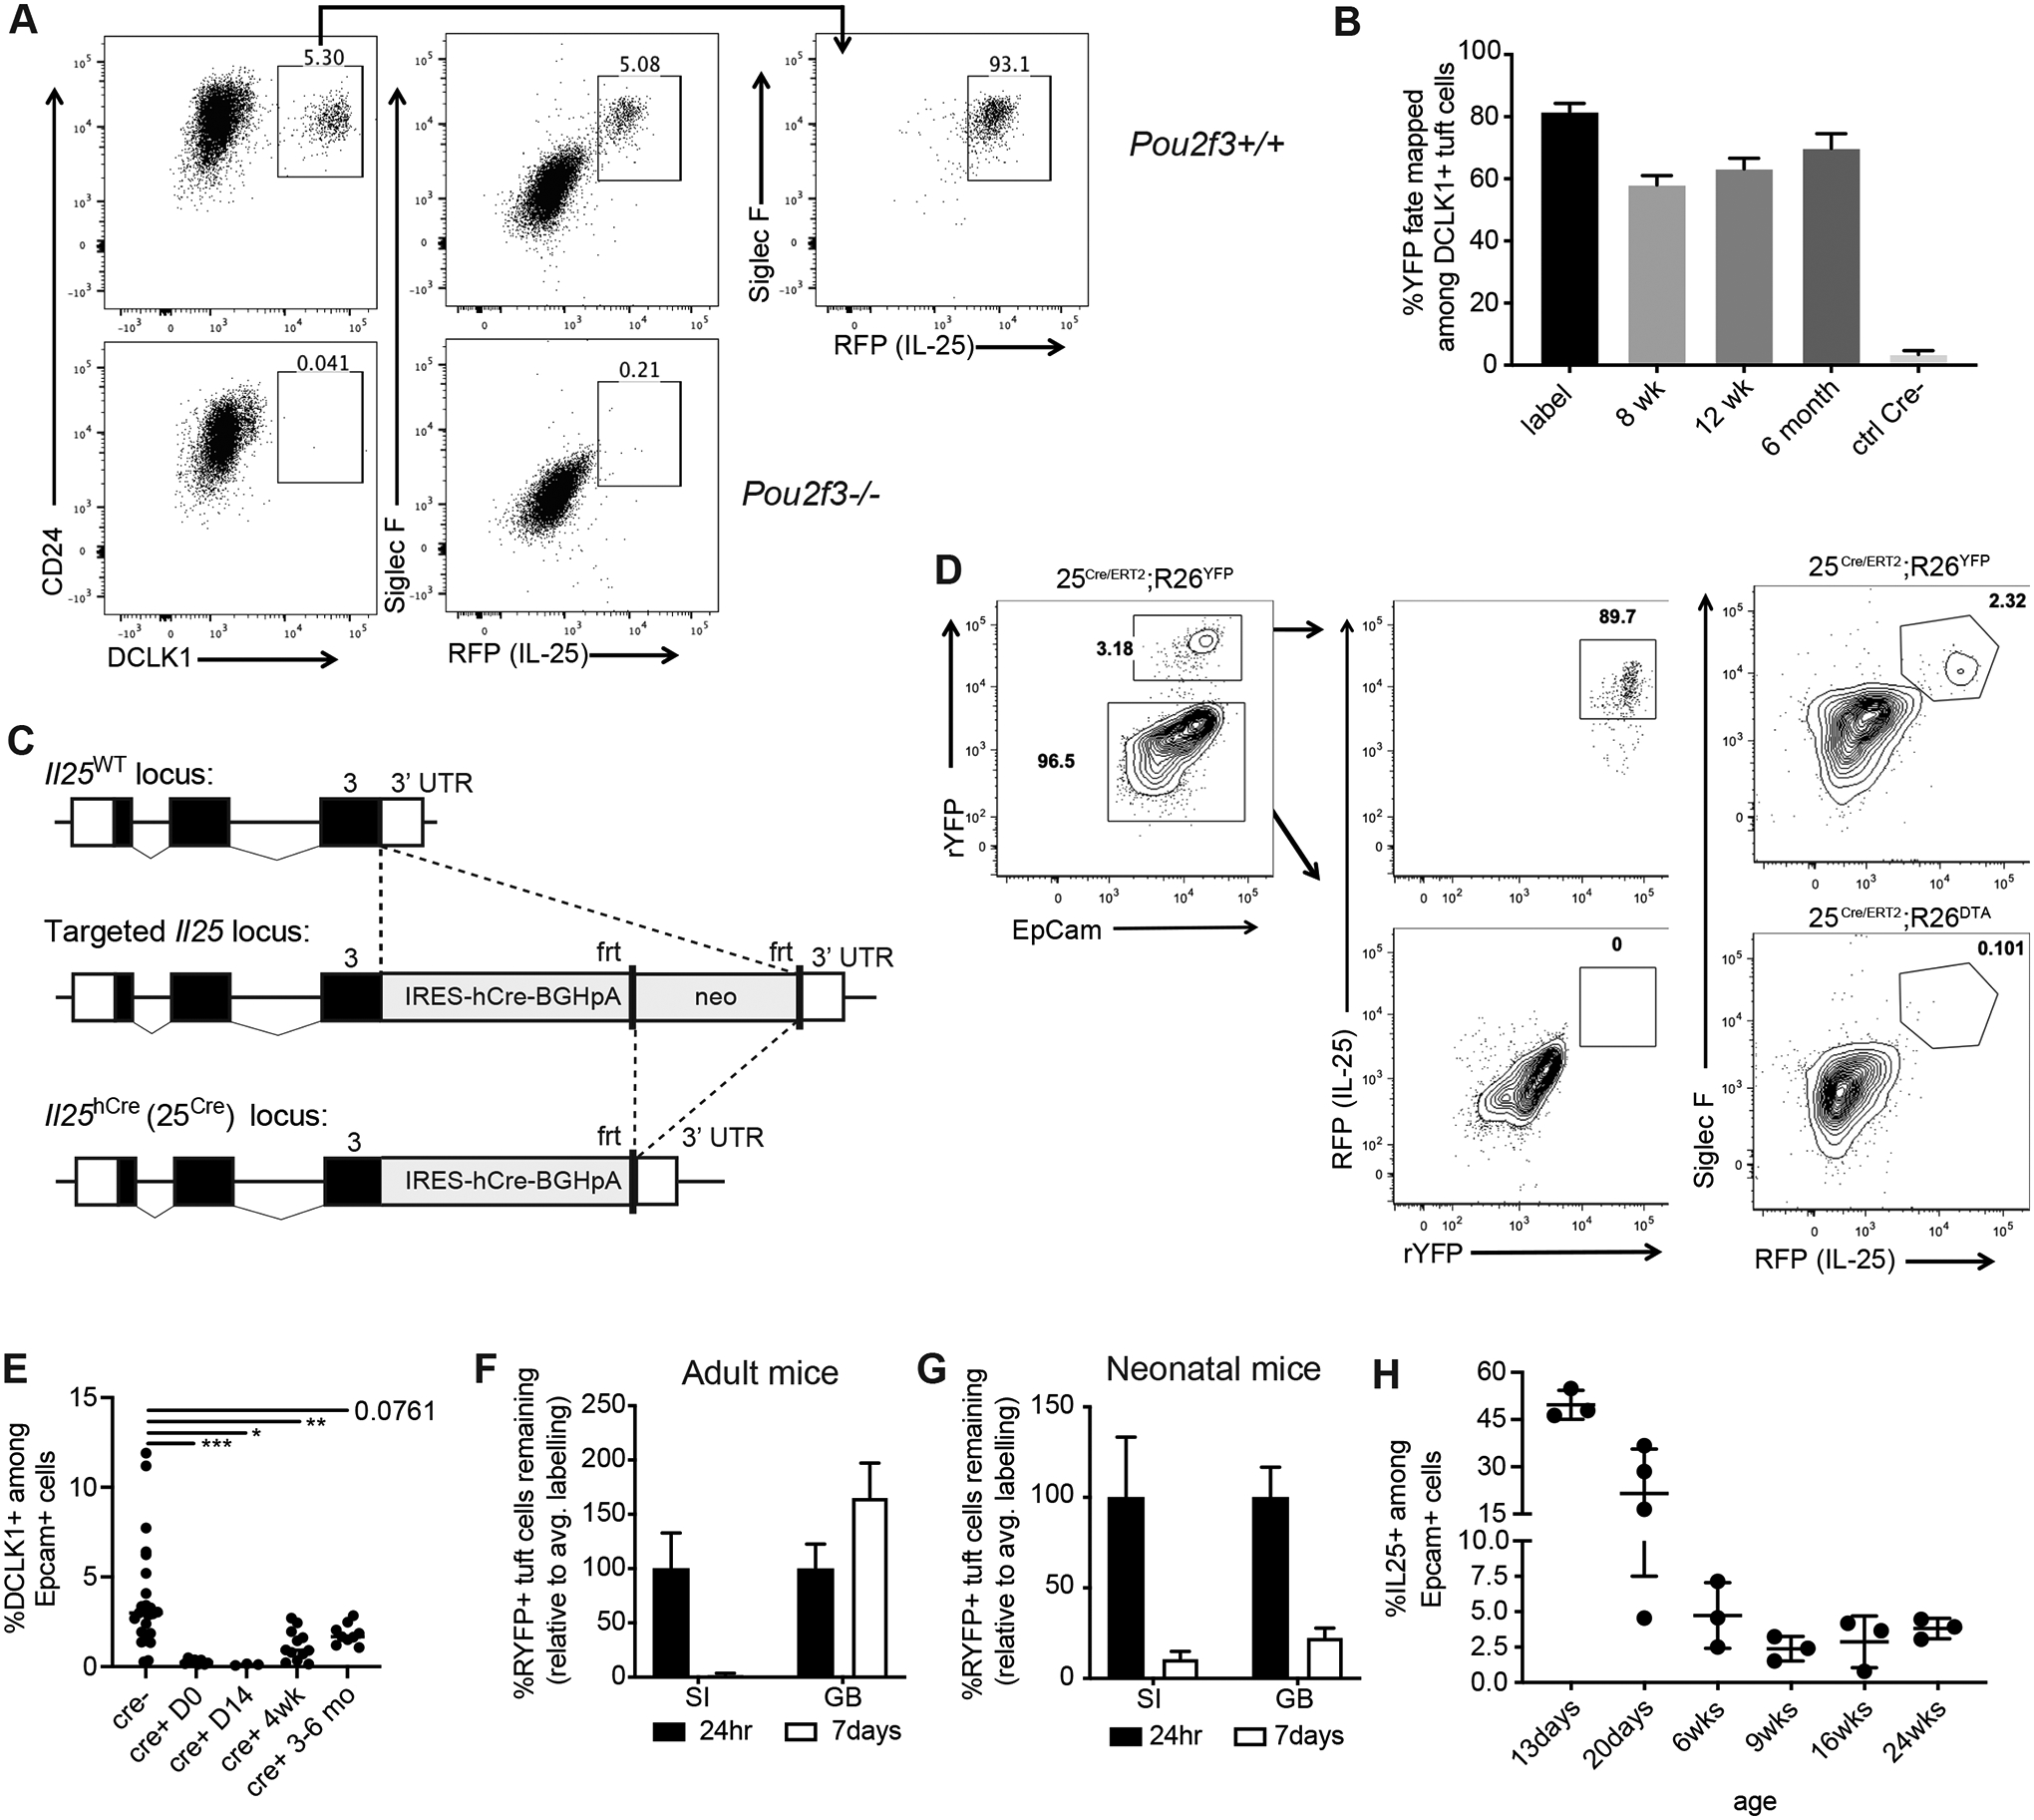
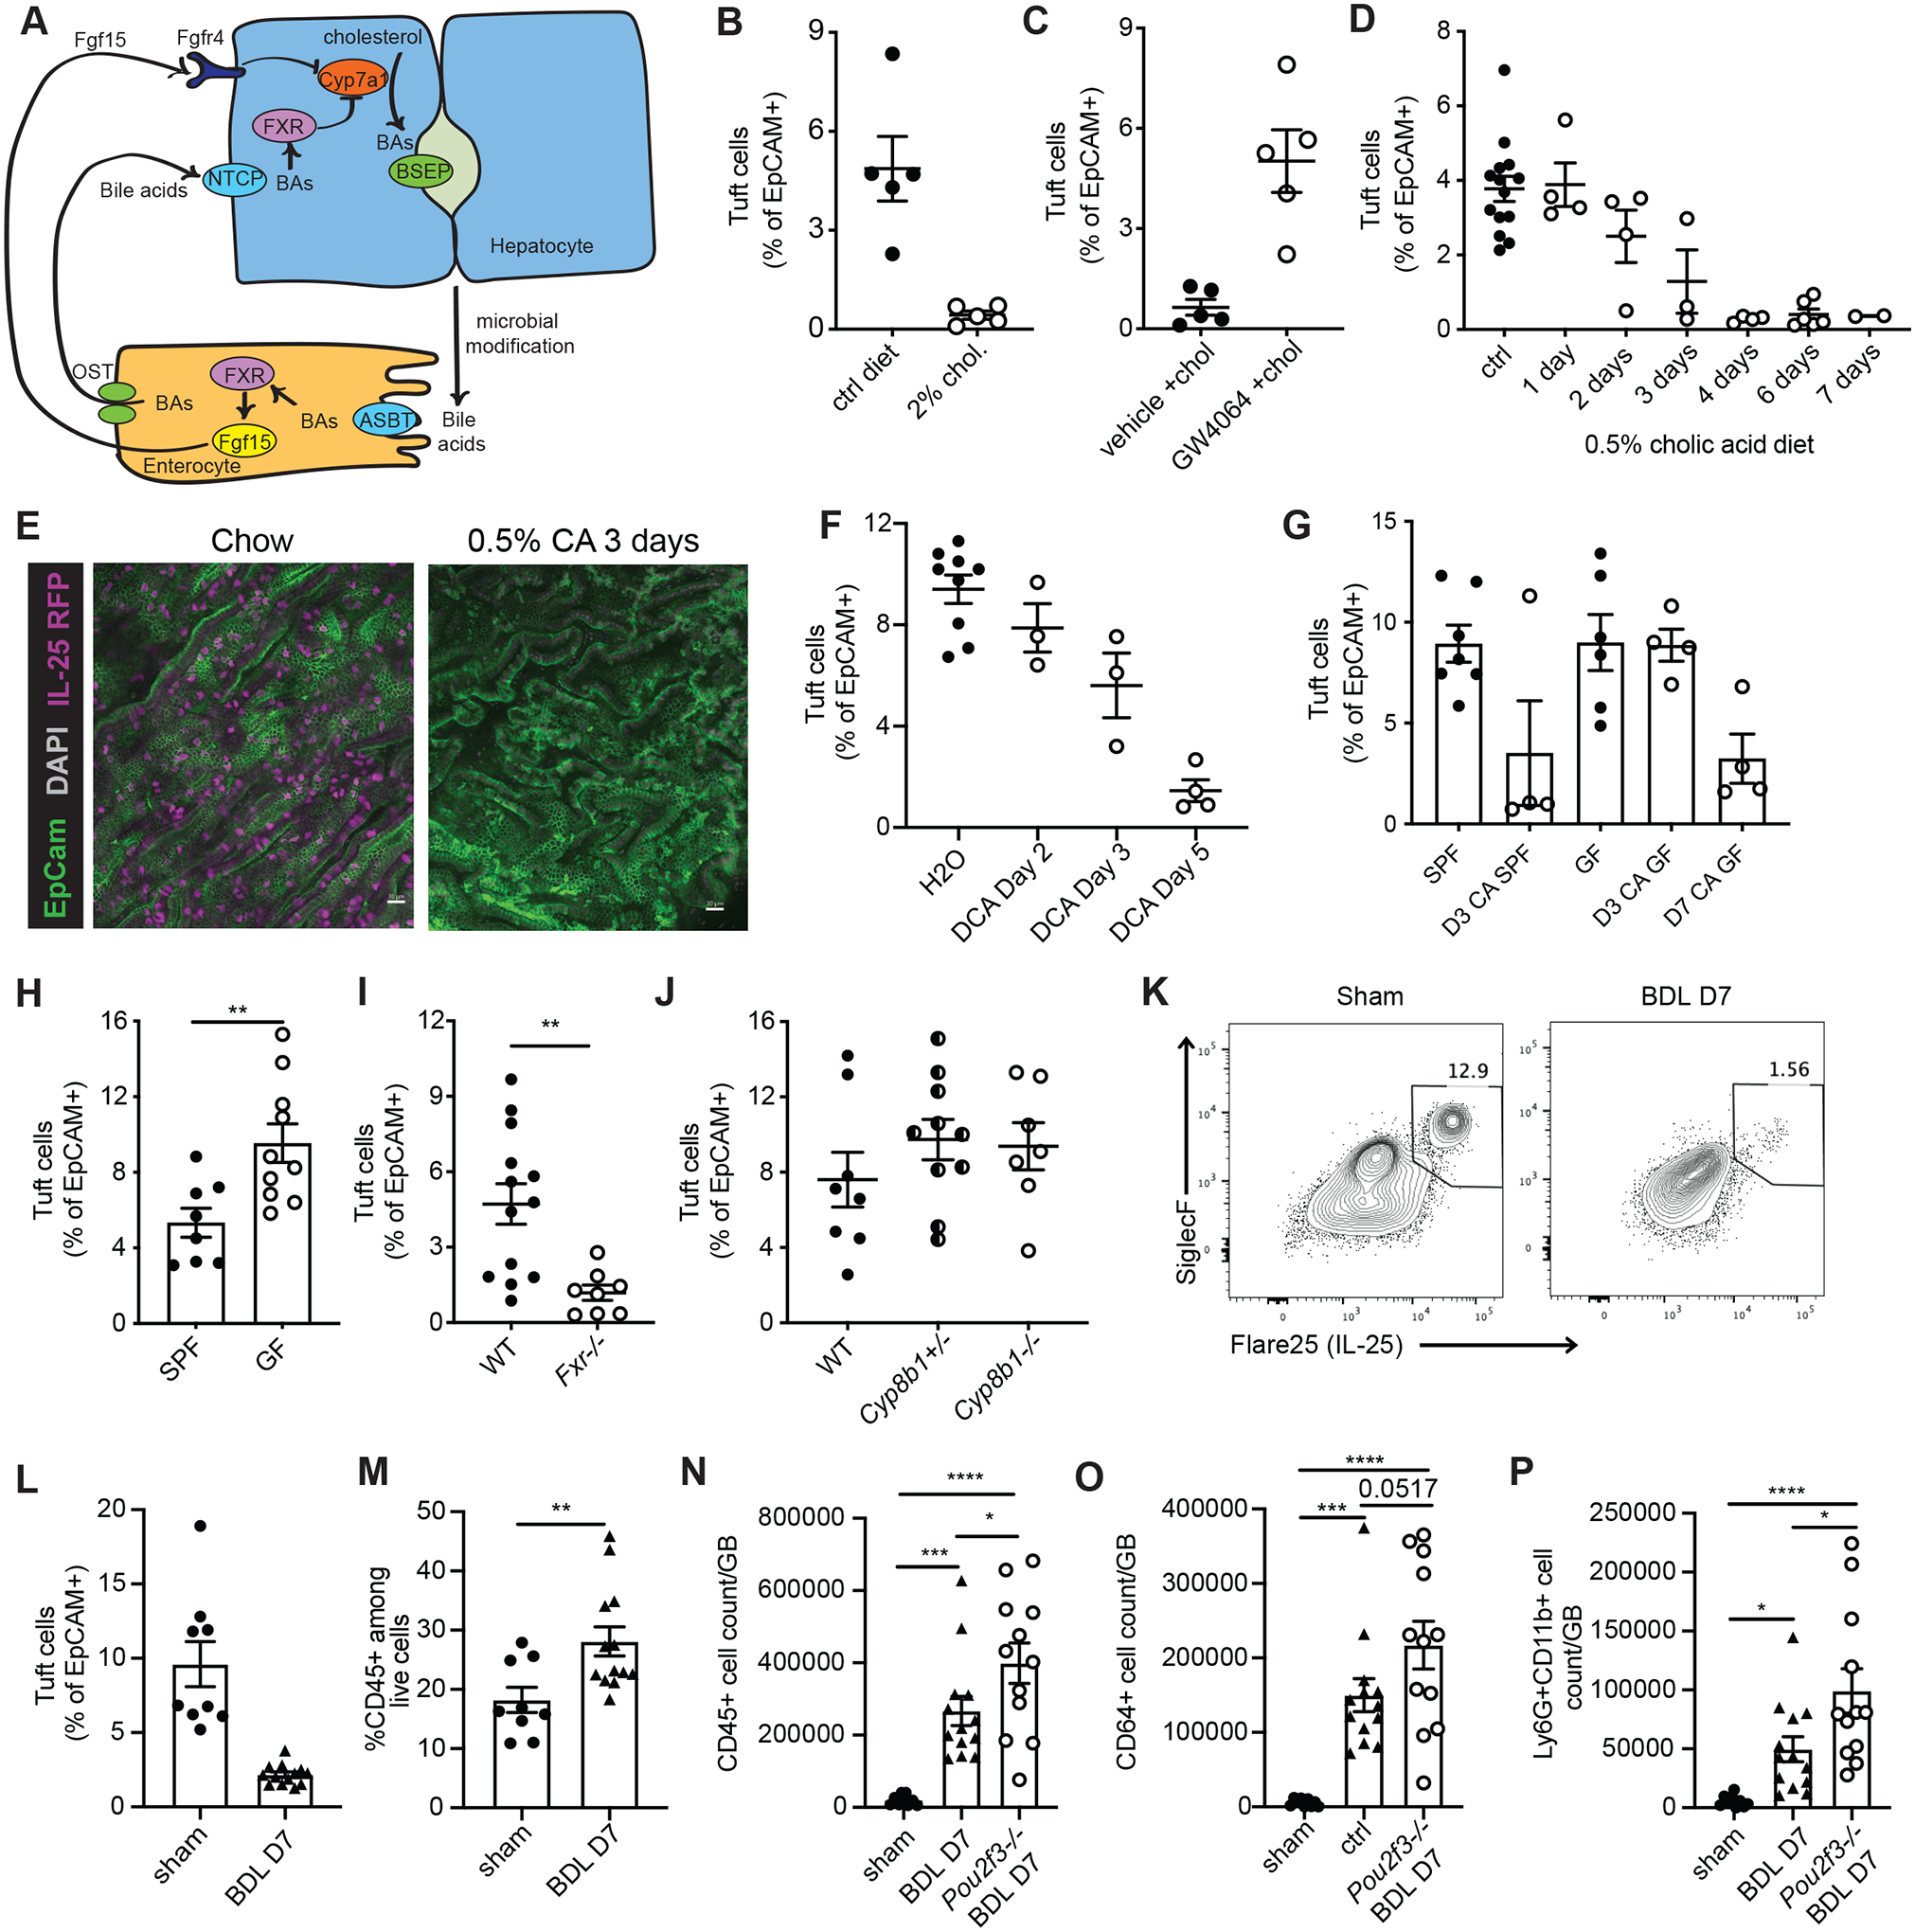
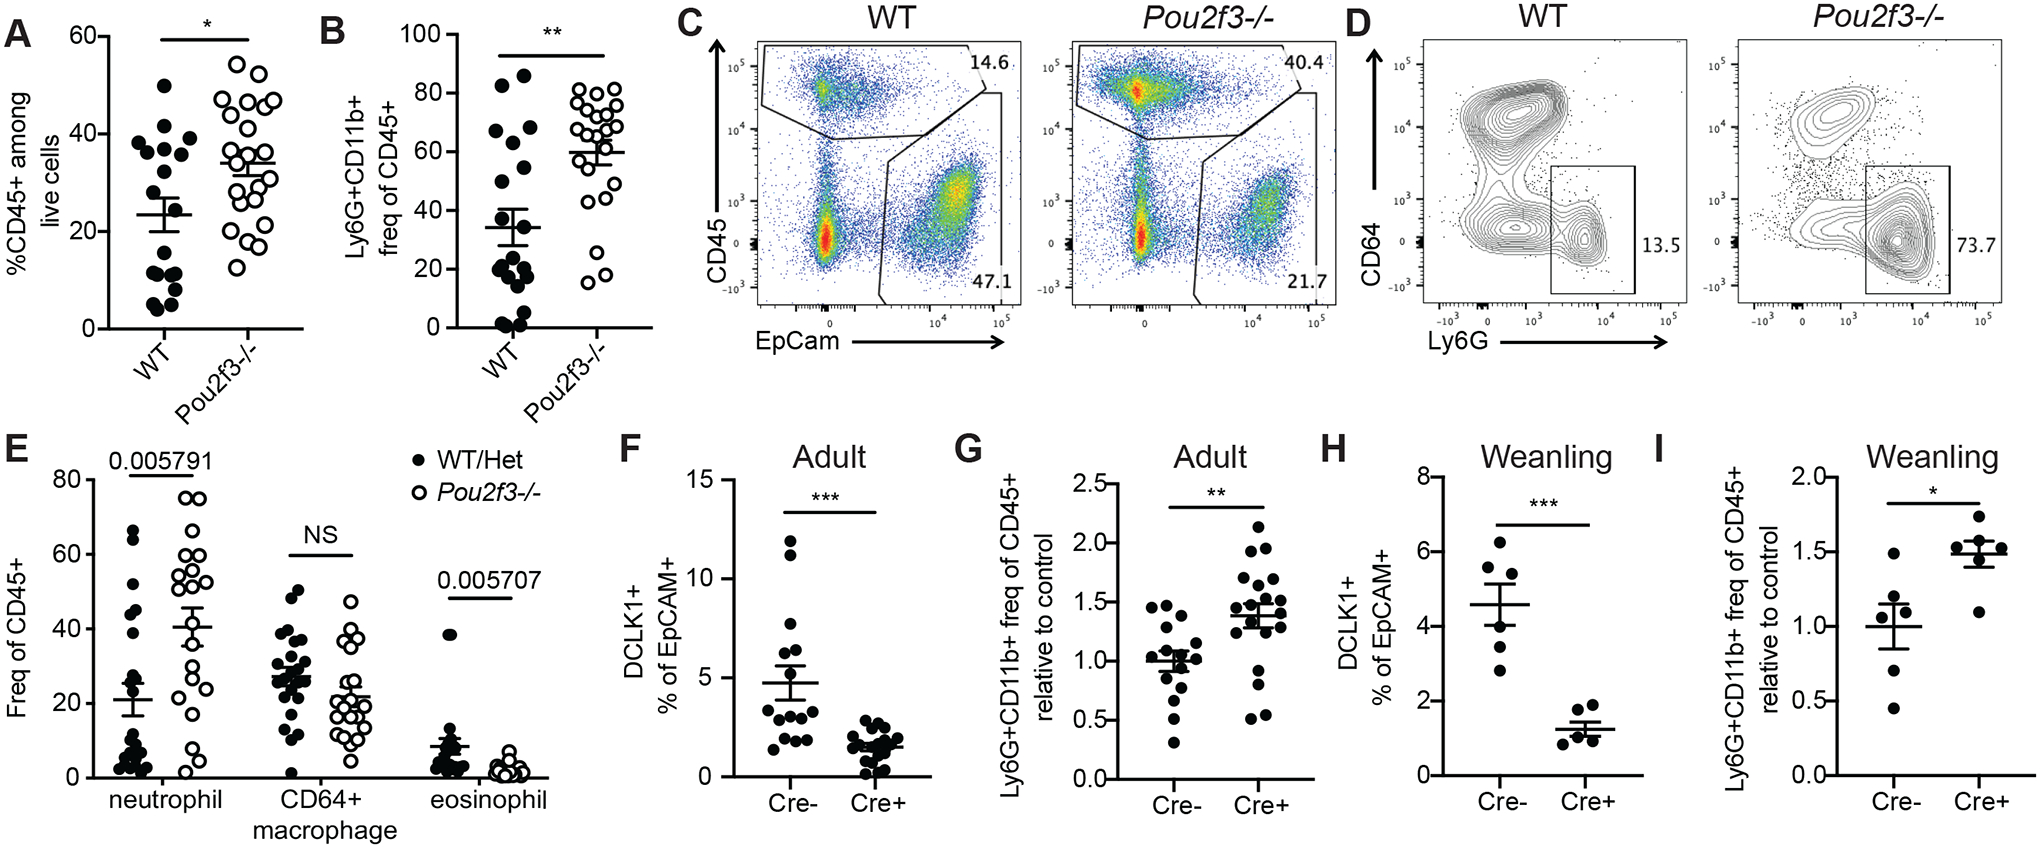
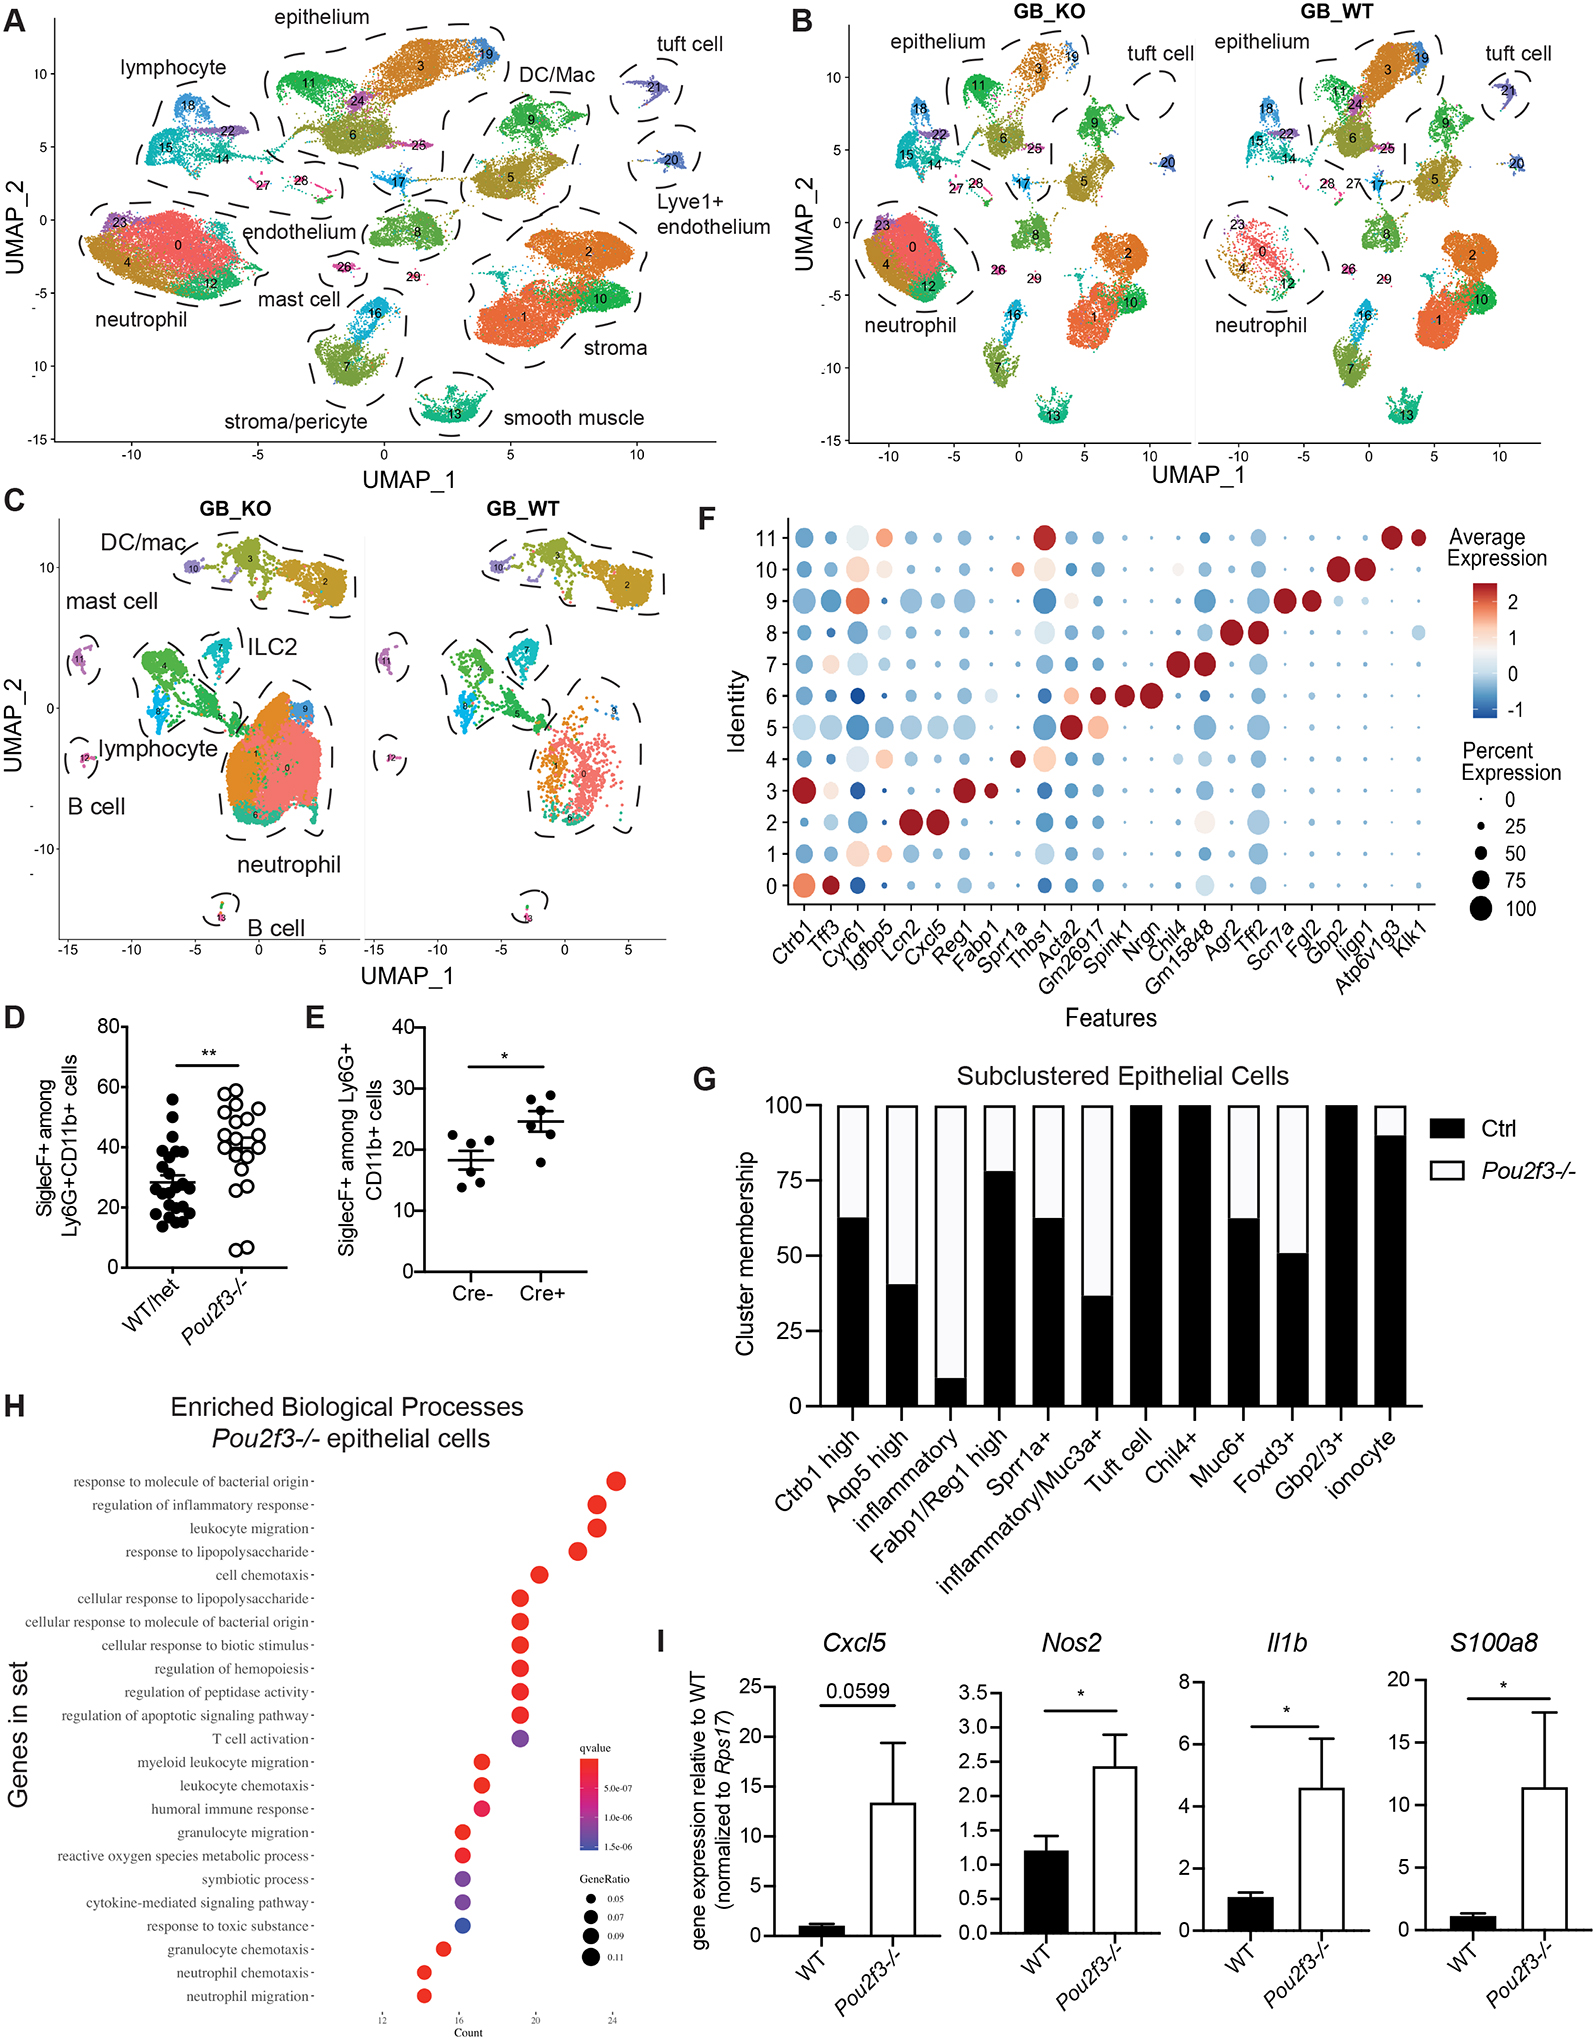
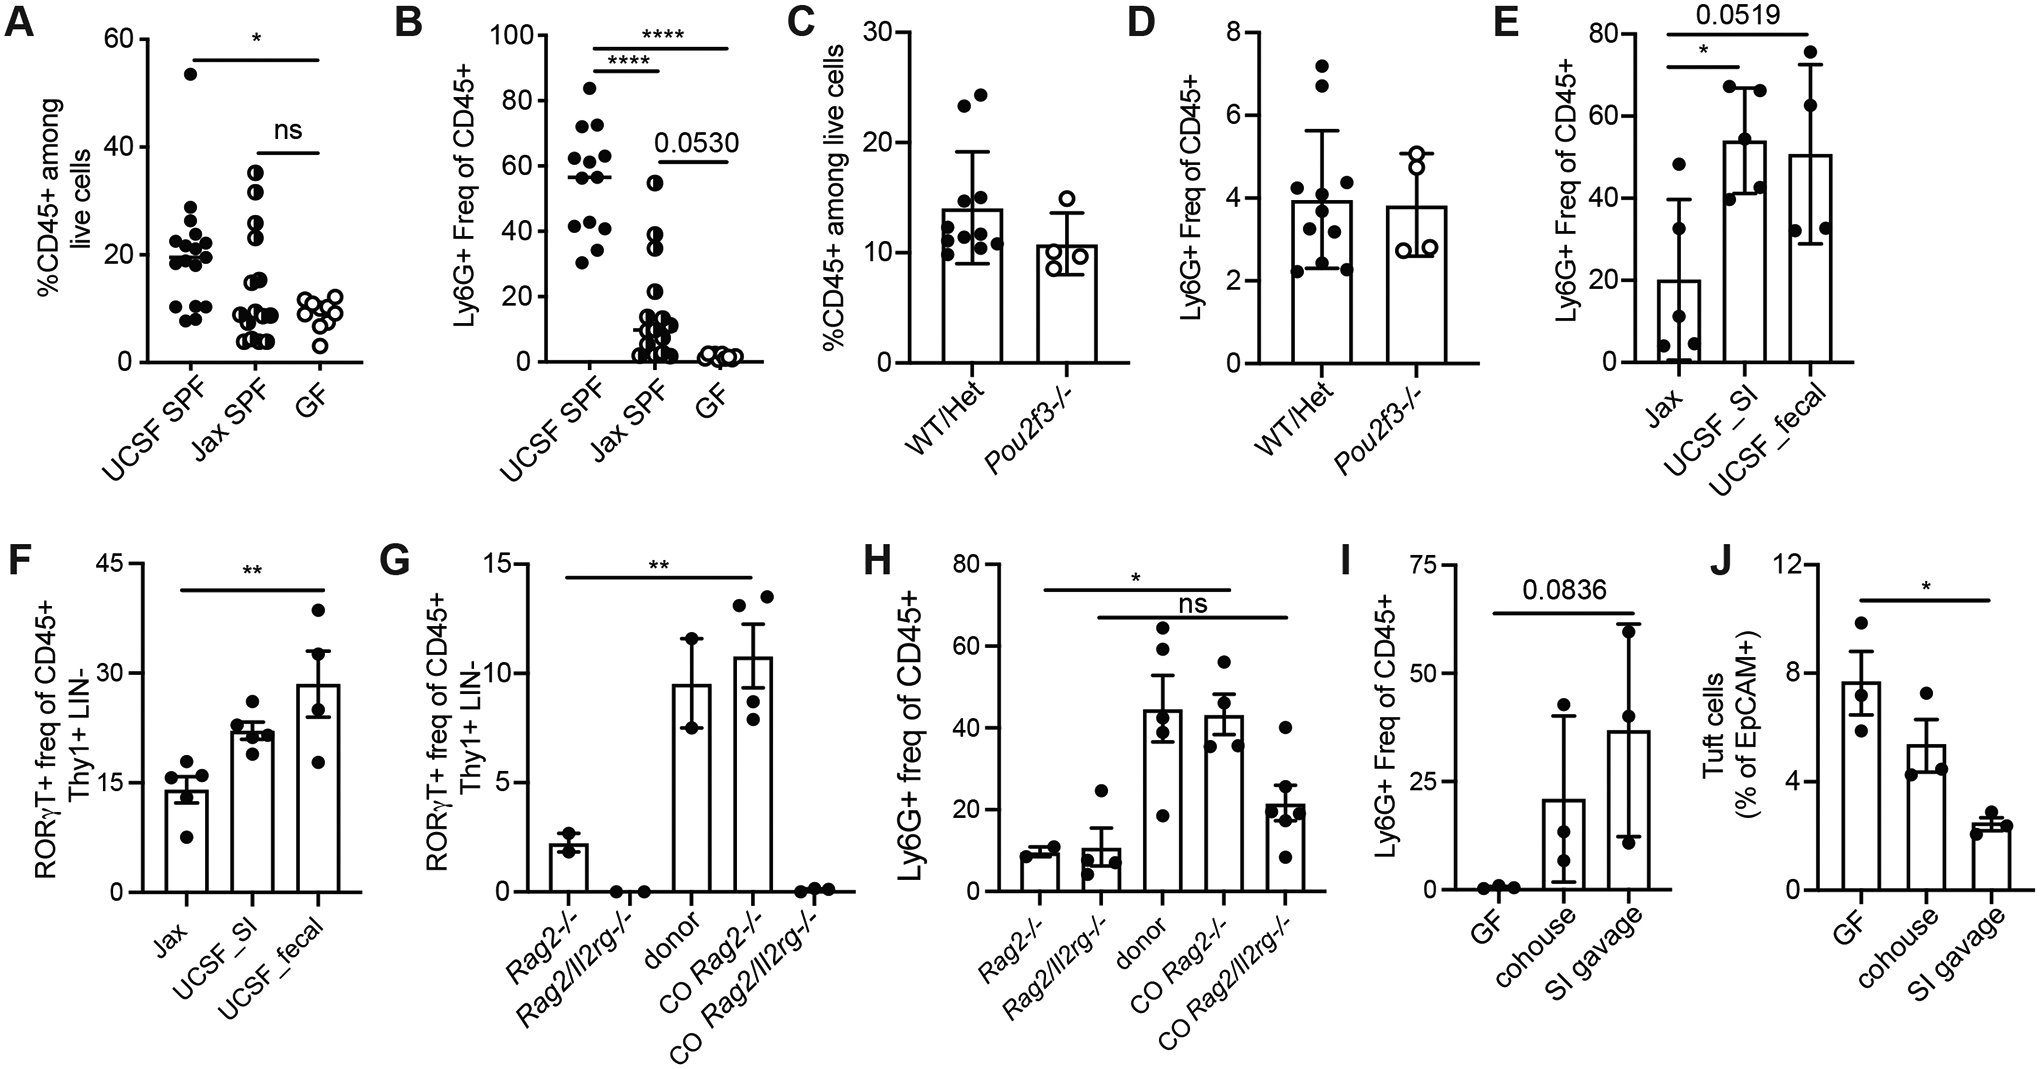
Inflammation and dysfunction of the extrahepatic biliary tree are common causes of human pathology, including gallstones and cholangiocarcinoma. Despite this, we know little about the local regulation of biliary inflammation. Tuft cells, rare sensory epithelial cells, are particularly prevalent in the mucosa of the gallbladder and extrahepatic bile ducts. Here, we show that biliary tuft cells express a core genetic tuft cell program in addition to a tissue-specific gene signature and, in contrast to small intestinal tuft cells, decreased postnatally, coincident with maturation of bile acid production. Manipulation of enterohepatic bile acid recirculation revealed that tuft cell abundance is negatively regulated by bile acids, including in a model of obstructive cholestasis in which inflammatory infiltration of the biliary tree correlated with loss of tuft cells. Unexpectedly, tuft cell-deficient mice spontaneously displayed an increased gallbladder epithelial inflammatory gene signature accompanied by neutrophil infiltration that was modulated by the microbiome. We propose that biliary tuft cells function as bile acid-sensitive negative regulators of inflammation in biliary tissues and serve to limit inflammation under homeostatic conditions.


Conflict of interest statement

Competing interests:

The authors have no competing interests to declare.

Figures

Fig. 1.
Fig. 1.. Biliary tuft cells express tuft cell-specific and tissue-specific gene signature and are not dependent on type 2 cytokines.
A,B) Epithelial cells from duodenum (SI) or gallbladder (GB) of IL-25 reporter (Flare25) mice were examined by flow cytometry. A) Representative flow plot. Previously gated on live singlets, FSC-A × SSC-A, EpCam+CD45-. B) IL-25+ cells as frequency of EpCam+ epithelial cells from SI and GB, 3 mice, *p<.05 by two-tailed paired T test. Representative of >3 experiments. C). Whole mount confocal imaging of Flare25 mouse GB, cystic duct, and common bile duct. D) Tuft and non-tuft epithelial cells were sorted from duodenum or GB of Flare25 mice and analyzed by RNA sequencing. Unsupervised PCA of top 500 genes by variance: biliary tuft (GB_tuft), biliary non-tuft (GB_non tuft), small intestinal tuft (SI_tuft), and small intestinal non-tuft (SI_non tuft). E,F) Row z score for tuft cell-specific transcripts (E) and (F) biliary tuft cell-specific transcripts. G,H) Representative flow plots. ILC2s identified in total GB/EHBD digests from Arginase1 (YARG) and IL-5 (Red5) reporter mice (G) and by transcription factor staining (H). Previously gated on live singlets, FSC-A × SSC-A, CD45+lineage-Thy1+,TCR-NKp46-NK1.1-. I) Imaging of GB and liver from RosaAi14-RFP × Red5 mice, stained for RFP (ILC2s, red), EpCam (green), LYVE-1 (yellow), and DAPI (gray). J) As in (G,H), staining for ST2 and IL17RB on ILC2s in total GB/EHBD digest. Previously gated on live singlets, FSC-A × SSC-A, CD45+lineage-Thy1+,TCR-NKp46-NK1.1-.YARG+. K,L) Relative frequency (K) and count (L) of ILC2s per GB/EHBD from WT and Pou2f3−/− YARG/Red5 reporter mice, as assessed by flow cytometry. M,N) Frequency of tuft cells among biliary epithelial cells from Il25−/−, ILC2 deficient (RRDD), and Il4Rα−/− mice determined by flow cytometry for DCLK1.
Fig. 2.
Fig. 2.. Biliary tuft cells exhibit developmental regulation
A) Total GB/EHBD digests from Flare25 reporter WT or Pou2f3−/− mice examined by flow cytometry for tuft cell surface markers (CD24 and Siglec F), expression of DCLK1 (intracellular staining), and endogenous RFP (IL-25). Previously gated on live singlets, FSC-A × SSC-A, EpCam+. B) Dclk1ERT2/+ ;R26YFP mice received two wks tamoxifen. Percent YFP expression among DCLK1+ epithelial cells was examined in total biliary GB/EHBD digests by flow cytometry after tamoxifen removal (label) and for indicated chase periods. C) Targeting strategy for IL-25 humanized cre mice. D) Co-expression of IL-25 reporter and 25cre-driven YFP expression in 25Cre/ERT2;R26YFP/+ and loss of RFP+ tuft cells in 25Cre/ERT2;R26DTA/+ mice were determined by flow cytometry. Representative flow plots. E) Tuft cell frequency in biliary epithelial prep from DT-injected 25Cre/+;R26iDTR/iDTR mice analyzed one day after DT (D0) and for indicated chase periods by intracellular staining for DCLK1. Significance determined by one-way ANOVA, *p<.05, **p<.01, ***p<.001. F,G) 25ERT/ERT2;R26YFP/YFP adult (G) or neonatal (p10-p12, H) mice were injected with tamoxifen; YFP expression among IL-25+ tuft cells was quantified in biliary epithelial prep by flow cytometry 24 hr and seven after the second injection. Data shown as percentage loss of YFP labelling relative to average 24 hr YFP expression in IL-25+ tuft cells. H). IL-25+ tuft cells in biliary epithelial prep were quantified by flow cytometry from Flare25 mice of the indicated ages.
Fig. 3.
Fig. 3.. Biliary tuft cell abundance is modulated by bile acids.
A) Schematic of BA regulation via enterohepatic recirculation. B) Flare25 mice were fed control (ctrl) diet or 2% cholestyramine (2% chol) diet for two wks; IL-25+ tuft cell frequency in biliary epithelial prep was determined by flow cytometry. Representative of three experiments. C) Flare25 mice fed 2% cholestyramine diet for ten days were injected IP every other day with GW4064 (GW4064 + chol) or vehicle (veh + chol) starting on day 1 of diet. Representative of three experiments. D) Flare25 mice were fed 0.5% cholic acid (CA) diet for the indicated time periods; IL-25+ tuft cell frequency in biliary epithelial prep was determined by flow cytometry. E) Wholemount confocal imaging of Flare25 GB from mice fed chow or 0.5% CA diet for three days. F) Germfree (GF) were fed irradiated 0.5% CA diet in sterile isolators. Frequency of DCLK1+ tuft cells among epithelial cells in total GB/EHBD digest was examined by flow cytometry at indicated timepoints and compared to SPF mice fed irradiated 0.5% CA diet. G) Flare25 mice received 0.2% sodium deoxycholate in drinking water ad libitum. Tuft cell frequency among epithelial cells from total GB/EHBD digest was determined by flow cytometry. H,I) Frequency of DCLK1+ tuft cells among epithelial cells from total GB/EHBD digests was analyzed by flow cytometry in age- and sex-matched H) SPF mice from the UCSF vivarium compared to GF mice and I) Fxr −/− and WT controls. J) The frequency of IL-25+ tuft cells among biliary epithelial cells from total GB/EHBD digests was examined by flow cytometry in Flare25 reporter Cyp8b1−/−, Cyp8b1+/−, and Cyp8b1+/+ mice. K-M) Flare25 mice were subjected to bile duct ligation (BDL) or sham surgery. Seven days later total GB/EHBD digests were analyzed by flow cytometry for frequency of IL-25+ tuft cells among epithelial cells (K,L) and frequency of CD45+ immune cells (M). N-P) Total GB/EHBD digests from Pou2f3−/− and littermate controls were analyzed by flow cytometry seven days after BDL or sham surgery. Total immune cells (CD45+, N), macrophages (CD64+CD11b+Ly6G-, O), and neutrophils (Ly6G+CD11b+CD64-, P) were enumerated. Significance determined by unpaired two-tailed T test (H,I,M) or one-way ANOVA (N-P), *p<.05, **p<.01, ***p<.001, ****p<.0001.
Fig. 4.
Fig. 4.. Pou2f3−/− mice have increased biliary neutrophil infiltration under homeostatic conditions.
A-B) Relative frequency of CD45+ cells (among live cells, A) and neutrophils (Ly6G+CD11b+CD64- among CD45+ cells, B) as assessed by flow cytometry on total GB/EHBD digests from non-littermate age- and sex-matched Pou2f3−/− and WT mice. Statistical significance determined by unpaired two-tailed T test. C-E) Total GB/EHBD digests from littermate Pou2f3−/− and control mice were analyzed by flow cytometry for presence of CD45+ cells (representative flow plot previously gated on live singlets, FSC-A × SSC-A, C) and frequency of neutrophils (Ly6G+CD11b+CD64-), macrophages (CD64+CD11b+Siglec F-Ly6G-) and eosinophils (Siglec F+CD11b+Ly6G-CD64) among CD45+ cells (D,E). P values calculated by one-way ANOVA (E). F-I) 25cre/+;RosaiDTR or 25+/+;RosaiDTR littermate mice received two retroorbital injections of diphtheria toxin. Frequency of tuft cells among epithelial cells (F,H) and neutrophils among CD45+ cells (G, I) in total GB/EHBD digests were determined by flow cytometry. F,G) Adult mice were injected at 8 wks of age and chased 1–6 months. Data pooled from four experiments. H,I) Mice were injected at weaning and analyzed 4–6 wks later. Data pooled from two experiments. G,I) Neutrophil frequencies were normalized to the average of control cre- mice per experiment. Statistical significance determined by unpaired two-tailed T test (F-I). *p<.05, **p<.01, ***p<.001, ****p<.0001.
Fig. 5.
Fig. 5.. Total biliary scRNA-seq reveals heightened inflammatory tone of biliary tissue in the absence of tuft cells.
A-B) Live cells were sorted from Pou2f3−/− and littermate controls total GB/EHBD digests and subjected to single cell sequencing using the 10X platform. UMAP shows major cell types, determined by canonical gene expression. C) Subclustered CD45+ cells split by genotype: Pou2f3−/− (GB_KO), littermate controls (GB_WT) . D,E) Quantification of Siglec F+ neutrophils from littermate Pou2f3−/− and littermate controls (D) and 25cre/+;R26iDTR or 25+/+;R26iDTR/iDTR mice injected with diphtheria toxin at 4 wks of age and analyzed 4–6 wks later (E) as determined by flow cytometry on total GB/EHBD digests. F) Dotplot of top two most differentially expressed genes (DEGs) after subclustering of biliary epithelial cells. G) Epithelial cell cluster membership after normalizing to the total number of epithelial cells sequenced per genotype. H) Gene ontology biological processes enrichment for genes upregulated in epithelial cells from Pou2f3−/− mice compared to controls. I) Total GB/EHBD from non-littermate Pou2f3−/− (n=17) and WT (n=15) mice was analyzed by qPCR for the indicated target genes relative to the housekeeping gene Rps17. Data pooled from three experiments, Pou2f3−/− RQ normalized to average of WT mice in each experiment. Statistical significance determined by unpaired student’s T-test.
Fig. 6.
Fig. 6.. Biliary neutrophilia is driven by microbiota.
A,B) Frequency CD45+ cells among live cells (B), and frequency of Ly6G+CD11b+ neutrophils among CD45+ cells (B) in total GB/EHBD digests from UCSF-housed SPF mice compared to Jax SPF mice and germfree (GF) mice analyzed by flow cytometry. C,D) Frequency CD45+ cells among live cells (C), and frequency of Ly6G+CD11b+ neutrophils among CD45+ cells (D) in total GB/EHBD digests from 3.5 wk old Pou2f3−/− mice and littermate controls analyzed by flow cytometry. E,F) Jax mice received fecal or small intestinal contents from UCSF donor mice by oral gavage and were analyzed 6 wks later by flow cytometry on total GB/EHBDs for frequency of Ly6G+CD11b+ neutrophils (E) or RORγT+ lymphocytes (F) as identified by intracellular staining. G, H) Rag2−/− or Rag2/Il2rg−/− mice from Taconic were cohoused with UCSF donor mice for 6 wks. RORγT+ lymphocytes and neutrophils were quantified by flow cytometry on total GB/EHBDs. I,J) GF mice received small intestinal contents from UCSF donor mice by oral gavage or were cohoused with UCSF donors. 6 wks later mice were compared to GF controls by flow cytometry on total GB/EHBDs analyzing frequency of Ly6G+CD11b+ neutrophils (I) or tuft cells (J) by intracellular staining. P values calculated by one-way ANOVA. *p<.05, **p<.01, ****p<.0001. All data shown +/− SEM.

Comment in

References

    1. Wahlstrom A, Sayin SI, Marschall HU, Backhed F, Intestinal Crosstalk between Bile Acids and Microbiota and Its Impact on Host Metabolism. Cell Metab 24, 41–50 (2016). - PubMed
    1. Gorham F. W. a. I., A. C., General function of the gall bladder from the evolutionary standpoint. American Journal of Digestive Diseases and Nutrition 22, (1938).
    1. Higashiyama H, Uemura M, Igarashi H, Kurohmaru M, Kanai-Azuma M, Kanai Y, Anatomy and development of the extrahepatic biliary system in mouse and rat: a perspective on the evolutionary loss of the gallbladder. Journal of anatomy 232, 134–145 (2018). - PMC - PubMed
    1. Jia W, Xie G, Jia W, Bile acid-microbiota crosstalk in gastrointestinal inflammation and carcinogenesis. Nat Rev Gastroenterol Hepatol 15, 111–128 (2018). - PMC - PubMed
    1. Jansen PL, Ghallab A, Vartak N, Reif R, Schaap FG, Hampe J, Hengstler JG, The ascending pathophysiology of cholestatic liver disease. Hepatology (Baltimore, Md.) 65, 722–738 (2017). - PubMed

Publication types

Substances