. 2022 Mar 4;8(9):eabm5386.
doi: 10.1126/sciadv.abm5386. Epub 2022 Mar 4.

Comprehensive genetic diagnosis of tandem repeat expansion disorders with programmable targeted nanopore sequencing

Affiliations

Comprehensive genetic diagnosis of tandem repeat expansion disorders with programmable targeted nanopore sequencing

Igor Stevanovski et al. Sci Adv. .

Abstract

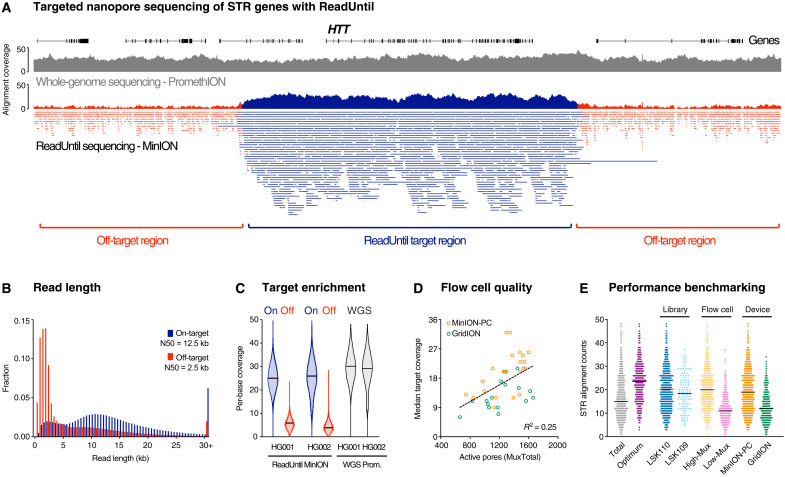
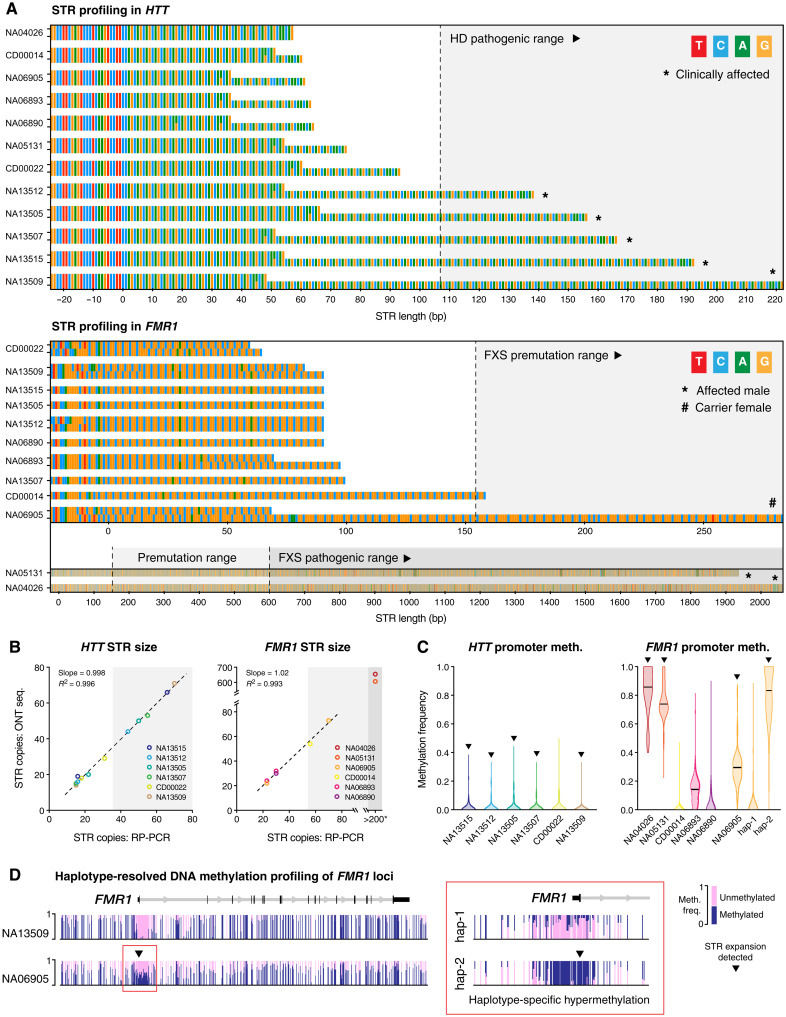
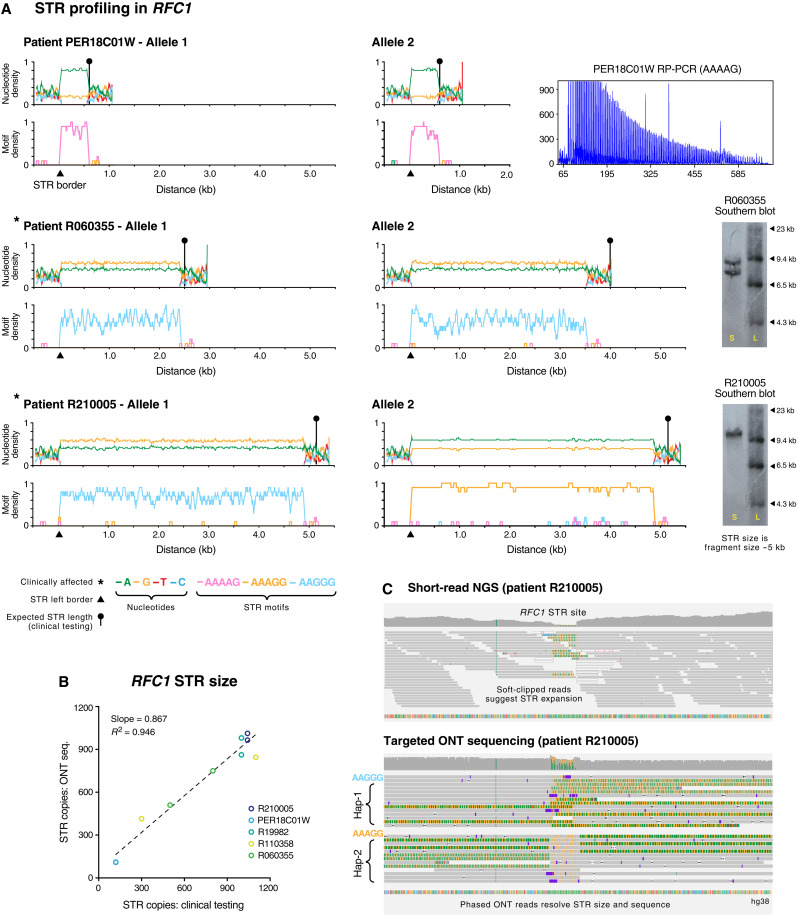
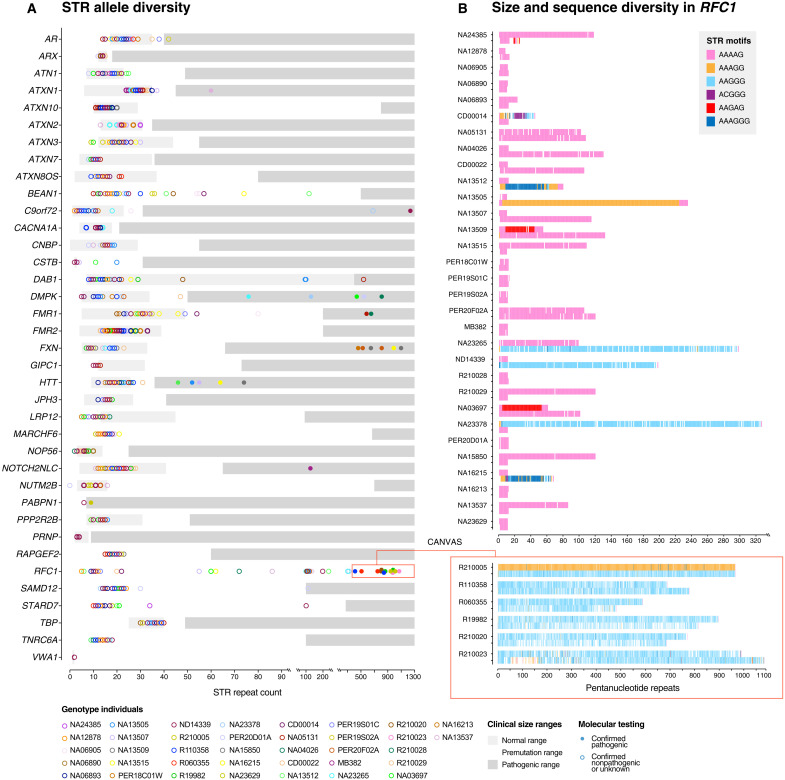
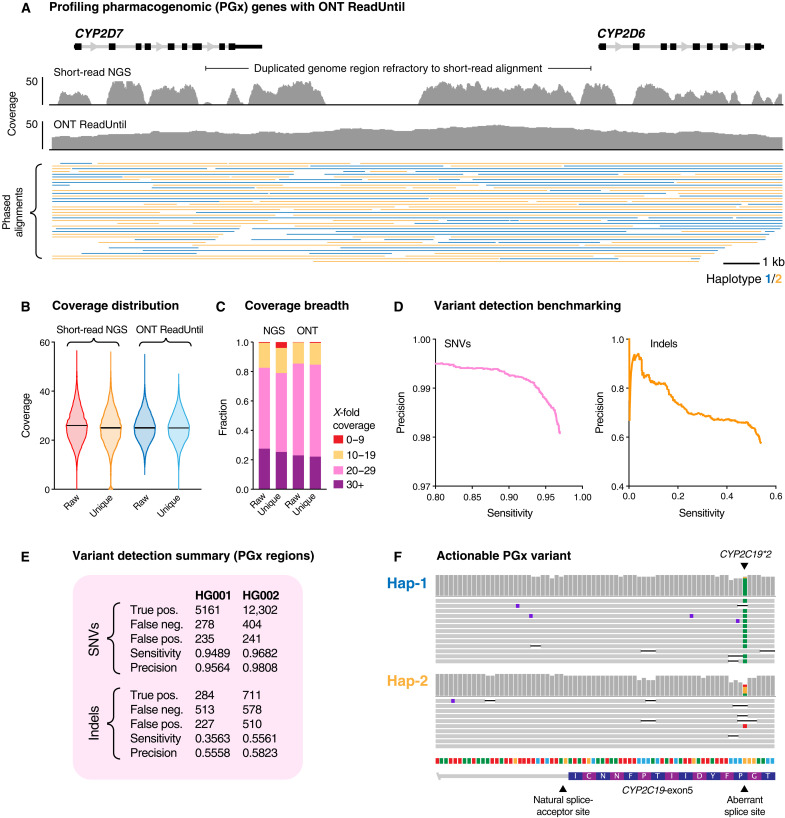
More than 50 neurological and neuromuscular diseases are caused by short tandem repeat (STR) expansions, with 37 different genes implicated to date. We describe the use of programmable targeted long-read sequencing with Oxford Nanopore's ReadUntil function for parallel genotyping of all known neuropathogenic STRs in a single assay. Our approach enables accurate, haplotype-resolved assembly and DNA methylation profiling of STR sites, from a list of predetermined candidates. This correctly diagnoses all individuals in a small cohort (n = 37) including patients with various neurogenetic diseases (n = 25). Targeted long-read sequencing solves large and complex STR expansions that confound established molecular tests and short-read sequencing and identifies noncanonical STR motif conformations and internal sequence interruptions. We observe a diversity of STR alleles of known and unknown pathogenicity, suggesting that long-read sequencing will redefine the genetic landscape of repeat disorders. Last, we show how the inclusion of pharmacogenomic genes as secondary ReadUntil targets can further inform patient care.


Figures

Fig. 1.
Fig. 1.. Targeted sequencing of pathogenic STR sites with ONT ReadUntil.
(A) Genome browser view shows sequencing alignments to the HTT locus and surrounding regions for a typical ONT ReadUntil experiment (lower track). Location of ReadUntil target region for HTT is marked below, and on-target (navy) versus off-target alignments (red) are distinguished by color. For comparison, a coverage track is also shown for a typical whole-genome ONT sequencing experiment (gray). (B) Histograms compare read length distribution for on-target (navy; N50 = 12.5 kb) versus off-target (red; N50 = 2.5 kb) alignments. Data are averaged over all ReadUntil experiments from the study (n = 37). (C) Violin plots show per-base coverage distributions within on-target regions (navy) versus randomly selected off-target genes (red) during ReadUntil sequencing of HG001 and HG002 reference samples, with data from whole-genome sequencing (WGS; gray) shown for comparison. (D) Scatterplot shows median coverage across on-target regions, relative to the starting number of active pores (MuxTotal) on each ONT flow cell. Colors distinguish ReadUntil experiments run on an ONT GridION (green; NVIDIA Quadro GV100 GPU; n = 16) or a high-specification PC workstation (orange; NVIDIA 3090 GPU; n = 22); see table S5 for full specifications. (E) Dot plots show the number of alignments spanning STR sites (n = 37) across all ONT ReadUntil experiments (n = 37). Colors distinguish runs performed with LSK110 (navy) versus LSK109 (blue) library preparation kit, high quality (MuxTotal > 1200 pores; yellow) versus low quality (MuxTotal < 1200 pores; pink), and GridION (green) versus MinION-PC device (orange). Data from runs with “optimum” parameters (LSK110 + MuxTotal > 1200 pores + MinION-PC device; purple) yielded a median of 24 alignments spanning target STR sites.
Fig. 2.
Fig. 2.. Haplotype-resolved assembly and DNA methylation profiling of HTT and FMR1.
(A) Sequence barcharts show HTT (top) and FMR1 (bottom) STR alleles, including 25 bp of upstream flanking sequence, assembled from ONT sequencing of relevant Coriell reference DNA samples (n = 12; see table S3). Two alleles are shown for each individual, excepting FMR1 for male individuals, where only one copy is present. Clinically affected and premutation carrier individuals are marked, based on clinical information from Coriell. Further details of individuals are shown in fig. S2 (Ai and Bi). (B) Scatterplots show lengths of STR alleles in HTT (CAGn; left) and FMR1 (CGGn; right) as determined by ONT sequencing versus RP-PCR (data from Coriell). For FMR1, two samples exceeded the upper limit of RP-PCR genotyping (~CGG200). (C) For the same samples, violin plots show distribution of DNA methylation frequencies recorded at CpG sites within the promoter regions of HTT (left) and FMR1 (right). Triangles indicate which samples contained pathogenic STR expansions. For sample NA06905, differential methylation was observed between the two FMR1 haplotypes; these are shown separately. (D) Genome browser view shows examples of DNA methylation profiles across the complete FMR1 locus for two samples: NA13509 (female with no STR expansion in FMR1) and NA06905 (female carrier of FMR1 premutation). Inset shows haplotype-specific promoter methylation in NA06905.
Fig. 3.
Fig. 3.. Haplotype-resolved assembly of pathogenic STR site RFC1.
(A) Line plots show nucleotide content (top) and density of pentanucleotide STR motifs (bottom) enumerated in a 50-bp sliding window across assembled STR alleles (including 1-kb up/downstream flanking sequences). Data are shown for three consenting individuals that were subjected to clinical testing for STR expansions in RFC1. Relevant molecular testing data (RP-PCR or Southern blot) are shown for each individual (see table S3). Asterisks indicate CANVAS-affected patients, triangles show the position of the left border of assembled STRs, and circular markers show the expected length of STR alleles, as determined by clinical testing. (B) Scatterplot shows lengths of pentanucleotide STR alleles in RFC1 in consenting individuals (n = 5), as determined by ONT sequencing versus molecular testing. (C) For patient R210005, genome browser views show short-read NGS alignments (top) at the pathogenic STR site in RFC1. The presence of soft-clipped bases suggests that an STR expansion is present, but the size, sequence, and allelicity cannot be directly determined. Bottom panel shows phased ONT alignments from the same sample. Long reads directly measure the STR expansion size and reveal distinct motif conformations on the two RFC1 alleles.
Fig. 4.
Fig. 4.. Diversity of STR alleles across the study.
(A) Dot plot shows observed sizes of STR alleles for each gene (n = 37) in all individuals assessed during our study (n = 37). Gray boxes mark expected size ranges for normal, premutation, and pathogenic STR alleles for each gene, where known. Filled circles indicate pathogenic alleles confirmed by clinical molecular testing, and empty circles were confirmed as nonpathogenic or were not tested. Full results for each individual gene are provided in fig. S2. (B) Motif barcharts show observed sizes and motif conformations of STR alleles assembled for the RFC1 gene in each individual (n = 37). Red frame identifies CANVAS-affected patients, where large STR expansions in RFC1 were detected by clinical testing and ONT sequencing.
Fig. 5.
Fig. 5.. Targeted ONT sequencing of PGx genes.
(A) Genome browser view shows coverage distribution for uniquely aligned reads (MapQ ≥ 30) at the CYP2D6 gene and neighboring pseudogene CYP2D7. The top track shows data for short-read whole-genome sequencing (Illumina NovaSeq) of the human reference sample HG001/NA12878 (see table S3). The bottom track shows coverage and phased alignments for ONT ReadUntil targeted sequencing on the same sample. (B) Violin plots show coverage distribution across PGx gene targets (n = 37) with short-read NGS (left) and targeted ONT sequencing (right). For each technology, both raw alignment coverage and unique alignments (MapQ ≥ 30) are shown. (C) For the same datasets, stacked barcharts show the fraction of PGx target regions covered at different sequencing depths (red, 0 to 9×; yellow, 10 to 19×; pink, 20 to 29×; and purple, ≥30×). (D) Precision-recall curves show the accuracy of variant detection within PGx gene targets for SNVs (left; pink) and indels (right; orange) using ONT ReadUntil on reference sample HG002. Precision-recall curves were used to determine optimum Nanopolish parameter settings. (E) Summary table showing final variant detection statistics within PGx targets. While indel accuracy is poor, SNVs were detected with relatively high sensitivity and precision. (F) Genome browser view showing an example of a clinically actionable PGx allele (CYP2C19*2) detected using ONT ReadUntil in HG001.

Similar articles

Cited by

References

    1. Ellegren H., Microsatellites: Simple sequences with complex evolution. Nat. Rev. Genet. 5, 435–445 (2004). - PubMed
    1. Shortt J. A., Ruggiero R. P., Cox C., Wacholder A. C., Pollock D. D., Finding and extending ancient simple sequence repeat-derived regions in the human genome. Mob. DNA 11, 11 (2020). - PMC - PubMed
    1. Chintalaphani S. R., Pineda S. S., Deveson I. W., Kumar K. R., An update on the neurological short tandem repeat expansion disorders and the emergence of long-read sequencing diagnostics. Acta Neuropathol. Commun. 9, 98 (2021). - PMC - PubMed
    1. Depienne C., Mandel J.-L., 30 years of repeat expansion disorders: What have we learned and what are the remaining challenges? Am. J. Hum. Genet. 108, 764–785 (2021). - PMC - PubMed
    1. Hantash F. M., Goos D. M., Crossley B., Anderson B., Zhang K., Sun W., Strom C. M., FMR1 premutation carrier frequency in patients undergoing routine population-based carrier screening: Insights into the prevalence of fragile X syndrome, fragile X-associated tremor/ataxia syndrome, and fragile X-associated primary ovarian insufficiency in the United States. Genet. Med. 13, 39–45 (2011). - PubMed

Publication types