. 2022 Mar 4;8(9):eabm5559.
doi: 10.1126/sciadv.abm5559. Epub 2022 Mar 4.

Specific mesoderm subset derived from human pluripotent stem cells ameliorates microvascular pathology in type 2 diabetic mice

Affiliations

Specific mesoderm subset derived from human pluripotent stem cells ameliorates microvascular pathology in type 2 diabetic mice

Chang-Hyun Gil et al. Sci Adv. .

Abstract

Human induced pluripotent stem cells (hiPSCs) were differentiated into a specific mesoderm subset characterized by KDR+CD56+APLNR+ (KNA+) expression. KNA+ cells had high clonal proliferative potential and specification into endothelial colony-forming cell (ECFCs) phenotype. KNA+ cells differentiated into perfused blood vessels when implanted subcutaneously into the flank of nonobese diabetic/severe combined immunodeficient mice and when injected into the vitreous of type 2 diabetic mice (db/db mice). Transcriptomic analysis showed that differentiation of hiPSCs derived from diabetics into KNA+ cells was sufficient to change baseline differences in gene expression caused by the diabetic status and reprogram diabetic cells to a pattern similar to KNA+ cells derived from nondiabetic hiPSCs. Proteomic array studies performed on retinas of db/db mice injected with either control or diabetic donor-derived KNA+ cells showed correction of aberrant signaling in db/db retinas toward normal healthy retina. These data provide "proof of principle" that KNA+ cells restore perfusion and correct vascular dysfunction in db/db mice.


Figures
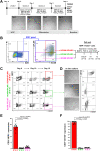
Fig. 1.
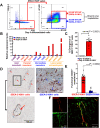
Fig. 1.. NCAM and APLNR coexpressing cells within D4 KDR+ mesoderm cells (KNA+ mesoderm) give rise to NRP-1+CD31+ ECs with ECFC competence.
(A) Schematic of simple one-step, two-dimensional, serum and feeder-free mesoderm lineage differentiation protocol. (B) Sorting strategy for day 4 (D4) differentiated hiPSCs. KDR+ cells were gated for NCAM and APLNR expression. KDR+NCAM+APLNR+ (K+N+A+), KDR+NCAM+APLNR (K+N+A), and KDR+NCAMAPLNR (K+NA) cells were sorted for further differentiation and examination for the emergence of NRP-1+CD31+ ECFCs. PI, propidium iodide. (C) Sorted K+N+A+, K+N+A, and K+NA mesoderm subsets were further differentiated into ECFC lineage for another 8 days (4 plus 8, total of 12 days) to examine for the emergence of NRP-1+CD31+ cells at various days of differentiation. (D) At day 12, K+N+A+ mesoderm fraction gave rise to NRP-1+CD31+ cells that formed a homogeneous cobblestone endothelial monolayer and displayed uniform coexpression for CD31 and CD144 endothelial markers. (E) Sorted K+N+A+, K+N+A, and K+NA mesoderm subsets were further differentiated into ECFC lineage for 4 + 8 days to examine for the emergence of CD31+NRP-1+ cells at various days of differentiation (n = 10). (F) K+N+A+ mesoderm fraction gave rise to CD31+NRP-1+ cells and displayed uniform coexpression for CD31 and CD144 endothelial markers (n = 10).
Fig. 2.
Fig. 2.. NRP-1+CD31+ ECs exhibit ECFC competence.
(A) K+N+A+ mesoderm–derived NRP-1+CD31+ cells exhibited high clonal proliferative potential with a hierarchy of colonies ranging from clusters of 2 to 50 cells up to colonies of >2001 cells similar to that of hiPSC-ECFCs. However, cells isolated from other two subsets failed to exhibit high clonal proliferative potential with marked reduction in colonies of >2001 cells. n = 10; means ± SD; t test: not significant (ns) and ****P < 0.0001. LPP, low proliferative potential. (B) At day 12, K+N+A+ mesoderm fraction completely lacked α-SMA expression (top), suggesting a stable ECFC-like phenotype. However, cells isolated from the other two subsets lacked adequate NRP-1 expression, formed heterogeneous cell monolayers, displayed expression for CD144 but lacked uniform coexpression for CD31 and CD144 endothelial markers, and exhibited expression for the nonendothelial marker α-SMA (middle and bottom), suggesting a complete lack of a stable ECFC phenotype (scale bar for the middle panel image). DAPI, 4′,6-diamidino-2-phenylindole. (C) K+N+A+ mesoderm–derived NRP-1+CD31+ cells produced robust in vivo human blood vessels, as confirmed by anti-human specific CD31 antibody reactivity, which are filled with host murine red blood cells (indicated by red arrows). K+N+A mesoderm–derived NRP-1+CD31+ cells produced modest in vivo human blood vessels, as confirmed by anti-human specific CD31 antibody reactivity, that are filled with host murine red blood cells (indicated by green arrows). K+NA mesoderm–derived NRP-1+CD31+ cells produced rare in vivo human blood vessels, as confirmed by anti-human specific CD31 antibody reactivity, that are filled with host murine red blood cells (indicated by pink arrows). (D) Quantification of functional hCD31+ blood vessels displaying equivalent formation of vessels between hiPSC-ECFCs and K+N+A+ ECFCs and significantly reduced in K+N+A ECs or K+NA ECs. n = 13 (K+N+A+ ECFCs), n = 11 (K+N+A ECs), and n = 5 (K+NA ECs); means ± SD; t test: ****P < 0.0001.
Fig. 3.
Fig. 3.. Cell sorting strategy for D4 SSEA-5–depleted KNA+ mesoderm cells and direct in vivo differentiation of SKNA+ mesoderm cells that formed robust human blood vessels without giving rise to teratomas.
(A) Cell sorting strategy for D4 differentiated hiPSCs–derived mesoderm cells. SSEA-5KDR+ cells were gated for NCAM and APLNR expression. SSEA-5KDR+NCAM+APLNR+ (SSEA-5KNA+) and SSEA-5KDR+NCAM+APLNR (SSEA-5KNA) cells were sorted for further analysis. SSEA-5KDR+ and SSEA-5+KDR cells were sorted for in vivo implantation to examine for teratoma formation and functional vessel formation in the same recipient animal (n = 10). (B) D4 SSEA-5–depleted KNA+ mesoderm cells display transcripts typically enriched in lateral plate/extraembryonic mesoderm but lacking expression of axial, paraxial, and intermediate mesoderm markers in SSEA-5KNA+ cells (n = 3). (C) Sorted SSEA-5KNA+ cells were further differentiated into ECFC lineage for another 8 days (4 plus 8, total of 12 days). At day 12, SSEA-5KNA+ cells produced ≥3-fold more NRP-1+CD31+ cells compared to NRP-1+CD31+ cells produced after continuous 12 days of differentiation of day 0 hiPSCs (without isolating mesoderm subset at D4 of differentiation) into ECFC lineage. n = 15; means ± SD; t test: ****P < 0.0001. (D) D4 SSEA-5KNA+ mesoderm–derived ECFC vessels remain stable in vivo with completely inosculating with the host vasculature to become part of the host circulation and do not regress to form teratoma after long-term in vivo implantation (≥8 months after implantation). While SSEA-5KNA+ cells formed robust functional in vivo vessels (red arrows, left), SSEA-5KNA cells failed to form robust in vivo vessels (blue arrows, right). (E) Quantification of functional hCD31+ blood vessels (n = 26, SSEA-5KNA+ and n = 9, SSEA-5KNA; means ± SD; t test: ***P = 0.0002. (F) Direct in vivo differentiation of SSEA-5KNA+ cells formed CD31+NRP-1+ blood vessels as early as 8 days after implantation (red, hCD31; green, NRP-1).
Fig. 4.
Fig. 4.. In vitro tube formation and quantification of endothelial surface marker from ECFC.
(A) Representative images of the characteristic capillary networks generated by KNA+ cells on Matrigel. (B and C) Quantification of tube formation assay with bar diagram of total vessel length (B) and branch points (C). (D) Expression pattern of different endothelial markers in KNA+ cells derived from ECFCs of either nondiabetic (N-ECFC) or diabetic (D-ECFC) origin. N-ECFC and D-ECFC cells were stained with antibodies for CD31, CD144, NRP-1, CD146, and KDR. After flow cytometry analysis, the percentage of cells expressing each cell surface marker is presented in the bar graph. (E) Analysis of the tube formation assay using N-ECFCs and D-ECFCs. Representative images of characteristic capillary networks on Matrigel. (F and G) Bar graph of total length (F) and branching point analysis are presented (G).
Fig. 5.
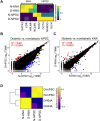
Fig. 5.. Transcriptomic analysis demonstrates that KNA cells from nondiabetic and diabetic donors are highly similar.
(A) Expression of KNA and hiPSC marker genes. (B and C) Bulk RNA-seq comparison of diabetic-derived hiPSCs (D-hiPSC) versus nondiabetic-derived hiPSCs (N-hiPSC) (B) and diabetic-derived KNA cells (D-KNA) versus nondiabetic-derived KNA cells (N-KNA) (C). Red dots were significantly up-regulated genes and blue dots were significantly down-regulated genes in diabetic-derived cells. TMM, trimmed mean of M values. (D) Spearman correlation of all four samples using three principal components.
Fig. 6.
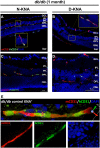
Fig. 6.. KNA+ cells from nondiabetic and diabetic donors integrate into retinal blood vessels of db/db mice 1 month after injection.
(A to E) Representative immunofluorescence images of retinal frozen sections stained with anti–human CD31 (hCD31) (green) and anti–mouse CD31 (mCD31) (red) antibodies. Viable human nondiabetic (N-KNA+) (A, C, and E) and diabetic (D-KNA+) (B and D) cells were detected in the db/db mouse retinas and incorporated into the small vessels of the vascular plexus. Nuclei were stained with DAPI (blue). Insets in (A) and (B) show cell incorporation at higher magnification. IPL, inner plexiform layer; GCL, ganglion cell layer; INL, inner nuclear layer; OPL, outer plexiform layer; ONL, outer nuclear layer.
Fig. 7.
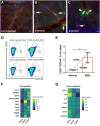
Fig. 7.. Retinal flow cytometry confirms revascularization following injection of either nondiabetic or diabetic KNA cells in db/db mice and flat-mount macaque retinas triple-stained with Collagen IV (Col IV) (red), GFP (green), and DAPI (blue).
(A) Images from noninjected retinas. (B and C) Images from retinas 2 weeks after intravitreous injection of GFP+ nondiabetic KNA+ cells. Arrows in (B) and (C) point to GFP+/KNA+ cells. Arrowheads in (C) indicate GFP+/KNA+ cells becoming part of blood vessels. Scale bars, 20 μm (A to C). (D) Whole retina flow cytometry of paired contralateral db/db eyes injected with vehicle and either nondiabetic (N-KNA) or diabetic (D-KNA) KNA cells. (E) Quantification of CD31+CD144+ (VE-cadherin) ECs from whole retina flow cytometry. Student’s t test; *P < 0.05. (F and G) Heatmap of differentially expressed proteins between all treatment groups. KNA+ cell administration reestablishes physiologic levels of these factors, potentially promoting retinal neural protection, improving retinal metabolism, decreased inflammation, and reduced angiogenic activity. Proteomic analysis indicating either up-regulation or down-regulation, relative to saline, of retinal proteins from db/db mice injected with either nondiabetic (N-KNA+) or diabetic (D-KNA+) KNA cells. IL-6, interleukin-6.
Fig. 8.
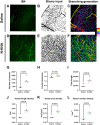
Fig. 8.. Vascular density assessment in retinas of db/db mice injected with either saline or N-KNA cells.
(A and D) Saline (A) and N-KNA cells (D). Retinal flat mount from db/db cohorts stained with Griffonia Simplicifolia Lectin I IB4 (green), revealing a significant improved perfusion in treated eye. (B and E) Binary input image of saline- and N-KNA–treated perfused retinal flat mounts. (C and F) Branching generation detected by VESGEN software identifies each generation (1 to 9) with a specific color code from largest to smallest branches. (G to L) Graphs show VESGEN quantification data. Changes in the number of vessels (G), fractal dimension (characterizes the structural changes from large vessels to small vessels across the retina) (H), total length (the summation of the length of all vessels in the ROI) (I), vessel length density (total length/ROI) (J), vessel area density (vessel area/ROI) (K), and vessel number density (vessel number/ROI) (L). All parameters indicate a restoration of retinal vascularity with N-KNA cell treatment compared to saline control injection.

References

    1. Carcamo-Orive I., Hoffman G. E., Cundiff P., Beckmann N. D., D’Souza S. L., Knowles J. W., Patel A., Papatsenko D., Abbasi F., Reaven G. M., Whalen S., Lee P., Shahbazi M., Henrion M. Y. R., Zhu K., Wang S., Roussos P., Schadt E. E., Pandey G., Chang R., Quertermous T., Lemischka I., Analysis of transcriptional variability in a large human iPSC library reveals genetic and non-genetic determinants of heterogeneity. Cell Stem Cell 20, 518–532.e9 (2017). - PMC - PubMed
    1. Park T. S., Zimmerlin L., Evans-Moses R., Thomas J., Huo J. S., Kanherkar R., He A., Ruzgar N., Grebe R., Bhutto I., Barbato M., Koldobskiy M. A., Lutty G., Zambidis E. T., Vascular progenitors generated from tankyrase inhibitor-regulated naïve diabetic human iPSC potentiate efficient revascularization of ischemic retina. Nat. Commun. 11, 1195 (2020). - PMC - PubMed
    1. Williams I. M., Wu J. C., Generation of endothelial cells from human pluripotent stem cells. Arterioscler. Thromb. Vasc. Biol. 39, 1317–1329 (2019). - PMC - PubMed
    1. Stepniewski J., Kachamakova-Trojanowska N., Ogrocki D., Szopa M., Matlok M., Beilharz M., Dyduch G., Malecki M. T., Jozkowicz A., Dulak J., Induced pluripotent stem cells as a model for diabetes investigation. Sci. Rep. 5, 8597 (2015). - PMC - PubMed
    1. Murry C. E., Keller G., Differentiation of embryonic stem cells to clinically relevant populations: Lessons from embryonic development. Cell 132, 661–680 (2008). - PubMed