. 2022 Mar 4;8(9):eabj4641.
doi: 10.1126/sciadv.abj4641. Epub 2022 Mar 4.

Transitional premonocytes emerge in the periphery for host defense against bacterial infections

Affiliations

Transitional premonocytes emerge in the periphery for host defense against bacterial infections

Ye Chean Teh et al. Sci Adv. .

Abstract

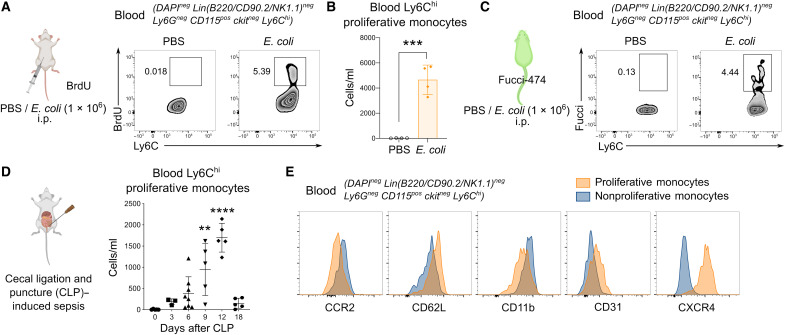
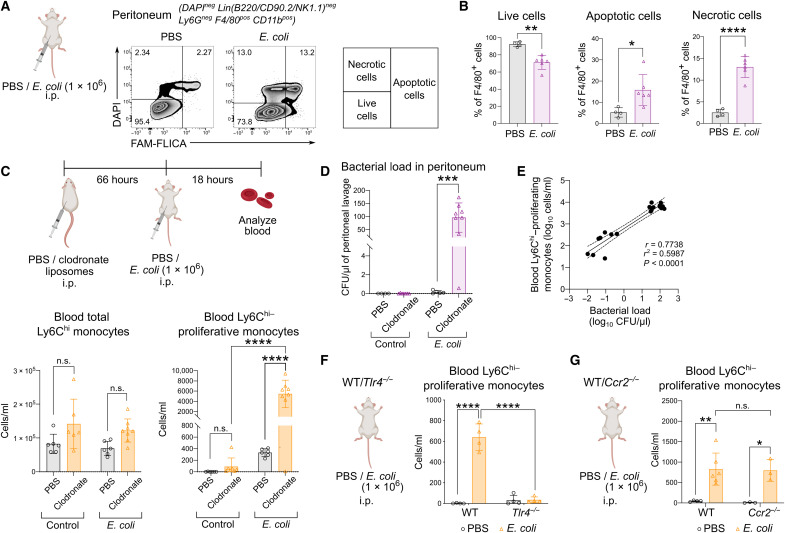
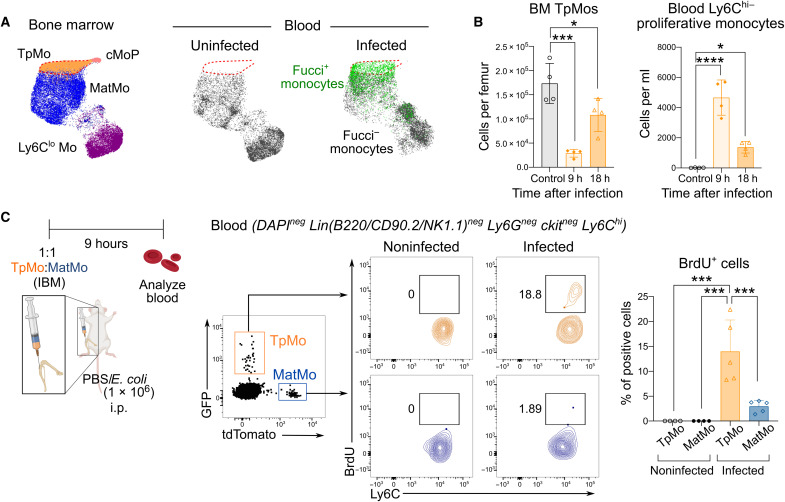
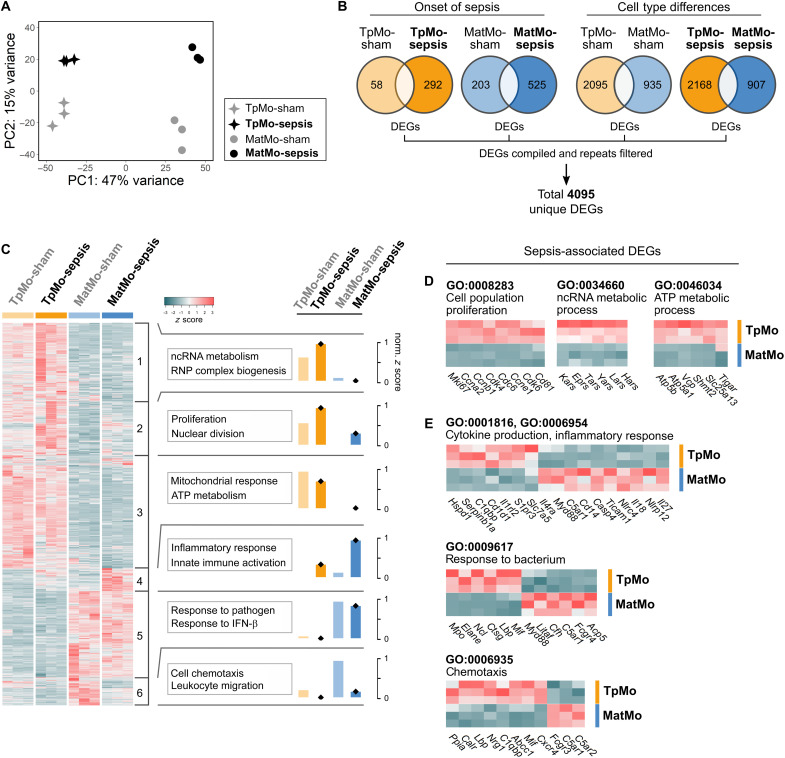
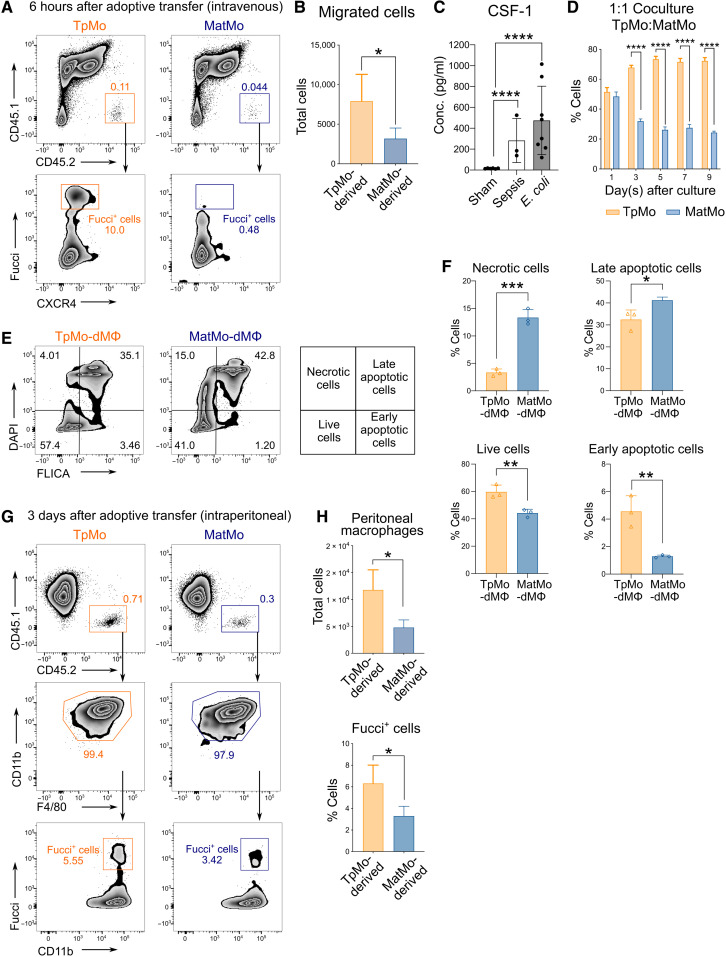
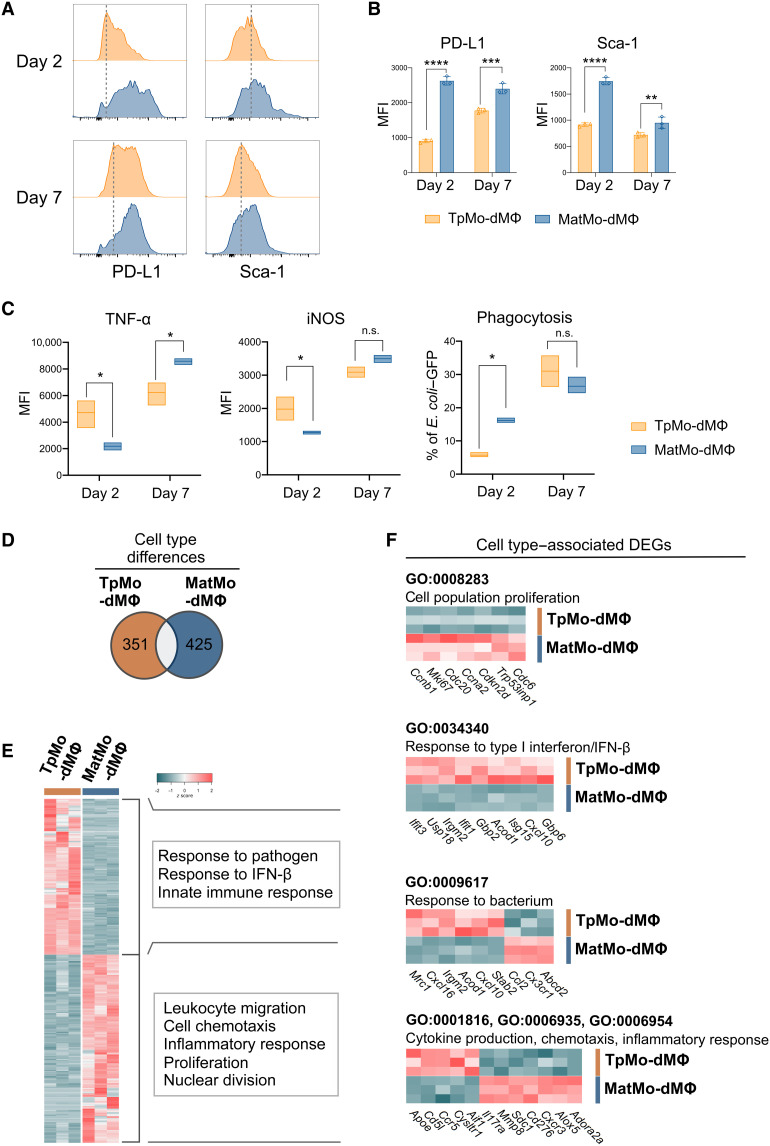
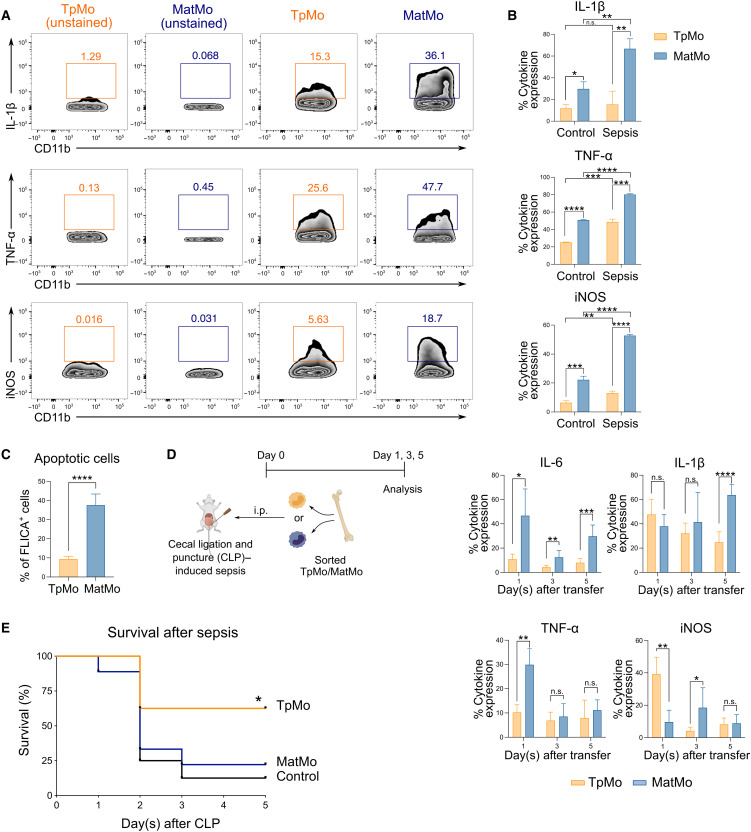
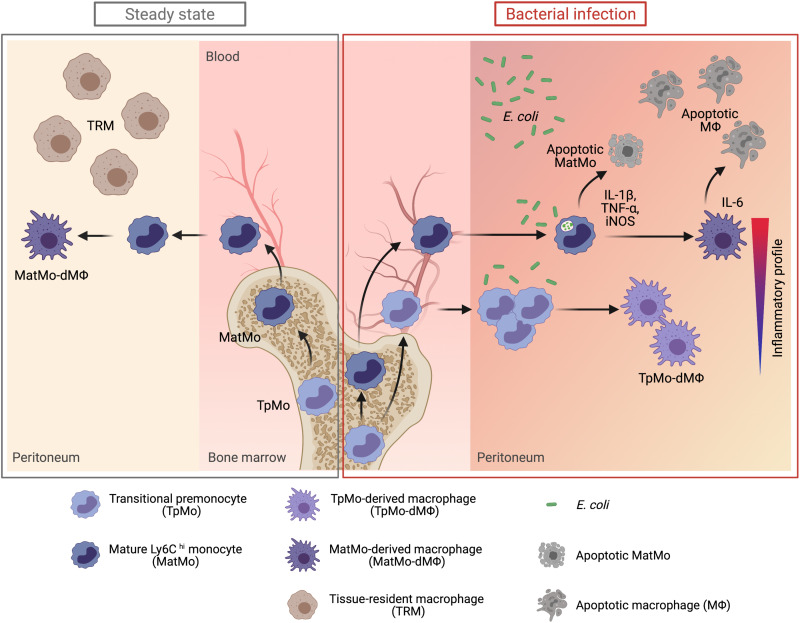
Circulating Ly6Chi monocytes often undergo cellular death upon exhaustion of their antibacterial effector functions, which limits their capacity for subsequent macrophage differentiation. This shrouds the understanding on how the host replaces the tissue-resident macrophage niche effectively during bacterial invasion to avert infection morbidity. Here, we show that proliferating transitional premonocytes (TpMos), an immediate precursor of mature Ly6Chi monocytes (MatMos), were mobilized into the periphery in response to acute bacterial infection and sepsis. TpMos were less susceptible to apoptosis and served as the main source of macrophage replenishment when MatMos were vulnerable toward bacteria-induced cellular death. Furthermore, TpMo and its derived macrophages contributed to host defense by balancing the proinflammatory cytokine response of MatMos. Consequently, adoptive transfer of TpMos improved the survival outcome of lethal sepsis. Our findings hence highlight a protective role for TpMos during bacterial infections and their contribution toward monocyte-derived macrophage heterogeneity in distinct disease outcomes.


Figures

Fig. 1.
Fig. 1.. A distinct proliferative subset of Ly6Chi monocytes emerges in the peripheral blood during bacterial infection and sepsis.
(A to C) Proliferative Ly6Chi monocytes in the blood assessed by BrdU incorporation in vivo (A) and numbers quantified (B) or Fucci-474 mice (C) were administered E. coli or phosphate-buffered saline (PBS) intraperitoneally (i.p.) for 9 hours. Numbers in fluorescence-activated cell sorting (FACS) plots represent the percentage of positive cells. Results are expressed as means ± SD (n = 4) and representative of one of three experiments. ***P < 0.001 (Student’s t test). (D and E) Mice were subjected to CLP-induced sepsis, and proliferative Ly6Chi monocytes in the blood were quantified on the basis of BrdU incorporation at indicated time points (D). Results are expressed as means ± SD (n = 5 per group) and representative of one of three experiments. **P < 0.01, and ****P < 0.0001 [one-way analysis of variance (ANOVA)] compared to day 0. (E) Overlay of surface markers of blood proliferative versus nonproliferative Ly6Chi monocytes on day 12 of CLP-induced sepsis.
Fig. 2.
Fig. 2.. Emergence of Ly6Chi-proliferative monocytes was CCR2 independent and occurred after bacteria-induced TRM loss.
(A and B) Peritoneal macrophages of mice infected with E. coli or PBS were analyzed for live, apoptotic, and necrotic cells using FAM-FLICA and 4′,6-diamidino-2-phenylindole (DAPI) (A) and their percentage quantified (B) after 18 hours of infection. Numbers in FACS plots represent the percentage of positive cells. Results are expressed as means ± SD (n = 5) and representative of one of two experiments. *P < 0.05, **P < 0.01, and ****P < 0.0001 (Student’s t test). (C to E) Mice were administered clodronate or PBS liposomes intraperitoneally before infection with or without E. coli as indicated. (C) Total Ly6Chi monocytes (bottom left) and proliferative Ly6Chi monocytes (bottom right) in the blood were quantified. Results are expressed as means ± SD (n = 6) and representative of one of three experiments. n.s., not significant; ****P < 0.0001 (one-way ANOVA). (D) Quantification of the peritoneal bacterial load was quantified. Results are expressed as means ± SD (n = 6) and representative of one of three experiments. ***P < 0.001 (Student’s t test). (E) Correlation graph of blood proliferative Ly6Chi monocytes versus bacterial load. (F and G) WT and Tlr4−/− (F) or WT and Ccr2−/− mice (G) were administered E. coli or PBS intraperitoneally, and the blood was analyzed for proliferative Ly6Chi monocytes using BrdU incorporation in vivo after 18 hours. Results are expressed as means ± SD (n = 3 to 6) and representative of one of three experiments. *P < 0.05, **P < 0.01, and ****P < 0.0001 (one-way ANOVA).
Fig. 3.
Fig. 3.. Blood Ly6Chi–proliferating monocytes are TpMos that have been mobilized from the BM.
(A) Uniform Manifold Approximation and Projection (UMAP) analysis was performed on total monocytes from uninfected BM cells (left) total uninfected blood cells (middle), and infected blood cells (right). Parameters used for UMAP projection include Ly6C, CXCR4, CD49f, CD115, cKit, CD43, CX3CR1, and CD48. Monocyte subsets, including proliferative (Fucci+) Ly6Chi monocytes, were then manually gated and overlaid onto the UMAP space. (B) BM TpMos (left) and blood Ly6Chi–proliferative monocytes (right) were quantified after E. coli infection at indicated time points. Results are expressed as means ± SD (n = 5) and representative of one of two experiments. *P < 0.05, ***P < 0.001, and ****P < 0.0001 (one-way ANOVA). (C) GFP-tagged TpMos and tdTomato-tagged MatMos were resuspended in a 1:1 ratio and adoptively transferred as a single injection via the intrafemoral route [intra-BM (IBM)] into the femurs of donor mice. Donor mice were subsequently infected with or without E. coli and analyzed for GFP-tagged TpMos and tdTomato-tagged MatMos in the blood after 9 hours (left). These cells were subsequently gated and examined for BrdU incorporation in vivo (middle). Results (right) are expressed as means ± SD (n = 4 to 8 per group) and representative of one of three experiments. ***P < 0.001 (one-way ANOVA).
Fig. 4.
Fig. 4.. TpMos express distinct effector genes from MatMos in response to sepsis.
(A to E) TpMos and MatMos from sham and CLP-induced sepsis conditions on day 6 were sorted from the BM. (A) PCA of bulk RNA-seq data for BM TpMo and MatMo subsets across sham and sepsis conditions; TpMo-sepsis (black star, top left), MatMo-sepsis (black circle, top right), TpMo-sham (gray star, bottom left), and MatMo-sham (gray circle, bottom right). (B) Venn diagrams representing DEGs (up/down) between BM TpMo and MatMo subsets across sham and sepsis conditions; TpMo-sham (pale orange), TpMo-sepsis (orange), MatMo-sham (pale blue), and MatMo-sepsis (blue). All DEGs identified across four conditions were merged, and repetitive genes were excluded to obtain 4095 unique DEGs for gene expression analysis. (C) Heatmap of unique DEGs expression across subsets represented as z score. Gene clusters (1 to 6) were obtained by unsupervised k-means clustering and subjected to GO biological process enrichment analysis. Functional characterization of gene clusters was based on the top five GO terms obtained from analysis. Functional scores for each gene cluster across conditions were represented as normalized z score. RNP, ribonucleoprotein. (D) Cell population proliferation, ncRNA metabolic process, and ATP metabolic process (left to right) related gene expression between BM TpMo and MatMo subsets during sepsis. (E) Cytokine production/inflammatory response, response to bacterium, and chemotaxis (top to bottom) related gene expression between BM TpMo and MatMo subsets during sepsis.
Fig. 5.
Fig. 5.. TpMos are more competent than MatMos in replenishing the macrophage niche.
(A and B) TpMos and MatMos from Fucci-474 CD45.2 mice were sorted and adoptively transferred intravenously into CLP-induced CD45.1 recipient mice. Analysis of peritoneal lavage (PL) of recipient mice for transferred cells was performed 6 hours later (A), and total migrated cells into peritoneum was quantified (B). Results are expressed as means ± SD (n = 4 to 6) and representative of one of three experiments. *P < 0.05 (Student’s t test). (C) Concentration of CSF-1 in the PL of mice that have undergone sham surgery versus CLP-induced sepsis and infection with E. coli. Results are expressed as means ± SD (n = 3 to 8) and representative of one of three experiments. ****P < 0.0001 (one-way ANOVA). (D) CD45.1 TpMos and CD45.2 MatMos were cocultured in 1:1 ratio in vitro with CSF-1 (20 ng/ml), and percentage of CD11b+ F4/80+ macrophages derived from each cell type were analyzed at indicated time points. Results are expressed as means ± SD and representative of one of three experiments. ****P < 0.0001 (Student’s t test). (E and F) TpMos and MatMos were cultured with CSF-1 (20 ng/ml) for 2 days, and percentage of live, early and late apoptotic and necrotic cells was quantified using FLICA Poly Caspase and DAPI via flow cytometry. Results are expressed as means ± SD (n = 3) and representative of one of three experiments. *P < 0.05, **P < 0.01, and ***P < 0.001 (Student’s t test). (G and H) TpMos and MatMos from Fucci-474 CD45.2 mice were sorted and adoptively transferred intraperitoneally into CD45.1 recipient mice. Analysis of adoptive transferred cells in the PL of recipient mice was performed 3 days later (G), and total number of CD11b+ F4/80+ macrophages (top) and percentage of Fucci signal in these transferred TpMo- or MatMo-dMΦs (bottom) were quantified (H). Results are expressed as means ± SD (n = 4 to 6) and representative of one of three experiments. *P < 0.05 (Student’s t test).
Fig. 6.
Fig. 6.. TpMo-dMΦs are distinct from MatMo-dMΦs.
(A to C) TpMos and MatMos were cultured with CSF-1 (20 ng/ml) and analyzed at 2 or 7 days after culture for surface markers (A) with median fluorescence intensity (MFI) quantified (B) or incubated with E. coli–GFP for 3 hours before TNF-α and iNOS expression, as well as phagocytosis of E. coli–GFP, was quantified (C). Results are expressed as means ± SD and representative of one of three experiments. *P < 0.05, **P < 0.01, ***P < 0.001, and ****P < 0.0001 (Student’s t test). (D to F) TpMo-dMΦs and MatMo-dMΦs 7 days after culture were analyzed by RNA-seq. (D) Venn diagram representing 776 DEGs between TpMo-dMΦ and MatMo-dMΦ subsets. (E) Heatmap of unique DEGs expression across subsets represented as z score. DEGs were subjected to GO biological process enrichment analysis. Functional characterization of DEGs was based on the top five GO terms obtained from analysis. (F) Cell population proliferation, response to type I interferon/IFN-β, response to bacterium, and cytokine production/chemotaxis/inflammatory response (top to bottom) related gene expression between TpMo-dMΦ and MatMo-dMΦ subsets.
Fig. 7.
Fig. 7.. TpMos display protective functions during sepsis by balancing the proinflammatory functions of MatMos.
(A) TpMos and MatMos were sorted and analyzed for the expression of IL-1β, TNF-α, and iNOS after stimulation with LPS. (B) Control and CLP-induced septic BM TpMos and MatMos were stimulated with LPS and analyzed for the expression of IL-1β, TNF-α, and iNOS. (C) LPS-stimulated control BM TpMos and MatMos were analyzed for apoptotic cells using FLICA Poly Caspase. (D) TpMos and MatMos were sorted from CD45.1 mice and adoptively transferred into CLP-induced CD45.2 recipient mice via the intraperitoneal route. Analysis of PL of recipient mice for transferred cells was performed on days 1, 3, and 5 after adoptive transfer for the expression of IL-6, IL-1β, TNF-α, and iNOS. Results are expressed as means ± SD (n = 4 to 6) and representative of one of three experiments. *P < 0.05, **P < 0.01, ***P < 0.001, and ****P < 0.0001 (Student’s t test). (E) TpMos or MatMos were sorted and adoptively transferred into recipient mice shortly after they were subjected to CLP. The mortality of these recipient mice was assessed using the Kaplan-Meier survival curve. Results are representative of one of three independent experiments (n = 10). *P < 0.05 (Mantel-Cox).
Fig. 8.
Fig. 8.. The mobilization of TpMos into the periphery allows a diversification of monocytic roles to protect the host against bacterial infections.
During steady state, TpMos are immobilized in the BM where they serve as a reservoir of precursor cells to replenish the pool of MatMos in the circulation. Consequently, the replenishment of TRMs in the periphery are carried out solely by MatMos, giving rise to MatMo-dMΦs. However, upon bacterial infection, TRMs undergo rapid cellular death, which predisposes the host toward morbidity from an empty macrophage niche and the ensuing bacterial burden. This scenario results in competing demands placed on MatMos, which must now fulfil both antibacterial effector functions and macrophage replenishment roles simultaneously. To circumvent this challenge, TpMos are mobilized from the BM into the circulation to serve as the main source of macrophage replenishment when MatMos are vulnerable toward bacteria-induced cell death after the exhaustion of their effector functions. Furthermore, TpMos and their derived macrophages provided protection against sepsis by balancing the highly proinflammatory cytokine response of MatMos that contribute toward the cytokine storm in sepsis. Together, our findings highlight a specialization of monocytic roles against bacteria invasion through the mobilization of a monocyte precursor, which may be an evolutionary designed mechanism to balance the competing demands placed on the immune system in their arms race against pathogens. (Figure created with BioRender.com.)

References

    1. Hashimoto D., Chow A., Noizat C., Teo P., Beasley M. B., Leboeuf M., Becker C. D., See P., Price J., Lucas D., Greter M., Mortha A., Boyer S. W., Forsberg E. C., Tanaka M., van Rooijen N., García-Sastre A., Stanley E. R., Ginhoux F., Frenette P. S., Merad M., Tissue-resident macrophages self-maintain locally throughout adult life with minimal contribution from circulating monocytes. Immunity 38, 792–804 (2013). - PMC - PubMed
    1. Perdiguero E. G., Geissmann F., The development and maintenance of resident macrophages. Nat. Immunol. 17, 2–8 (2016). - PMC - PubMed
    1. Ginhoux F., Guilliams M., Tissue-resident macrophage ontogeny and homeostasis. Immunity. 44, 439–449 (2016). - PubMed
    1. Epelman S., Lavine K. J., Randolph G. J., Origin and functions of tissue macrophages. Immunity 41, 21–35 (2014). - PMC - PubMed
    1. Zhang N., Czepielewski R. S., Jarjour N. N., Erlich E. C., Esaulova E., Saunders B. T., Grover S. P., Cleuren A. C., Broze G. J., Edelson B. T., Mackman N., Zinselmeyer B. H., Randolph G. J., Expression of factor V by resident macrophages boosts host defense in the peritoneal cavity. J. Exp. Med. 216, 1291–1300 (2019). - PMC - PubMed

Publication types