. 2022 Mar 4;16(3):e0010244.
doi: 10.1371/journal.pntd.0010244. eCollection 2022 Mar.

Estimating chikungunya virus transmission parameters and vector control effectiveness highlights key factors to mitigate arboviral disease outbreaks

Affiliations

Estimating chikungunya virus transmission parameters and vector control effectiveness highlights key factors to mitigate arboviral disease outbreaks

Frédéric Jourdain et al. PLoS Negl Trop Dis. .

Abstract

Background: Viruses transmitted by Aedes mosquitoes have greatly expanded their geographic range in recent decades. They are considered emerging public health threats throughout the world, including Europe. Therefore, public health authorities must be prepared by quantifying the potential magnitude of virus transmission and the effectiveness of interventions.

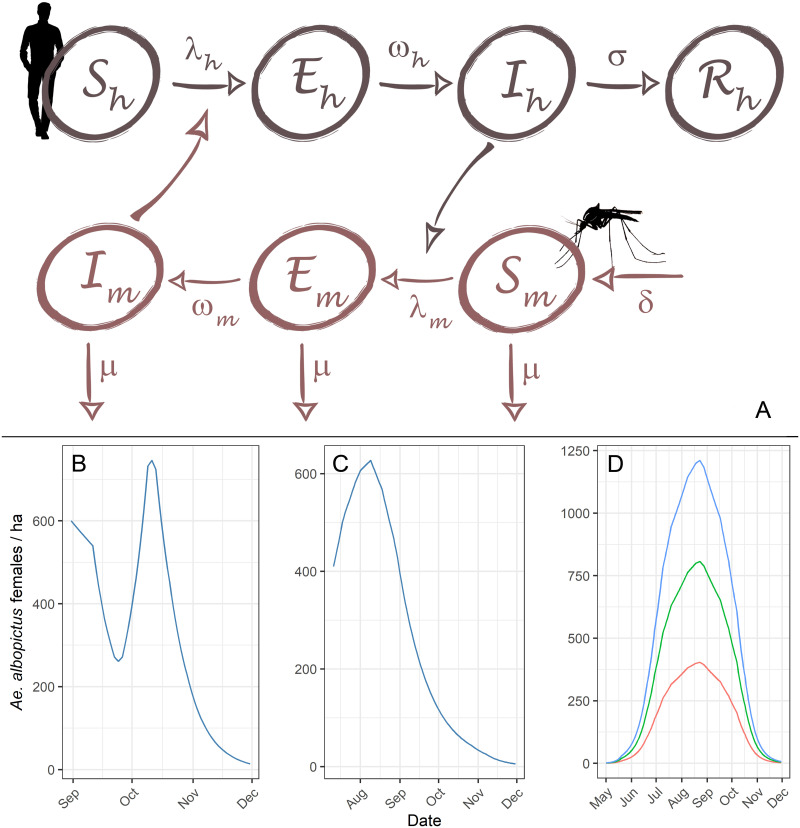
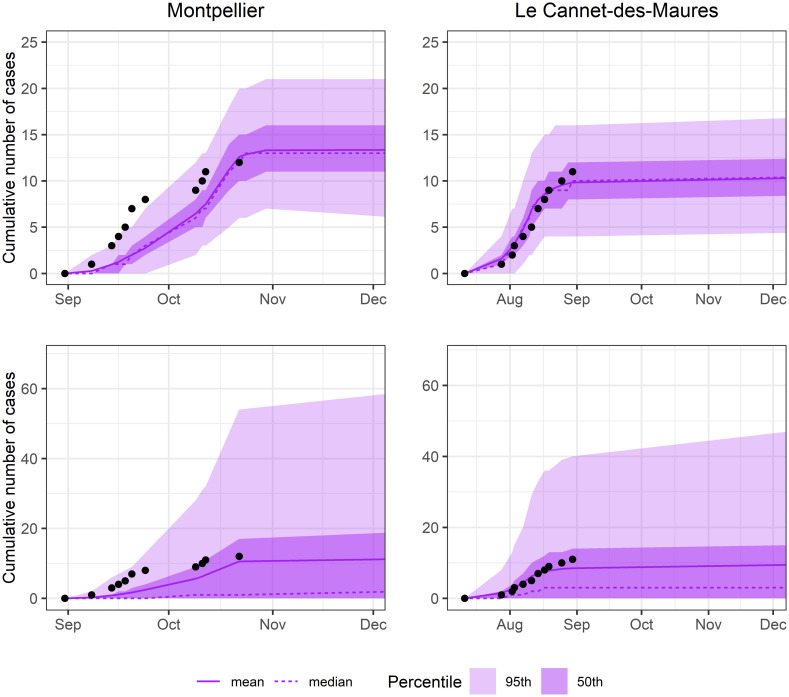
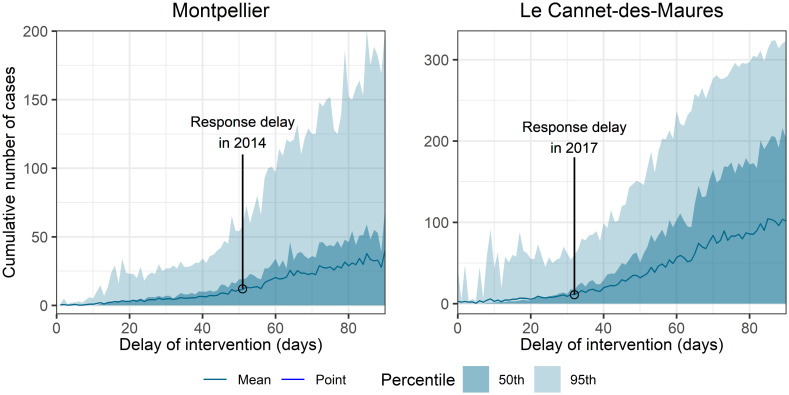
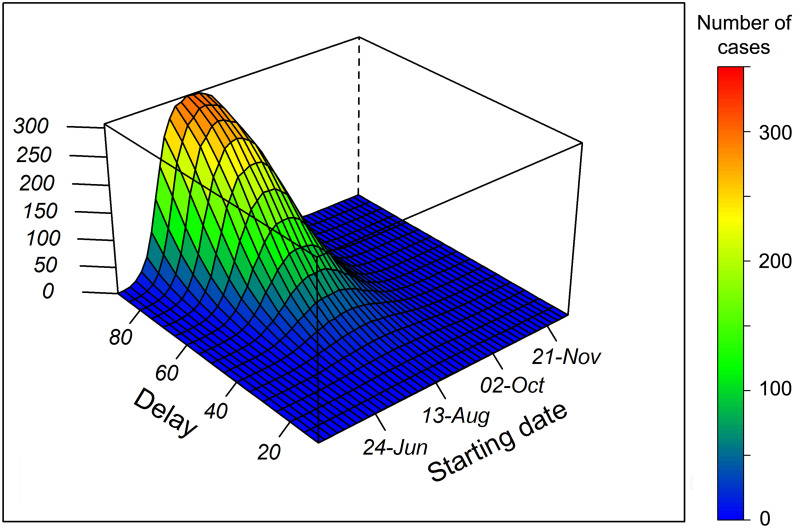
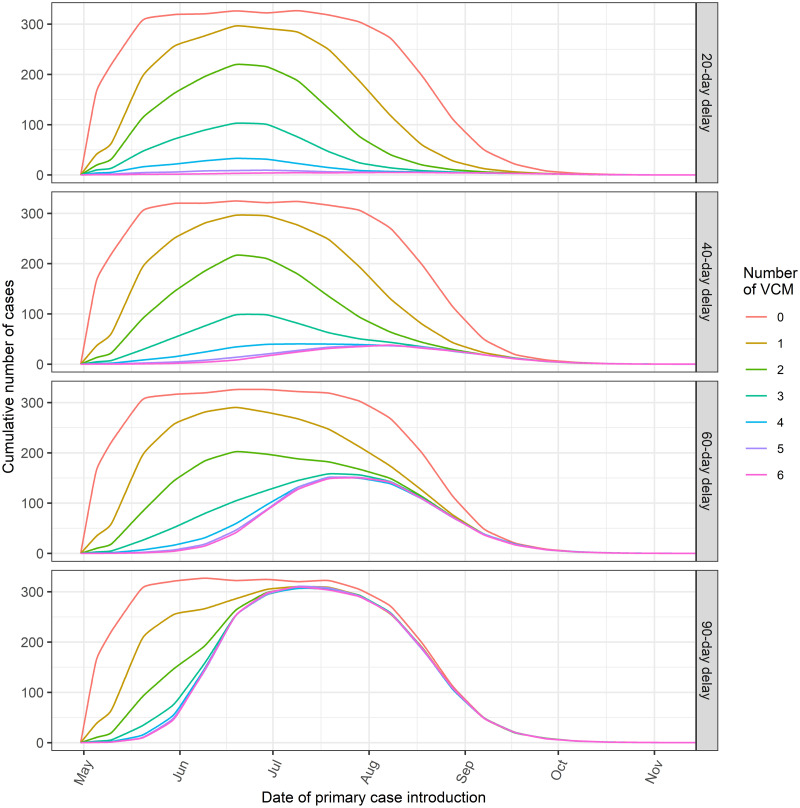
Methodology: We developed a mathematical model with a vector-host structure for chikungunya virus transmission and estimated model parameters from epidemiological data of the two main autochthonous chikungunya virus transmission events that occurred in Southern France, in Montpellier (2014) and in Le Cannet-des-Maures (2017). We then performed simulations of the model using these estimates to forecast the magnitude of the foci of transmission as a function of the response delay and the moment of virus introduction.

Conclusions: The results of the different simulations underline the relative importance of each variable and can be useful to stakeholders when designing context-based intervention strategies. The findings emphasize the importance of, and advocate for early detection of imported cases and timely biological confirmation of autochthonous cases to ensure timely vector control measures, supporting the implementation and the maintenance of sustainable surveillance systems.


Conflict of interest statement

The authors have declared that no competing interests exist.

Figures

Fig 1
Fig 1. Structure of the model and vector population dynamics.
(A) Structure of the SEI-SEIR vector-host model. The infection force of the hosts (λh) and the infection force of the vector population (λm) are respectively defined by the expressions abImNh and acIhNh. Lower panel: (B) vector population dynamics based on data from Montpellier (C) and from Le Cannet-des-Maures, and (D) standard vector population dynamics modelled throughout the whole period of vector activity for three different mosquito population densities.
Fig 2
Fig 2. Simulation of the outbreak in Montpellier and Le Cannet-des-Maures using the parameter model estimates.
The upper row shows the fit of the deterministic models while lower row shows the fit of the stochastic models.
Fig 3
Fig 3. Stochastic simulations of the cumulative number of autochthonous cases according to the delay between the introduction of the primary case and control measure intervention.
In Montpellier (left-hand column), vector control was first implemented 51 days after primary case introduction and 12 outbreak cases were reported, as marked by the circle in the figure. In Le Cannet-des-Maures (right-hand column), vector control was first implemented 32 days after primary case introduction and 11 outbreak cases were reported, as marked by the circle in the figure.
Fig 4
Fig 4. Number of autochthonous cases as a function of the date of primary case introduction and delay of intervention.
Simulations are derived for a medium (800 females/ha) vector density of a standard mosquito population dynamic. For each setting, a sequence of 10 vector control treatments spaced 7 days apart is implemented.
Fig 5
Fig 5. Number of autochthonous cases as a function of the date of virus introduction and different number of vector control measures.
Simulations are performed for a standard mosquito population dynamic for four different delays in vector control implementation. VCM: vector control measure(s). The values on the y-axis correspond to the average number of cumulative cases expected during an entire event of transmission (until the end of the vector activity season), according to the date of introduction of the virus (x-axis).

Similar articles

Cited by

References

    1. Gould E, Pettersson J, Higgs S, Charrel R, de Lamballerie X. Emerging arboviruses: Why today? One Health. 2017;4: 1–13. doi: 10.1016/j.onehlt.2017.06.001 - DOI - PMC - PubMed
    1. Jourdain F, Roiz D, de Valk H, Noël H, L’ambert G, Franke F, et al.. From importation to autochthonous transmission: Drivers of chikungunya and dengue emergence in a temperate area. PLoS Negl Trop Dis. 2020;14: 1–19. doi: 10.1371/journal.pntd.0008320 - DOI - PMC - PubMed
    1. Franke F, Giron S, Cochet A, Jeannin C, Leparc-Goffart I, de Valk H, et al.. [Autochthonous chikungunya and dengue fever outbreak in Mainland France, 2010–2018]. Bull Epidémiol Hebd. 2019; 374–82.
    1. Bhatt S, Gething PW, Brady OJ, Messina JP, Farlow AW, Moyes CL, et al.. The global distribution and burden of dengue. NATURE. 2013;496: 504–507. doi: 10.1038/nature12060 - DOI - PMC - PubMed
    1. Amraoui F, Failloux AB. Chikungunya: an unexpected emergence in Europe. Curr Opin Virol. 2016;21: 146–150. doi: 10.1016/j.coviro.2016.09.014 - DOI - PubMed

Publication types