. 2022 Mar 4;17(3):e0264418.
doi: 10.1371/journal.pone.0264418. eCollection 2022.

A theoretical analysis of complex armed conflicts

Affiliations

A theoretical analysis of complex armed conflicts

Sergio Rinaldi et al. PLoS One. .

Abstract

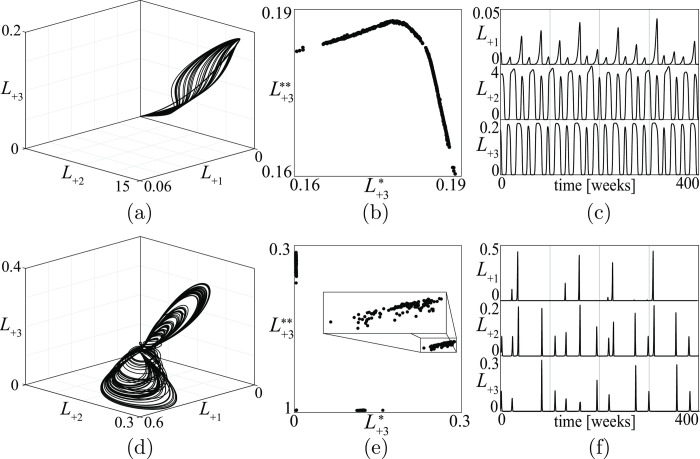
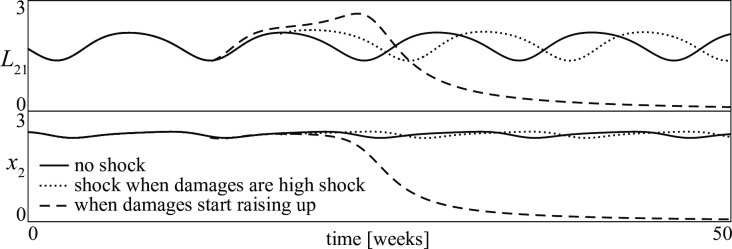
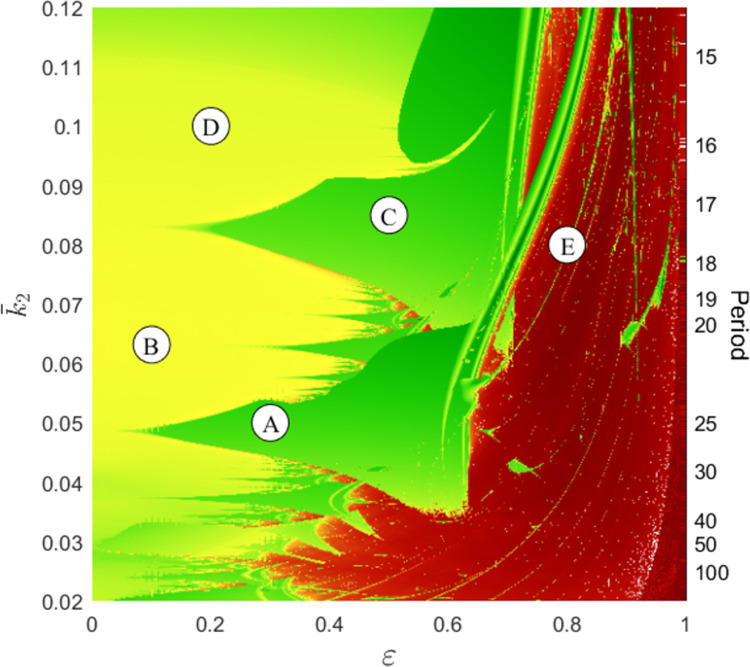
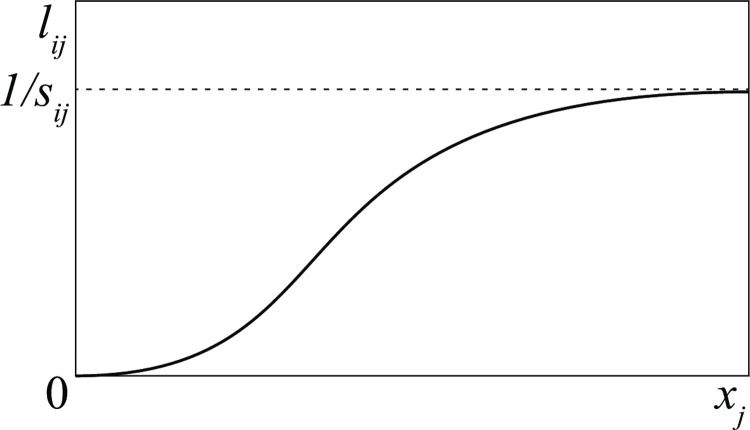
The introduction and analysis of a simple idealized model enables basic insights into how military characteristics and recruitment strategies affect the dynamics of armed conflicts, even in the complex case of three or more fighting groups. In particular, the model shows when never ending wars (stalemates) are possible and how initial conditions and interventions influence a conflict's fate. The analysis points out that defensive recruitment policies aimed at compensating for suffered losses lead to conflicts with simple dynamics, while attack groups sensitive to the damages they inflict onto their enemies can give rise to conflicts with turbulent behaviours. Since non-governmental groups often follow attack strategies, the conclusion is that the evolution of conflicts involving groups of that kind can be expected to be difficult to forecast.


Conflict of interest statement

The authors have declared that no competing interests exist.

Figures

Fig 1
Fig 1. The two functions involved in the model.
(a) recruitment policy (see Eq (2)); (b) military characteristic (see Eq (3)).
Fig 2
Fig 2. The structure of the three possible conflicts between two groups (D and A are defense and attack groups, respectively).
Fig 3
Fig 3. Example of a bifurcation diagram of a D—D conflict.
Fig 4
Fig 4. Four different sets of D—D conflicts (see text for their meanings).
Fig 5
Fig 5. Sets of D—D conflicts (shaded regions) where the victory of the first group is guaranteed.
(a) the brute force principle holds; (b) the brute force principle holds only if the second group has a heavy bureaucratic burden s21.
Fig 6
Fig 6. An example of periodic stalemate in a D—A conflict.
Fig 7
Fig 7. Example of a bifurcation diagram of a D—A conflict.
Fig 8
Fig 8. Four different sets of D—A conflicts (see text for their meanings).
Fig 9
Fig 9. Sets of D—A conflicts (shaded regions) where a periodic stalemate is the only possible outcome.
Fig 10
Fig 10. Time patterns of losses L21 in six different D—A conflicts (see points 1, …, 6 in Fig 7).
Fig 11
Fig 11. Mean loss L¯21 when the basic recruitment of the D group is increased (see points 1, 2, …, 6 in Fig 7).
Fig 12
Fig 12. Example of a bifurcation diagram of a A—A conflict.
Fig 13
Fig 13. The structure of all possible conflicts between three groups (D and A are defense and attack groups).
Fig 14
Fig 14. A military chaotic stalemate for a conflict of type (5) in Fig 13.
(a) the stalemate in the three dimensional space of the losses L+i; (b) the PPP where L+3* and L+3** are subsequent peaks of the losses of the third group; (c) ten years long segments of the corresponding time series.
Fig 15
Fig 15. Time evolution of the losses in the conflict described in Fig 14.
The continuous curve is as in Fig 14 while the dotted one has been obtained for a 1% variation of the initial loss of the D group.
Fig 16
Fig 16. Stalemate of the same conflict described in Fig 14 but with an increased reactiveness ρ1 of the D group (from ρ1 = 0.05 to ρ1 = 0.5).
Fig 17
Fig 17. Aperiodic stalemates in conflicts between three groups.
Top: quasi-periodic stalemate for a conflict of type (6) in Fig 13. Bottom: chaotic stalemate for a conflict of type (9) in Fig 13.
Fig 18
Fig 18
A conflict between five groups (a), and the time patterns of the losses of its chaotic stalemate (b).
Fig 19
Fig 19. Losses L21 of the D group and size x2 of the A group in a D—A conflict.
(continuous curves) without any intervention the conflict tends toward a periodic stalemate; (dotted curves) with a shock given when the damages are high the A group is not eradicated; (dashed curves) with a shock given when the damages start raising up the A group is eradicated.
Fig 20
Fig 20. The modified model when an exogenous stress w(t) is influencing the conflict.
Fig 21
Fig 21. In the red regions the stalemate is chaotic because the Lyapunov exponent is positive.
In the yellow regions the stalemate is quasi-periodic and in the green regions it is periodic. On the vertical axis (i.e., when there are no seasons) the stalemate is periodic and its period (in weeks) is indicated on the right of the figure. Points A—E correspond to conflicts whose time series are reported in (see Fig A5.1 and Appendix 5 in S1 File).
Fig 22
Fig 22. The case of mixed recruitment strategies.
The influence of propensity to defend of an A group in the stalemate of a DA conflict.
Fig 23
Fig 23. The loss lij inflicted to group j by one unit of the group i of its enemies when the group j is not easily detectable because hidden in a civil population.
Fig 24
Fig 24. The influence of undetectability of the A group on the stalemate of a D—A conflict.
Fig 25
Fig 25
Two independent DA conflict (a) and three PPP’s of the second DA conflict for three increasing values of the spreading of the enthusiasm for attack strategies: (a) σ = 0; (b) σ = 0.005; (c) σ = 0.06.

Similar articles

Cited by

References

    1. Cioffi-Revilla C Mathematical contributions to the scientific understanding of war. Formal Theories of Politics, 1989, 561–575.
    1. Kress M. Modeling armed conflicts. Science, 2012; 336: 865–869. doi: 10.1126/science.1217724 - DOI - PubMed
    1. Cederman LE. Modeling the size of wars: From billiard balls to sandpiles. American Political Science Review, 2003, 97(1): 135–150.
    1. Clauset A. Trends and fluctuations in the severity of interstate wars. Science Advances, 2018, 4: 3580. doi: 10.1126/sciadv.aao3580 - DOI - PMC - PubMed
    1. Rinaldi S, Della Rossa F. Conflicts among N armed groups: Scenarios from a new descriptive model. Nonlinear Dynamics 2017; 1–10