. 2022 Apr 12;17(4):979-992.
doi: 10.1016/j.stemcr.2022.02.001. Epub 2022 Mar 3.

Development of a scalable method to isolate subsets of stem cell-derived pancreatic islet cells

Affiliations

Development of a scalable method to isolate subsets of stem cell-derived pancreatic islet cells

Audrey V Parent et al. Stem Cell Reports. .

Abstract

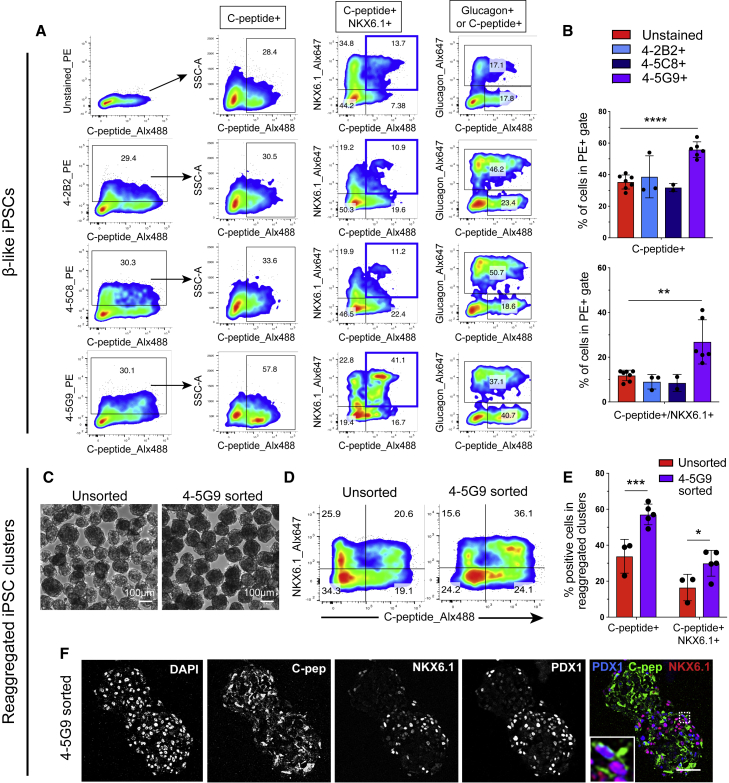
Cell replacement therapy using β cells derived from stem cells is a promising alternative to conventional diabetes treatment options. Although current differentiation methods produce glucose-responsive β cells, they can also yield populations of undesired endocrine progenitors and other proliferating cell types that might interfere with long-term islet function and safety of transplanted cells. Here, we describe the generation of an array of monoclonal antibodies against cell surface markers that selectively label stem cell-derived islet cells. A high-throughput screen identified promising candidates, including three clones that mark a high proportion of endocrine cells in differentiated cultures. A scalable magnetic sorting method was developed to enrich for human pluripotent stem cell (hPSC)-derived islet cells using these three antibodies, leading to the formation of islet-like clusters with improved glucose-stimulated insulin secretion and reduced growth upon transplantation. This strategy should facilitate large-scale production of functional islet clusters from stem cells for disease modeling and cell replacement therapy.

Keywords: cell therapy; diabetes; directed differentiation; pancreatic beta cells; regenerative medicine.


Figures

None
Graphical abstract
Figure 1
Figure 1
Generation of monoclonal antibodies recognizing cell surface antigens of hPSC-derived pancreatic cells (A) Schematic outlining the differentiation protocol to generate pancreatic β-like cells from hPSCs and sorting methods to form enriched β clusters (eBCs). More details on the culture conditions are included in the Experimental Procedures section. (B) Quantification of the number of clones that bound 1%–10%, 10%–30%, or >30% of all cells. Representative examples of each category of clones are shown. (C) Quantification of the number of clones that bound 1%–10%, 10%–30%, or >30% insulin-expressing cells. Representative examples of each category of clones are shown. (D) Flow cytometric analysis of the percentage of cells co-stained for C-peptide and clones 4-2B2, 4-5C8, or 4-5G9. (E) Flow cytometric analysis of PDX1 and C-peptide expression in 4-2B2+, 4-5C8+, and 4-5G9+ cells. See also Figure S1.
Figure 2
Figure 2
4-2B2-mediated cell sorting generates clusters enriched for β cells (A) Schematic of gating strategy used for FACS based on GFP expression or 4-2B2 labeling. (B) Fluorescence images of unsorted, GFP sorted, and 4-2B2 sorted eBCs after transfer in suspension plates. Scale bars, 200 μm. (C and D) Representative FACS plots (C) and quantification (D) of C-peptide+ and NKX6.1+ cells in unsorted, GFP sorted, and 4-2B2 sorted eBCs. Data are represented as mean ± SD. Each point is an independent experiment. ∗∗∗p < 0.001 determined by two-tailed unpaired t test. (E) Images of kidneys from mice transplanted with unsorted, GFP sorted, or 4-2B2 sorted clusters. Kidneys were harvested 12 weeks post-transplantation. n = 2 for GFP and n = 3 for unsorted and 4-2B2 sorted grafts. The occurrence of overgrown structures was 3/3 for unsorted, 1 very small structure in 1/2 GFP grafts, and 0/3 for 4-2B2 grafts. (F) Immunofluorescence images of unsorted, GFP sorted, or 4-2B2 sorted grafts stained with DAPI (blue), C-peptide (C-pep, green), and glucagon (GCG, red). Scale bars, 50 μm. (G) Immunofluorescence images of unsorted, GFP sorted, or 4-2B2 sorted grafts stained with DAPI (blue), vimentin (green), and Ki67 (red). Scale bars, 50 μm.
Figure 3
Figure 3
Generation of functional eBCs via scalable magnetic sorting (A–C) Representative FACS plots and quantification of C-peptide+ (A and C) and C-peptide+/NKX6.1+ (B and C) cells in pre-sorted samples or eluted fractions following magnetic sorting with the 4-2B2, 4-5C8, and 4-5G9 mAbs. Data are represented as mean ± SD. Each point is an independent experiment. p < 0.05, ∗∗p < 0.01, and ∗∗∗p < 0.001 determined by two-tailed unpaired t test. (D) Quantification of the percentage of input cells recovered after GFP-based FACS or magnetic bead sorting using the 4-2B2, 4-5C8, or 4-5G9 clones. p < 0.05, ∗∗p < 0.01, and ∗∗∗p < 0.001 determined by two-tailed unpaired t test. (E) Fluorescence images of unsorted, 4-2B2 sorted, 4-5C8 sorted, and 4-5G9 sorted eBCs 1 week after magnetic enrichment. Scale bars, 200 μm. (F and G) Representative FACS plots (F) and quantification (G) of C-peptide+ and NKX6.1+ cells in unsorted, GFP FACS sorted, 4-2B2 MACS sorted, 4-5C8 MACS sorted, and 4-5G9 MACS sorted eBCs 1 week after enrichment. Data are represented as mean ± SD. Each point is an independent experiment. p < 0.05, ∗∗p < 0.01, and ∗∗∗p < 0.001 determined by two-tailed unpaired t test. (H) Dynamic secretion of C-peptide in response to stimulation with 20 mM glucose and 30 mM KCl in an in vitro perifusion assay. The starting basal glucose concentration was 2.8 mM. n = 3–4 independent experiments. Data are represented as mean ± SD. p < 0.05 determined by two-tailed unpaired t test. See also Figure S2.
Figure 4
Figure 4
Sorting using the 4-2B2 and 4-5C8 clones also enriches for α cells (A) Immunofluorescence analysis of human adult pancreas stained for C-peptide (C-pep, green), glucagon (GCG, blue), and the 4-2B2, 4-5C8, and 4-5G9 mAbs (red). Scale bars, 50 μm. (B) Flow cytometric analysis of glucagon and 4-2B2/4-5C8/4-5G9 co-expression at the β-like stage. Gates were drawn to quantify glucagon expression in cells strongly, weakly, or not labeled by the mAbs. (C and D) Representative FACS plots (C) and quantification (D) of glucagon+ cells in unsorted, GFP FACS sorted, 4-2B2 MACS sorted, 4-5C8 MACS sorted, and 4-5G9 MACS sorted eBCs 1 week after enrichment. Data are represented as mean ± SD. Each point is an independent experiment. p < 0.05 and ∗∗p < 0.01 determined by two-tailed unpaired t test. (E) Immunofluorescence images of unsorted, 4-2B2 sorted, 4-5C8 sorted, and 4-5G9 sorted clusters stained with DAPI (blue), C-peptide (C-pep, green), and glucagon (GCG, red). Scale bars, 50 μm. (F and G) Representative FACS plots (F) and quantification (G) of somatostatin+ cells in unsorted, 4-2B2 sorted, 4-5C8 sorted, and 4-5G9 sorted eBCs 1 week after enrichment. Data are represented as mean ± SD. Each point is an independent experiment. p < 0.05 determined by two-tailed unpaired t test.
Figure 5
Figure 5
In vivo characterization of magnetically sorted eBCs (A and B) NSG mice transplanted with unsorted, 4-2B2 sorted, 4-5C8 sorted, or 4-5G9 sorted clusters were monitored biweekly using non-invasive bioluminescence imaging to quantify changes in cell mass over time. Results for one representative mouse in each group are shown in (A), and the quantification for all mice is shown in (B). Dotted purple line represents data from one mouse transplanted with 4-5G9 sorted clusters that had higher signal than the rest of the group. n = 3–6 for all time points except weeks 12 (n = 2), 16 (n = 2), and 20 (n = 1) of the 4-5C8 group because of death of mice prior to the end of the experiment. This reduction in the number of animals is indicated by a change from a solid to a dotted line. (C) Quantification of bioluminescence levels at week 10. Results are shown as a percentage of week 6. p < 0.05 as determined by two-tailed unpaired t test (n = 3–6). (D) Immunofluorescence images of unsorted, 4-2B2 sorted, 4-5C8 sorted, and 4-5G9 sorted grafts stained for C-peptide (C-pep, green), glucagon (GCG, red), and somatostatin (SST, blue). DAPI staining is shown in white in a separate panel. Dotted lines indicate the separation between graft and kidney. Scale bars, 50 μm. See also Figure S3.
Figure 6
Figure 6
Magnetic sorting of iPSC-derived islet cells (A) Representative FACS plots (A) and quantification (B) of C-peptide, NKX6.1, and glucagon expression in iPSC-derived β-like cells labeled with the 4-2B2, 4-5C8, or 4-5G9 mAbs. The percentage of positive cells is quantified in non-gated samples for the unstained control or after pre-gating to include the cells with the strongest labeling for each mAb (top 30%). Data are represented as mean ± SD. ∗∗p < 0.01 and ∗∗∗∗p < 0.0001 determined by two-tailed unpaired t test. (C) Bright-field images of unsorted and 4-5G9 sorted clusters 1 week after magnetic enrichment. Scale bars, 100 μm. (D and E) Representative FACS plots (D) and quantification (E) of C-peptide+ and NKX6.1+ cells in iPSC-derived unsorted and 4-5G9 MACS sorted clusters 1 week after enrichment. Data are represented as mean ± SD. Each point is an independent experiment. p < 0.05 and ∗∗∗p < 0.001 determined by two-tailed unpaired t test. (F) Immunofluorescence images of unsorted and 4-5G9 sorted iPSC-derived clusters stained with DAPI, C-peptide (C-pep, green), NKX6.1 (red), and PDX1 (blue). Scale bar, 50 μm.

References

    1. Ameri J., Borup R., Prawiro C., Ramond C., Schachter K.A., Scharfmann R., Semb H. Efficient generation of glucose-responsive beta cells from isolated GP2+ human pancreatic progenitors. Cell Rep. 2017;19:36–49. doi: 10.1016/j.celrep.2017.03.032. - DOI - PubMed
    1. Bru-Tari E., Oropeza D., Herrera P.L. Cell heterogeneity and paracrine interactions in human islet function: a perspective focused in β-cell regeneration strategies. Front Endocrinol. (Lausanne) 2020;11:619150. doi: 10.3389/fendo.2020.619150. - DOI - PMC - PubMed
    1. Cabrera O., Berman D.M., Kenyon N.S., Ricordi C., Berggren P.-O., Caicedo A. The unique cytoarchitecture of human pancreatic islets has implications for islet cell function. Proc. Natl. Acad. Sci. U.S.A. 2006;103:2334–2339. doi: 10.1073/pnas.0510790103. - DOI - PMC - PubMed
    1. Capozzi M.E., Svendsen B., Encisco S.E., Lewandowski S.L., Martin M.D., Lin H., Jaffe J.L., Coch R.W., Haldeman J.M., MacDonald P.E., et al. β Cell tone is defined by proglucagon peptides through cAMP signaling. JCI Insight. 2019;4 doi: 10.1172/jci.insight.126742. - DOI - PMC - PubMed
    1. Cogger K.F., Sinha A., Sarangi F., McGaugh E.C., Saunders D., Dorrell C., Mejia-Guerrero S., Aghazadeh Y., Rourke J.L., Screaton R.A., et al. Glycoprotein 2 is a specific cell surface marker of human pancreatic progenitors. Nat. Commun. 2017;8:331. doi: 10.1038/s41467-017-00561-0. - DOI - PMC - PubMed

Publication types