. 2022 Mar 3;82(5):920-932.e7.
doi: 10.1016/j.molcel.2022.02.007.

Kynurenine importation by SLC7A11 propagates anti-ferroptotic signaling

Affiliations

Kynurenine importation by SLC7A11 propagates anti-ferroptotic signaling

Alessandra Fiore et al. Mol Cell. .

Abstract

IDO1 oxidizes tryptophan (TRP) to generate kynurenine (KYN), the substrate for 1-carbon and NAD metabolism, and is implicated in pro-cancer pathophysiology and infection biology. However, the mechanistic relationships between IDO1 in amino acid depletion versus product generation have remained a longstanding mystery. We found an unrecognized link between IDO1 and cell survival mediated by KYN that serves as the source for molecules that inhibit ferroptotic cell death. We show that this effect requires KYN export from IDO1-expressing cells, which is then available for non-IDO1-expressing cells via SLC7A11, the central transporter involved in ferroptosis suppression. Whether inside the "producer" IDO1+ cell or the "receiver" cell, KYN is converted into downstream metabolites, suppressing ferroptosis by ROS scavenging and activating an NRF2-dependent, AHR-independent cell-protective pathway, including SLC7A11, propagating anti-ferroptotic signaling. IDO1, therefore, controls a multi-pronged protection pathway from ferroptotic cell death, underscoring the need to re-evaluate the use of IDO1 inhibitors in cancer treatment.

Keywords: GCN2; IDO1; NRF2; SLC7A11; cancer; ferroptosis; kynurenine; metabolism; tryptophan.


Conflict of interest statement

Declaration of interests The authors declare no competing interests directly related to this work. Thomas Köcher is affiliated with Vienna BioCenter Core Facilities GmbH. Peter J. Murray is on the scientific advisory boards of Palleon Pharma and ImCheck Pharm, which is unrelated to the content herein.

Figures

Figure 1
Figure 1. IDO1 induces T cells proliferation arrest and resistance to ferroptosis.
(A) Simplified schema of the co-culture between mitomycin-treated wt or IDO1 ko HeLa cells with allogeneic CD8+ lymphocytes in the presence of CD3-CD28 dynabeads. (B) Quantification of CD8+ T cell proliferation, using CFSE staining, in the presence of wt or IDO1 ko HeLa cells relative to CD8+ T cell control. (C) Quantification of IDO1 expression by tracking mCherry by live imaging during the co-culture with CD8+ T cells. (D) Intensity area values for tryptophan (TRP), kynurenine (KYN), kynurenic acid (KYNA) and phenylalanine (Phe) detected by LC-MS-based targeted metabolomics in the supernatant after 48 hr of co-culture between wt or IDO1 ko HeLa cells with CD8+ lymphocytes. (E) Schematic depicting the experimental approach used in F. CS, conditioned supernatant. (F) 24 hours of pre-conditioning of wt HeLa cells with the supernatant from the co-cultures with wt, but not IDO1 ko HeLa cells, protects from erastin-induced ferroptosis. Cell death was monitored over time using CellTox, counting for green objects normalized to cell confluence. B, C, D and F n=3 biological replicates, bars are SDs *p < 0.05, **p < 0.01, ****p < 0.0001 for multiple comparisons calculated using one-way ANOVA with Tukey’s HSD test in (B) and (F) and two-tailed Student’s t test for pairwise comparisons in (D).
Figure 2
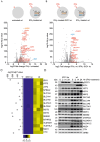
Figure 2. Dissection of IDO1-dependent gene expression
(A, B) Schematic depicting the experimental approach and volcano plots showing overall changes in the transcriptome in untreated versus IFNγ-treated wt HeLa cells (A) and in wt versus IDO1 ko cells (B). (C) Heatmap of selected genes that were significantly differentially expressed after 24 hr of IFNγ treatment in wt versus IDO1 ko HeLa cells (adjusted p-value <0.05). (D) Immunoblot validation of selected target proteins from (C) after 3, 14 and 24 hr of of IFNγ treatment. (A-C) Log-adjusted p value was calculated from three independent biological replicates
Figure 3
Figure 3. KYN metabolites protect against ferroptosis.
(A) Simplified diagram of the TRP catabolism pathway. (B, C) Quantification of cell death in HeLa cells treated for 48 hr with 10 µM of erastin (B) or 1 µM of RSL3 (C) in the presence of 200 µM of TRP, KYN, KYNA, 3HK, xanthurenic acid (XA), anthranilic acid (AA), HAA, quinolate (QA), and picolinate (PA). 2 µM of Fer-1 was used as a control to block ferroptosis. (D, E, F) Quantification of cell death in SKOV3 (D), HT1080 (E) and PT45 (F) cells concurrently treated for 48 hr with erastin and 200 µM KYN, 3HK and HAA. Fer-1 was added as a control. (G) MS-based quantitative metabolomics of supernatant of wt vs. IDO1 ko HeLa cells after 24 and 48 hr IFNγ treatment. (H) Quantification of cell death in HeLa cells treated for 48 hr with 10 µM of erastin (left) 1 µM of RSL3 (right) in the presence or not of a physiologically relevant media (dmemKP standing for DMEM reconstituted with “KYN Pathway” metabolites) that contains 30 µM KYN, 22 µM AA and 1 µM HAA. (I) KYN, 3HK and HAA block ROS accumulation induced by 8 hours of erastin treatment. ROS quantification was determined by flow cytometry using the H2DCFDA probe. (J) KYN, 3HK and HAA block lipid peroxidation induced by 8 hr of erastin treatment. Lipid peroxidation was determined by flow cytometry using the fluorescent lipid peroxidation reporter molecule, C11-BODIPY. (K) Cell-free scavenging activity of 200 µM of each metabolite determined by changes in the absorbance at 517 nm of the stable radical DPPH relative to water control (n = 4 technical replicates, bars are SDs). B, C, D, E, F, H, I, J and K n= 3 biological replicates, bars are SDs *p < 0.05, **p < 0.01, ***p < 0.001, ****p < 0.0001 for multiple comparisons calculated using one-way ANOVA with Dunnett’s test (B, C, D, E, F, I, J and K) and with Tukey’s HSD test in (H).
Figure 4
Figure 4. KYN metabolites and TRP starvation protect against ferroptosis.
(A) Simplified diagram of the KYNU pathway. (B) MS-based quantitative metabolomics of cell extract of HeLa cells transfected with with KYNU siRNA (siCTRL as negative control) after 24 hr of KYN treatment. (C) Quantification of cell death in siCTRL - or siKYNU-transfected cells treated for 48 hr with 10 µM of erastin in the presence of 200 µM of KYN. Cell death was monitored after 48 hr using CellTox, counting for green objects and expressed as percentage of cell death to the control. (D) Expression of KYNU and HA-tag in HeLa cells 48hr after transfection with a mock or HA-KYNU-plasmid. (E) MS-based quantitative metabolomics of cell extract of HeLa cells transfected with with HA-KYNU (a mock plasmid was used as negative control) after 24 hr of KYN treatment. (F) Quantification of cell death in mock- or HA-KYNU-transfected cells treated for 48 hr with 10 µM of erastin in the presence of 200 µM of KYN. Cell death was monitored after 48 hr using CellTox, counting for green objects and expressed as percentage of cell death to the control. (G) Immunoblotting analysis of mTOR activity and ISR over time during TRP deprivation in HeLa cells. (H) Over time quantification of cell growth of HeLa cells in the presence or absence of TRP. (I,J) Quantification of cell death in HeLa cells treated for 48 hr with 10 µM of RSL3 (I) or erastin (J) in the presence of rich (+TRP) or TRP deprived media (-TRP). Fer-1 was added as a control. Cell death was monitored after 48 hr using CellTox, counting for green objects and, where indicated, normalized to cell confluence. (K) TRP deprivation blocks ROS accumulation induced by erastin and RSL3 determined by flow cytometry using H2DCFDA probe after 8 hr of treatment. (L) Quantification of cell death in HeLa cells treated for 48 hr with 10 µM of erastin in the presence of rich (+TRP) or TRP deprived media (-TRP) and in the presence of 1 mM of BSO. B, C, E, F, H, I, J, K and L n= 3 biological replicates, bars are SDs *p < 0.05, **p < 0.01, ***p < 0.001, ****p < 0.0001 unpaired t-test for B and E and one-way ANOVA with Tukey’s HSD test in (C, F, I, J, K, L).
Figure 5
Figure 5. KYN metabolites protect against ferroptosis through the NRF2/SLC7A11 axis
(A) Immunoblot analysis of HeLa cells concurrently treated for 3, 6 and 9 hr with erastin and 200 µM KYN, 3HK, HAA or TRP starved. (B) Venn diagram summarizing the contribution of each component of IDO1 activity in the redox-protective program. (C - E) Wt (C), AHR ko (D) or NRF2 ko (E) HeLa cells were concurrently treated for 48 hr with erastin in the presence of 200 µM KYN, 3HK and HAA. Cell death was monitored over time using CellTox, counting for green objects normalized to cell confluence. n = 3 biological replicates, bars are SDs. (F) Loss of NRF2, but not AHR, prevents KYN-dependent SLC7A11 upregulation. Immunoblot analysis of wt, AHR ko and NRF2 ko HeLa cells concurrently treated for 3, 6 and 9 hr with erastin and 200 µM KYN. (G) Immunoblot analysis of NRF2 and SLC7A11 in wt or NRF2 ko HeLa cells treated for 12 and 24 hr with 200 µM of KYN. (H) Schematic depicting the experimental approach used in H and I. CS, conditioned supernatant. (I) Quantification of erastin-induced cell death in wt or NRF2 ko HeLa cells pre-conditioned for 24 hr with supernatant from 48 hr of the co-colture between wt or IDO1 ko HeLa cells with allogeneic CD8+ lymphocytes in the presence of CD3-CD28 dynabeads. Cell death was monitored at 48 hr using CellTox, counting for green objects normalized to cell confluence. (J) Immunoblot analysis and quantification of the protein blots relative to the vinculin loading control of SLC7A11 in wt and NRF2 ko HeLa cells treated for 24 hr with the supernatant from the co-colture between wt or IDO1 ko HeLa cells with CD8+ lymphocytes in the presence of CD3-CD28 dynabeads. n = 3 biological replicates, bars are SDs. **p < 0.01, ****p < 0.0001 for multiple comparisons calculated using one-way ANOVA with with Tukey’s HSD test.
Figure 6
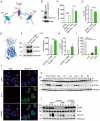
Figure 6. SLC7A11 mediates KYN transport in cancer cells
(A) Simplified scheme of SLC7 transporters and relative inhibitors. (B) SLC7A11 immunoblot of HeLa cells transfected with SLC7A11 siRNA (siCTRL as negative control). (C) Flow cytometry evaluation of KYN uptake upon 5 min of treatment with 200 µM of KYN in transfected cells in B. KYN uptake was monitored by flow cytometry analyzing the mean fluorescence intensity (MFI) in the Pacific blue channel (one of three independent transfection experiments is shown, n = 3 biological replicates, bars are SDs). (D) Quantification of total D6-KYN uptake after 5 min of treatment with 200 µM of KYN into transfected cells in B (n = 3 biological replicates, bars are SDs). (E) Molecular structure representation of the complex SLC7A11/SLC3A2 showing the K198A mutation. (F) Immunoblot of HeLa cells transfected with SLC3A2 and SLC7A11 wt or K198A-overexpressing plasmids (an empty vector was used as a negative control). (G) Flow cytometry evaluation of KYN uptake upon 5 min of treatment with 200 µM of KYN in transfected cells. KYN uptake was monitored by flow cytometry analyzing the mean fluorescence intensity (MFI) in the Pacific blue channel (one of three independent transfection experiments is shown, n = 3 biological replicates, bars are SDs). (H) Quantification of total D6-KYN uptake after 5 min of treatment with 200 µM of KYN into transfected cells in F (n = 3 biological replicates, bars are SDs). (I) Transport assays of 14C-cystine (14C-CYS) uptake for cells transfected with plasmids containing wild type SLC7A11 and SLC3A2 in the presence of 1 mM competing non-radioactive substrates. (n> 6 biological replicates, bars are SDs). (J) Immunofluorescence of KYN accumulation in CTRL cells and HeLa cells transfected with SLC7A11 after 15 min of treatment with and 200 µM KYN (representative images of one of three independent transfection experiments). (K) Immunoblot analysis of SLC7A5 and SLC7A11 in HeLa cells treated for 12, 24 and 36 hr with 200 µM of KYN, KYNA, 3HK, XA, AA, HAA, QA, and PA. (L) Immunoblot of HeLa cells concurrently treated with 200 µM KYN for 12 or 24 hr and 500 nM of GCN2i or 5 times more cystine (CYS) compared to normal medium. *p < 0.05, **p < 0.01, ***p < 0.001, ****p < 0.0001 for multiple comparisons calculated using one-way ANOVA with Tukey’s HSD test in (C) and Dunnett’s test (I) and unpaired t-test for D, G and H.

References

    1. Anders S, Huber W. Differential expression analysis for sequence count data. Genome Biol. 2010;11:R106. doi: 10.1186/gb-2010-11-10-r106. - DOI - PMC - PubMed
    1. Arensman MD, Yang XS, Leahy DM, Toral-Barza L, Mileski M, Rosfjord EC, Wang F, Deng S, Myers JS, Abraham RT, et al. Cystine-glutamate antiporter xCT deficiency suppresses tumor growth while preserving antitumor immunity. Proc Natl Acad Sci USA. 2019;116:9533–9542. doi: 10.1073/pnas.1814932116. - DOI - PMC - PubMed
    1. Austin CJ, Mailu BM, Maghzal GJ, Sanchez-Perez A, Rahlfs S, Zocher K, Yuasa HJ, Arthur JW, Becker K, Stocker R, et al. Biochemical characteristics and inhibitor selectivity of mouse indoleamine 2,3-dioxygenase-2. Amino Acids. 2010;39:565–578. - PubMed
    1. Ben-Sahra I, Howell JJ, Asara JM, Manning BD. Stimulation of de novo pyrimidine synthesis by growth signaling through mTOR and S6K1. Science. 2013;339:1323–1328. doi: 10.1126/science.1228792. - DOI - PMC - PubMed
    1. Bessede A, Gargaro M, Pallotta MT, Matino D, Servillo G, Brunacci C, Bicciato S, Mazza EM, Macchiarulo A, Vacca C, et al. Aryl hydrocarbon receptor control of a disease tolerance defence pathway. Nature. 2014;511:184–190. doi: 10.1038/nature13323. - DOI - PMC - PubMed

Publication types

MeSH terms