. 2022 Jun 25:827:154235.
doi: 10.1016/j.scitotenv.2022.154235. Epub 2022 Mar 1.

Model-based assessment of COVID-19 epidemic dynamics by wastewater analysis

Affiliations

Model-based assessment of COVID-19 epidemic dynamics by wastewater analysis

Daniele Proverbio et al. Sci Total Environ. .

Abstract

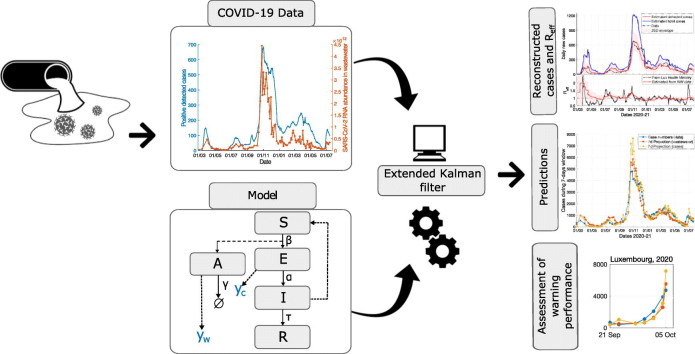
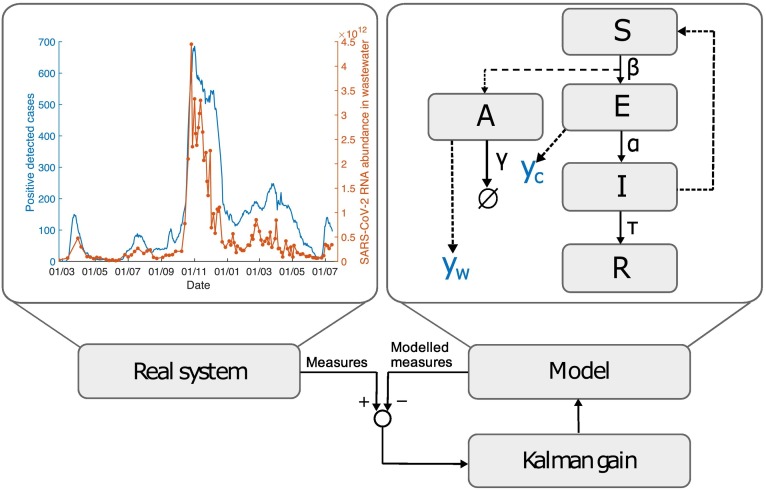
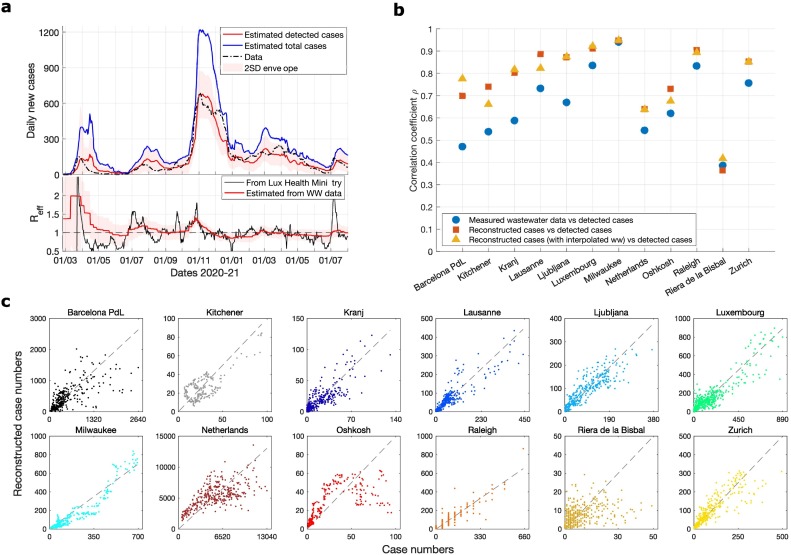
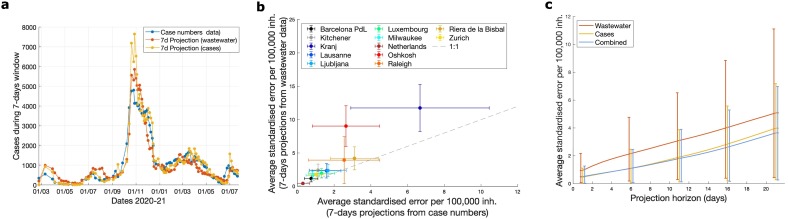
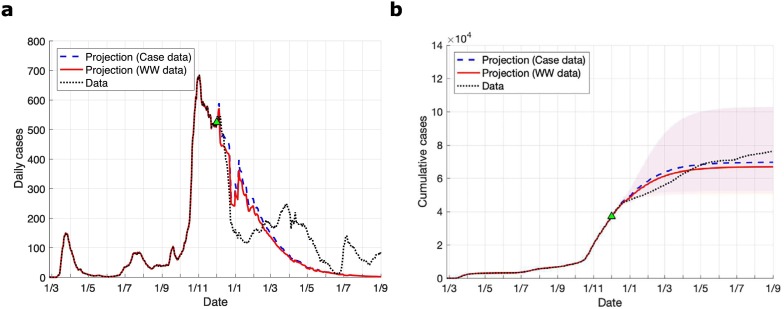
Continuous surveillance of COVID-19 diffusion remains crucial to control its diffusion and to anticipate infection waves. Detecting viral RNA load in wastewater samples has been suggested as an effective approach for epidemic monitoring and the development of an effective warning system. However, its quantitative link to the epidemic status and the stages of outbreak is still elusive. Modelling is thus crucial to address these challenges. In this study, we present a novel mechanistic model-based approach to reconstruct the complete epidemic dynamics from SARS-CoV-2 viral load in wastewater. Our approach integrates noisy wastewater data and daily case numbers into a dynamical epidemiological model. As demonstrated for various regions and sampling protocols, it quantifies the case numbers, provides epidemic indicators and accurately infers future epidemic trends. Following its quantitative analysis, we also provide recommendations for wastewater data standards and for their use as warning indicators against new infection waves. In situations of reduced testing capacity, our modelling approach can enhance the surveillance of wastewater for early epidemic prediction and robust and cost-effective real-time monitoring of local COVID-19 dynamics.

Keywords: COVID-19; Early warning system; Epidemiological modelling; Kalman filter; Surveillance of wastewater for early epidemic prediction (SWEEP); Wastewater-based epidemiology.


Conflict of interest statement

Declaration of competing interest The authors declare the following financial interests/personal relationships which may be considered as potential competing interests: Atte Aalto reports financial support was provided by Luxembourg National Research Fund (FNR). Daniele Proverbio reports financial support was provided by Luxembourg National Research Fund (FNR). Francoise Kemp reports financial support was provided by Luxembourg National Research Fund (FNR). Stefano Magni reports financial support was provided by Luxembourg National Research Fund (FNR). Leslie Ogorzaly reports financial support was provided by Luxembourg National Research Fund (FNR). Henri-Michel Cauchie reports financial support was provided by Luxembourg National Research Fund (FNR). Jorge Goncalves reports financial support was provided by 111 Project on Computational Intelligence and Intelligent Control.

Figures

Unlabelled Image
Graphical abstract
Fig. 1
Fig. 1
Model workflow. The Kalman filter combines measurements from the real system with predictions from the dynamical model, which extends a SEIR model. Empirical data are daily positive cases, shown in blue as the smoothed moving average, and wastewater sampled data, shown in orange with unit of measure of RNA copies/day/100,000 equivalent inhabitants (example for Luxembourg). Details of the SEIR blocks are described in Section 2.4.
Fig. 2
Fig. 2
Reconstruction of case numbers and inference of epidemic indicators. a: Reconstruction example for Luxembourg. Top: Comparison of case numbers, official detected data (black line), reconstructed by CoWWAn from wastewater data (red) including the 2 Standard Deviations ≃95% confidence interval (shadowed region), and total positive cases inferred by CoWWAn (blue). Bottom: Reff, estimated by CoWWAn (red, with its associated 2 SD shadowed region) or officially reported by the Luxembourg Ministry of Health. b: Pearson's correlation coefficients ρ from linear regression between detected cases and measured wastewater data (blue), ρ between detected cases and CoWWAn-reconstructed case numbers from wastewater data (red, corresponding to correlation values from panels c), and ρ between CoWWAn-reconstructed case numbers from wastewater data (after interpolating wastewater data) and detected cases (yellow). c: Reconstruction results for all considered regional areas, compared with detected case numbers. The dashed line represents equal values.
Fig. 3
Fig. 3
Predictions of future epidemic trends using CoWWAn. a: Prediction examples for Luxembourg, comparing predictions over the 7-days ahead of each point (either estimated from case numbers or wastewater data) with the true detected cases in the same time period. b: Comparison of wastewater-based and cases-based predictions. The performance is evaluated in terms of average standardised error, normalised to equivalent population. The dashed line represents equal values. Error bars correspond to one standard deviation. c: Predictions performance for different time horizons (mean and 80th percentiles over the considered regions; outputs for single countries in Supplementary Fig. 17) for three inputs: case numbers, wastewater data, or both data combined. For all panels, “inh.” stands for inhabitants.
Fig. 4
Fig. 4
Long term projections using CoWWAn. a: Long-term projected curves of daily cases compared with daily detected case numbers. b: Long-term projected curves of cumulative cases compared with cumulative detected case numbers. Blue and red ribbons represent ±2σ error bounds (σ corresponds to a standard deviation); note that the ribbons might overlap. Both panels a and b report examples for Luxembourg data, with projections starting at the date marked by the green triangle.
Fig. 5
Fig. 5
Zoom into the epidemic resurgences visually recognised in the considered regions. Short-term projections used to identify robust trends in epidemic resurgence, for different examples (one per region; other examples in Supplementary Fig. 16). We compare 7-days projections from case numbers and from wastewater data with the true detected case numbers.
Unlabelled Image

References

    1. Ahmed W., Bivins A., Simpson S.L., Bertsch P.M., Ehret J., Hosegood I., Metcalfe S., Smith W.J., Thomas K.V., Tynan J., et al. Wastewater surveillance demonstrates high predictive value for COVID-19 infection on board repatriation flights to Australia. Environ. Int. 2021;158 doi: 10.1016/j.envint.2021.106938. - DOI - PMC - PubMed
    1. Althaus C.L. Estimating the reproduction number of Ebola virus (EBOV) during the 2014 outbreak in West Africa. PLoS Curr. 2014;6 doi: 10.1371/currents.outbreaks.91afb5e0f279e7f29e7056095255b288. - DOI - PMC - PubMed
    1. Anderson R.M., May R.M. Population biology of infectious diseases: part I. Nature. 1979;280(5721):361–367. doi: 10.1038/280361a0. - DOI - PubMed
    1. Bandala E.R., Kruger B.R., Cesarino I., Leao A.L., Wijesiri B., Goonetilleke A. Impacts of COVID-19 pandemic on the wastewater pathway into surface water: a review. Sci. Total Environ. 2021;774 doi: 10.1016/j.scitotenv.2021.145586. - DOI - PMC - PubMed
    1. Bibby K., Bivins A., Wu Z., North D. Making waves: plausible lead time for wastewater based epidemiology as an early warning system for COVID-19. Water Res. 2021;202 doi: 10.1016/j.watres.2021.117438. - DOI - PMC - PubMed