. 2022 Apr:569:37-43.
doi: 10.1016/j.virol.2022.02.002. Epub 2022 Feb 18.

The interplay of viral loads, clinical presentation, and serological responses in SARS-CoV-2 - Results from a prospective cohort of outpatient COVID-19 cases

Collaborators, Affiliations

The interplay of viral loads, clinical presentation, and serological responses in SARS-CoV-2 - Results from a prospective cohort of outpatient COVID-19 cases

Kerstin Puchinger et al. Virology. 2022 Apr.

Abstract

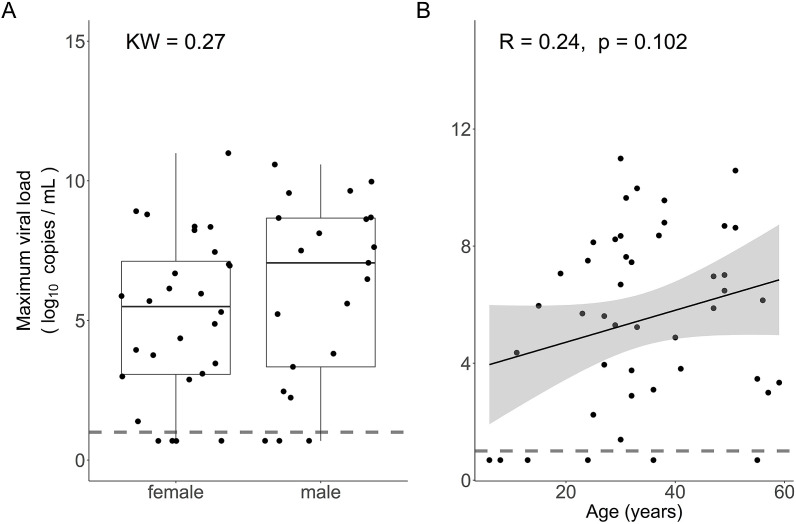
Risk factors for disease progression and severity of SARS-CoV-2 infections require an understanding of acute and long-term virological and immunological dynamics. Fifty-one RT-PCR positive COVID-19 outpatients were recruited between May and December 2020 in Munich, Germany, and followed up at multiple defined timepoints for up to one year. RT-PCR and viral culture were performed and seroresponses measured. Participants were classified applying the WHO clinical progression scale. Short symptom to test time (median 5.0 days; p = 0.0016) and high viral loads (VL; median maximum VL: 3∙108 copies/mL; p = 0.0015) were indicative for viral culture positivity. Participants with WHO grade 3 at baseline had significantly higher VLs compared to those with WHO 1 and 2 (p = 0.01). VLs dropped fast within 1 week of symptom onset. Maximum VLs were positively correlated with the magnitude of Ro-N-Ig seroresponse (p = 0.022). Our results describe the dynamics of VLs and antibodies to SARS-CoV-2 in mild to moderate cases that can support public health measures during the ongoing global pandemic.

Keywords: COVID-19; Immune response; Public health; RT-PCR; SARS-CoV-2; Serological testing; Viral culture.


Conflict of interest statement

The authors declare the following financial interests/personal relationships which may be considered as potential competing interests:

AW and MH (on the behalf of the institute) report personal fees and non-financial support from Roche Diagnostics, LO reports non-financial support from Roche Diagnostics. AW, MH and LO report non-financial support from Euroimmun, non-financial support from Viramed, non-financial support from Mikrogen. AW, MH, LO report grants, non-financial support and other from German Center for Infection Research (DZIF), grants and non-financial support from Government of Bavaria, non-financial support from BMW, non-financial support from Munich Police, non-financial support and other from Accenture. MH and AW report non-financial support from Dr. Becker MVZ during the conduct of the study. In addition, MH and AW have a patent on a sample system for sputum diagnostics of SARS-CoV-2 pending.

Figures

Fig. 1
Fig. 1
Viral load (log10 copies per millilitre) over time. Each colour presents one participant, each dot is one sample. The thick black line shows the LOESS estimation (locally estimated scatterplot smoothing or local regression), modelling the VL drop over Symptom to Test Time (STT) in days. The grey region represents the 95% confidence band of the LOESS. In the first week since symptom onset, the median VL was 7.3∙107 copies per mL and decreased subsequently. (For interpretation of the references to colour in this figure legend, the reader is referred to the Web version of this article.)
Fig. 2
Fig. 2
Viral culture result analysis.A: Viral Culture Result and Symptom to Test Time (STT) in days (Kruskal Wallis test = 0.0016, N = 32) for all samples where the viral culture was attempted. Each black dot represents one measurement (n = 32) of 27 patients. A positive viral culture result was characterised by a short STT, and the culture result tended to be negative when STT was high; B: SARS-CoV-2 maximum viral load of each participant and positivity of viral culture (Kruskal-Wallis test = 0.0002). Each black dot represents one patient (n = 48, for three patients no viral load was measured). The grey dashed line represents the detection limit of the VL. Viral culture results were positive when the maximum VLs were high and negative when maximum VLs were low. Positive viral culture results revealed to have significantly different maximum VL distributions compared to negative and not attempted viral cultures (Dunn’s post-test = 0.0084 and 0.0003, respectively), while the distributions of negative results and not attempted viral cultures were not significantly different (Dunn’s post-test = 0.98).
Fig. 3
Fig. 3
SARS-CoV-2 maximum viral load and baseline characteristic analysis. Each black dot represents one participant and the grey dashed line represents the detection limit of the VL. Maximum VL and A: Sex (Kruskal-Wallis test = 0.27), without significant difference between females and males. B: Age in years (rho = 0.22, P = 0.14). No significant correlation between age and VLs were detected. The grey area is the 95% confidence band on the linear model (black solid line).
Fig. 4
Fig. 4
Viral load and WHO Grading. Maximum VL and WHO Scale 1–2 and 3; WHO 1–2 includes asymptomatic and mildly ill participants (left boxplot) and WHO 3 represents moderate cases without the need of hospitalization (right boxplot). Each black dot represents one participant. The grey dashed line represents the detection limit of the VL. Participants graded as WHO 1 and 2 showed lower VLs than those graded as WHO 3 (Kruskal Wallis test = 0.01).
Fig. 5
Fig. 5
Maximum viral loads and antibody response. The grey area shows the 95% confidence band of the linear model (black solid line) and the grey dash line represents the detection limit of the VL. Each black dot represents one participant. Correlation of maximum VL with A: Ro-N-Ig (R = 0.34, p = 0.0022): Showing significant positive correlation between maximum VL and highest measured Ro-N-Ig value; B: Ro-RBD-Ig-quant (R = 0.093, p = 0.55): Showing no significant correlation between maximum VL and highest measured Ro-RBD-Ig-quant value; C: El-S1-IgG (R = 0.0052, p = 0.97): Showing no positive correlation between maximum VL and highest measured El-S1-IgG value; D: GS-cPass (R = 0.23, p = 0.15): Showing a trend of positive correlation between maximum VL and highest measured GS-cPass value, although not significant.
figs1
figs1
figs2
figs2
figs3
figs3

References

    1. Bullard J., et al. Predicting infectious severe acute respiratory Syndrome coronavirus 2 from diagnostic samples. Clin. Infect. Dis. 2020;71(10):2663–2666. - PMC - PubMed
    1. Carvalho T., Krammer F., Iwasaki A. The first 12 months of COVID-19: a timeline of immunological insights. Nat. Rev. Immunol. 2021;21(4):245–256. - PMC - PubMed
    1. Characterisation, W.H.O.W.G.o.t.C. and C.-i. Management of, A minimal common outcome measure set for COVID-19 clinical research. Lancet Infect. Dis. 2020;20(8):e192–e197. - PMC - PubMed
    1. Fajnzylber J., et al. SARS-CoV-2 viral load is associated with increased disease severity and mortality. Nat. Commun. 2020;11(1):5493. - PMC - PubMed
    1. He X., et al. Temporal dynamics in viral shedding and transmissibility of COVID-19. Nat. Med. 2020;26(5):672–675. - PubMed

Publication types