. 2022 Mar;10(3):e004032.
doi: 10.1136/jitc-2021-004032.

In PD-1+ human colon cancer cells NIVOLUMAB promotes survival and could protect tumor cells from conventional therapies

Affiliations

In PD-1+ human colon cancer cells NIVOLUMAB promotes survival and could protect tumor cells from conventional therapies

Caterina Ieranò et al. J Immunother Cancer. 2022 Mar.

Abstract

Background: Colorectal cancer (CRC) is one of the most prevalent and deadly tumors worldwide. The majority of CRC is resistant to anti-programmed cell death-1 (PD-1)-based cancer immunotherapy, with approximately 15% with high-microsatellite instability, high tumor mutation burden, and intratumoral lymphocytic infiltration. Programmed death-ligand 1 (PD-L1)/PD-1 signaling was described in solid tumor cells. In melanoma, liver, and thyroid cancer cells, intrinsic PD-1 signaling activates oncogenic functions, while in lung cancer cells, it has a tumor suppressor effect. Our work aimed to evaluate the effects of the anti-PD-1 nivolumab (NIVO) on CRC cells.

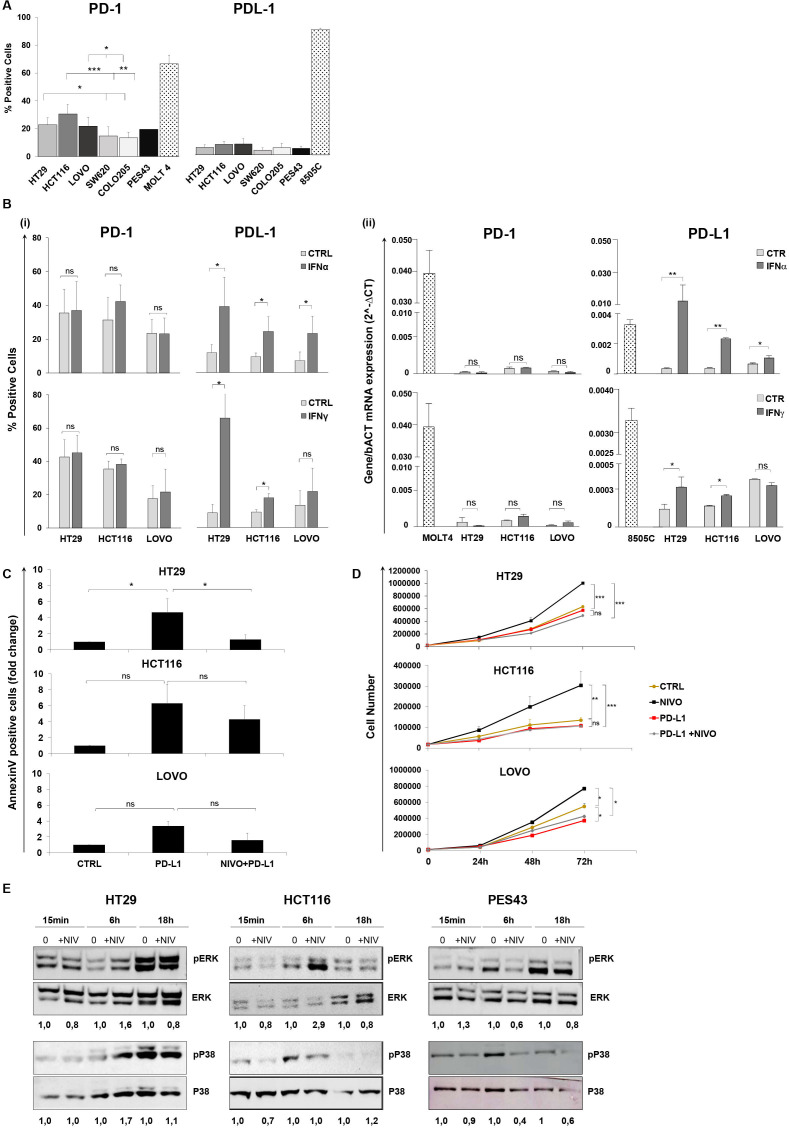
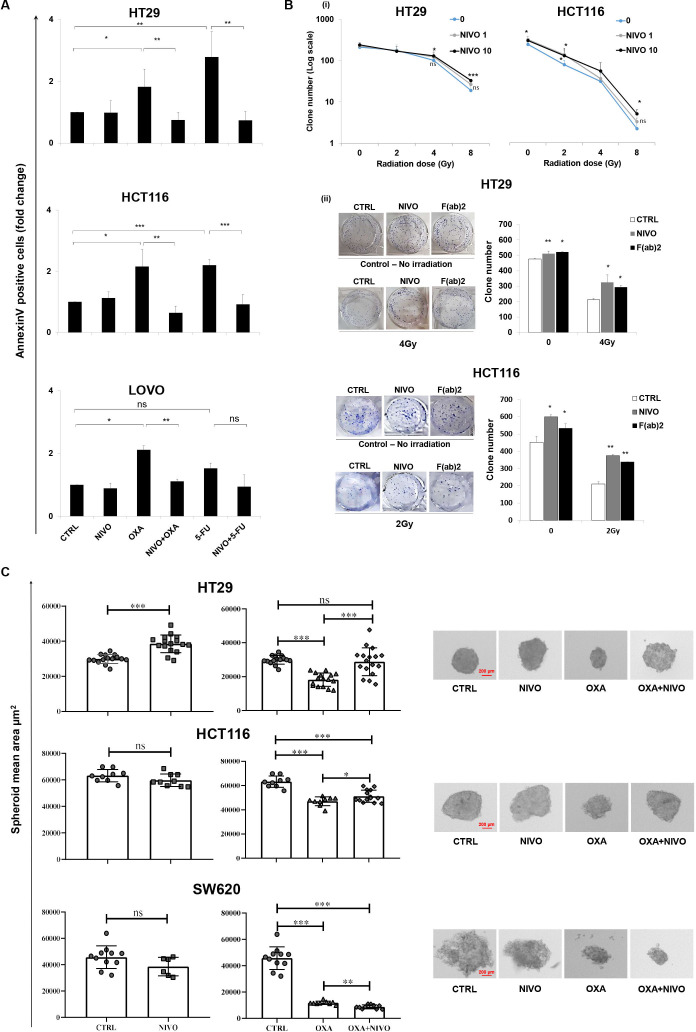
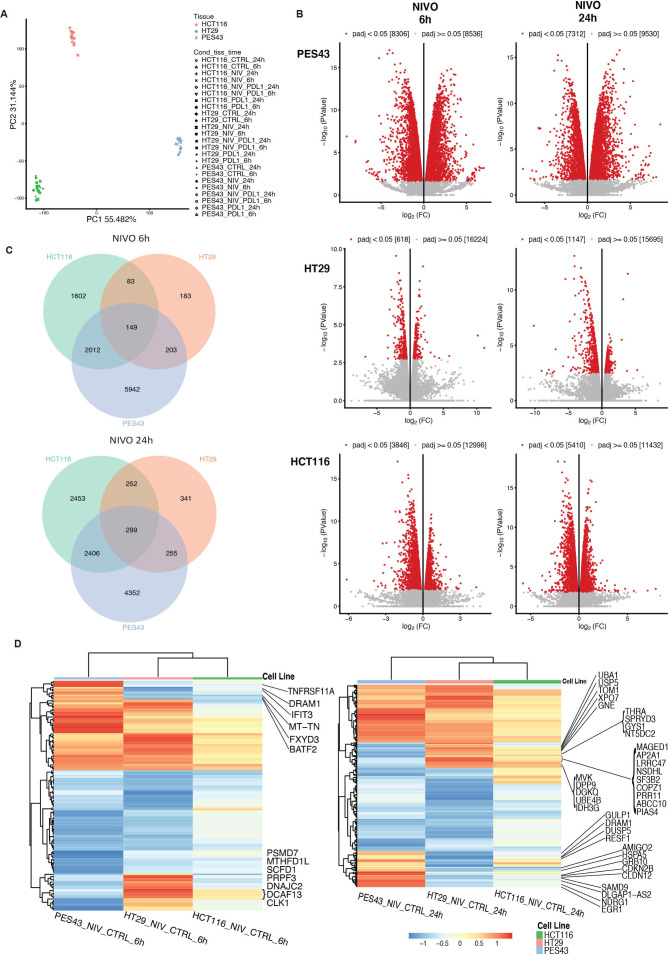
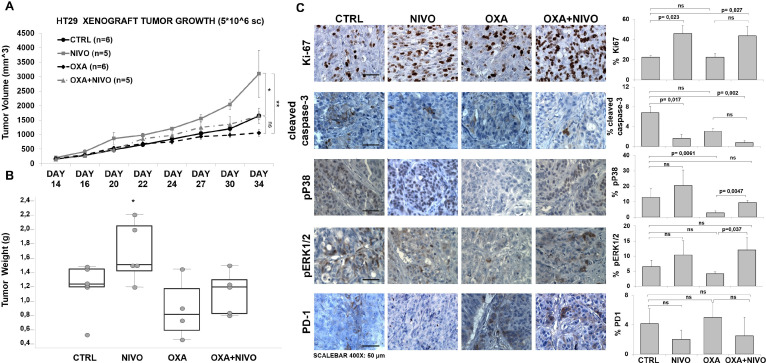
Methods: In vitro NIVO-treated human colon cancer cells (HT29, HCT116, and LoVo) were evaluated for cell growth, chemo/radiotherapeutic sensitivity, apoptosis, and spheroid growth. Total RNA-seq was assessed in 6-24 hours NIVO-treated human colon cancer cells HT29 and HCT116 as compared with NIVO-treated PES43 human melanoma cells. In vivo mice carrying HT29 xenograft were intraperitoneally treated with NIVO, OXA (oxaliplatin), and NIVO+OXA, and the tumors were characterized for growth, apoptosis, and pERK1/2/pP38. Forty-eight human primary colon cancers were evaluated for PD-1 expression through immunohistochemistry.

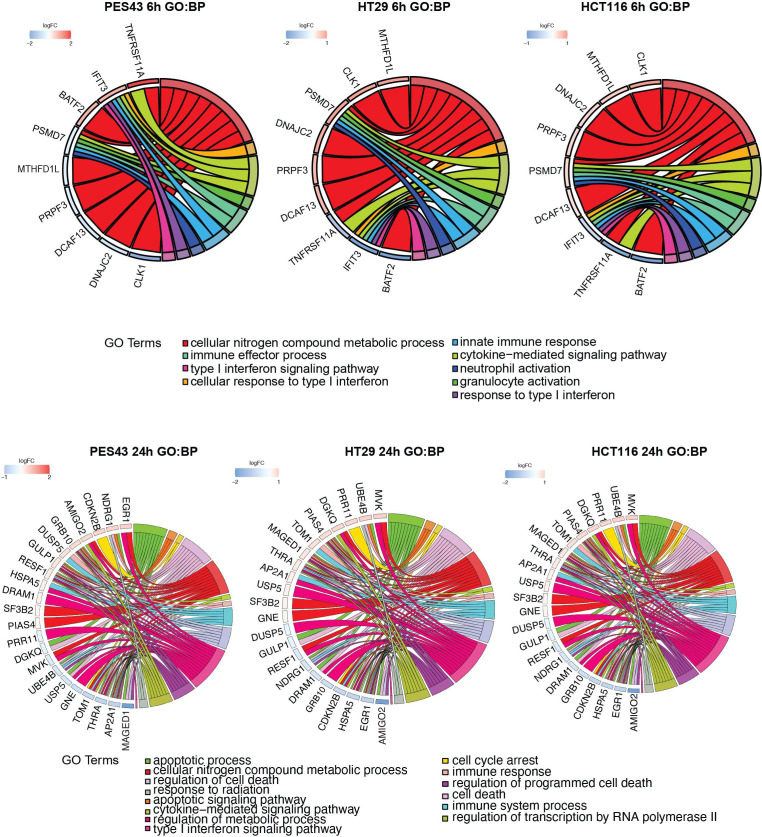
Results: In PD-1+ human colon cancer cells, intrinsic PD-1 signaling significantly decreased proliferation and promoted apoptosis. On the contrary, NIVO promoted proliferation, reduced apoptosis, and protected PD-1+ cells from chemo/radiotherapy. Transcriptional profile of NIVO-treated HT29 and HCT116 human colon cancer cells revealed downregulation of BATF2, DRAM1, FXYD3, IFIT3, MT-TN, and TNFRSF11A, and upregulation of CLK1, DCAF13, DNAJC2, MTHFD1L, PRPF3, PSMD7, and SCFD1; the opposite regulation was described in NIVO-treated human melanoma PES43 cells. Differentially expressed genes (DEGs) were significantly enriched for interferon pathway, innate immune, cytokine-mediated signaling pathways. In vivo, NIVO promoted HT29 tumor growth, thus reducing OXA efficacy as revealed through significant Ki-67 increase, pERK1/2 and pP38 increase, and apoptotic cell reduction. Eleven out of 48 primary human colon cancer biopsies expressed PD-1 (22.9%). PD-1 expression is significantly associated with lower pT stage.

Conclusions: In PD-1+ human colon cancer cells, NIVO activates tumor survival pathways and could protect tumor cells from conventional therapies.

Keywords: gastrointestinal neoplasms; programmed cell death 1 receptor.


Conflict of interest statement

Competing interests: None declared.

Figures

Figure 1
Figure 1
Human colon cancer cells express functional PD-1 that is not regulated by IFN-α/γ. PD-1 blockade increases human colon cancer cell growth. (A) Percentages (mean±SD) of PD-1 and PD-L1 surface protein expression on five colon cancer cells (HT29, HCT116, LoVo, SW620, Colo205), as determined by flow cytometry. Bar charts show combined results from at least three independent experiments. PES43 (human melanoma cancer cell line) and MOLT4 (human T-cell acute lymphocytic leukemia cell line) were used as PD-1 positive control and 8505C (human anaplastic thyroid cancer cell line) was used as PD-L1 positive control. *P value <0.05; **p value <0.01; ***p value <0.001. Student’s t-test was used. (B) Histograms represent changes in (i) % fluorescence intensity by flow cytometry (mean±SD) and (ii) mRNA expression indicated as 2∆Ct for PD-1 and PD-L1 in HT29, HCT116, and LoVo cells treated with IFN-γ (50 IU/mL) for 48 hours and IFN-α (3000 IU/mL) for 24 hours. Bar graphs represent the average of at least three experiments. P value >0.05 ns (not significant); *p value <0.05. Student’s t-test was used. (C) HT29, HCT116, and LoVo cells were treated with sPD-L1 (1 µg/mL) or sPD-L1 +NIVO (10 µM) for 24 hours. Cell apoptosis rates were detected through Annexin V and propidium iodide (PI) dual staining method. Relative fold change of apoptotic cells is shown in the histogram (mean±SD). Bar graphs represent the average of two experiments. P value >0.05 ns; *p value <0.05. Student’s t-test was used. (D) HT29, HCT116, and LoVo growth curves following NIVO (10 µM), sPD-L1 (1 µg/mL), or combination sPD-L1 +NIVO treatment for 24, 48, and 72 hours. All data are representative of at least two experiments. P value >0.05 ns; *p value <0.05; **p value<0.01; ***p value <0.001. Student’s t-test was used. (E) Immunoblot analysis (representative of n=2 independent experiments) of phosphorylated (p) and total ERK1/2 and P38 in HT29, HCT116, and PES43 cell lines treated with NIVO (10 µM) for 15 min, 6–18 hours. The numbers above the gel lanes represent the relative protein level, which was determined from the band intensity using ImageJ software, and normalized relative to the total protein. IFN, interferon; NIVO, nivolumab; sPD-L1, soluble PD-L1.
Figure 2
Figure 2
PD-1 blockade reduces the effect of chemo/radiotherapy on human colon cancer cells. (A) HT29, HCT116, and LoVo cells were treated with NIVO (1 µM), OXA (40 µM), 5-FU (50 µM), or NIVO +5-FU/OXA for 24 hours. Annexin V/PI analysis was performed. Bar graphs represent relative fold change of apoptotic cells obtained from at least two independent experiments±SD. P value >0.05 ns (not significant); *p value <0.05; **p value <0.01; ***p value <0.001. (B) (i) HT29 and HCT116 cells were exposed to 2–4–8 Gy plus/minus NIVO (1–10 µM) for 1 week. Survival curves for radiation plus NIVO treatment in HT29 and HCT116 cells. Data represent means obtained from two experiments±SD. P value >0.05 ns; *p value <0.05; ***p value <0.001. Student’s t-test was used. (ii) Representative images of a colony formation assay (left) and quantification data (right) for HT29 and HCT116 cells treated with NIVO (1 µM) and F(ab)2 (1μM). Data are representative of two experiments±SD. *P value <0.05; **p value <0.01. Student’s t test was used. (C) Spheroids growth of HT29, HCT116, and SW620 72 hours treated with OXA (10 µM), NIVO (10 µM), and combination. Images were obtained at optical inverted microscope (using ×10 objective) (Zeiss, Germany) on day 3. Spheroid images were typically analyzed with ImageJ software. Grouped dot plot express spheroid area (mean±SD). For each data point, at least nine spheroids were analyzed. Data are representative of three experiments±SD. 5-FU, 5-fluoruracil; NIVO, nivolumab; OXA, oxaliplatin; PI, propidium iodide.
Figure 3
Figure 3
Differentially expressed genes (DEGs) in NIVO-treated human colon cancer and melanoma cells. (A) Principal component (PC) analysis was performed for the samples using the gene expression values. Clustering of HCT116 cells (red dots), HT29 cells (green dots), and PES43 cells (blue dots) treated with PBS, NIVO (10 µM), sPD-L1 (1 µg/mL), and NIVO +sPD-L1. (B) Volcano plots of genes differentially expressed in NIVO-treated PES43, HT29, and HCT116 for 6 hours (upper panel) and 24 hours (lower panel) in pairwise comparisons versus untreated cells. The log2 fold change difference is represented on the x-axis and –log10 of corrective p value (q-value) is represented on the y-axis. Each point represents a gene. Red points indicate genes called as differentially expressed (DE) at adjusted p value (adjP) ≤0.05. (C) Comparison of the DEGs on HCT116, HT29, and PES43 cells on stimulation with NIVO for 6 hours (left panel) and 24 hours (right panel) using Venn diagrams. (D) Heat maps of genes differentially expressed in NIVO-treated PES43, HT29, and HCT116 for 6 hours (left panel) and 24 hours (right panel). NIVO, nivolumab; sPD-L1, soluble PD-L1.
Figure 4
Figure 4
GO functional enrichment analysis of differentially expressed genes (DEGs) in NIVO-treated human colon cancer and melanoma cells. GO Chord plot of selected common genes differentially expressed in the PES43, HCT116, and HT29 cells treated with NIVO for 6 hours (upper panel) or for 24 hours (lower panel). The genes are linked to their assigned pathway via colored ribbons. Genes are ordered according to the observed log2 fold change (LogFC), which is displayed in descending intensity next to the selected genes from red (higher expression during NIVO treatment) to blue (lower expression during NIVO treatment). NIVO, nivolumab.
Figure 5
Figure 5
PD-1 blockade accelerated the growth of subcutaneous HT29 tumors and decreased efficacy of chemotherapy. Tumor growth curve (caliper tumor volumes±SEM) (A) and tumor weight (grams) (B) of HT29 tumor subcutaneously implanted in CD1 athymic mice treated as indicated. (C) Immunohistochemistry (IHC) for Ki67, cleaved caspase-3, pP38, pERK1/2, PD-1. Representative microphotographs (left) show localization of selected markers. The scale bars at the bottom of the figure indicate 50 µm for ×400 magnification. P value <0.05 was considered statistically significant for Kruskal-Wallis test followed by Dunn’s multiple comparison. Bar graph (right) illustrates quantification of immunohistochemistry staining from collected tumors (means±SD). NIVO, nivolumab; OXA, oxaliplatin; PD-1, programmed cell death-1.

Similar articles

Cited by

References

    1. Siegel RL, Miller KD, Goding Sauer A, et al. . Colorectal cancer statistics, 2020. CA Cancer J Clin 2020;70:145–64. 10.3322/caac.21601 - DOI - PubMed
    1. Rawla P, Sunkara T, Barsouk A. Epidemiology of colorectal cancer: incidence, mortality, survival, and risk factors. Prz Gastroenterol 2019;14:89–103. 10.5114/pg.2018.81072 - DOI - PMC - PubMed
    1. Adam R, de Gramont A, Figueras J, et al. . Managing synchronous liver metastases from colorectal cancer: a multidisciplinary international consensus. Cancer Treat Rev 2015;41:729–41. 10.1016/j.ctrv.2015.06.006 - DOI - PubMed
    1. Valderrama-Treviño AI, Barrera-Mera B, Ceballos-Villalva JC, et al. . Hepatic metastasis from colorectal cancer. Euroasian J Hepatogastroenterol 2017;7:166–75. 10.5005/jp-journals-10018-1241 - DOI - PMC - PubMed
    1. Galon J, Costes A, Sanchez-Cabo F, et al. . Type, density, and location of immune cells within human colorectal tumors predict clinical outcome. Science 2006;313:1960–4. 10.1126/science.1129139 - DOI - PubMed

Publication types