. 2022 Mar 4;13(3):206.
doi: 10.1038/s41419-022-04632-z.

Zeb1-induced metabolic reprogramming of glycolysis is essential for macrophage polarization in breast cancer

Affiliations

Zeb1-induced metabolic reprogramming of glycolysis is essential for macrophage polarization in breast cancer

Huimin Jiang et al. Cell Death Dis. .

Abstract

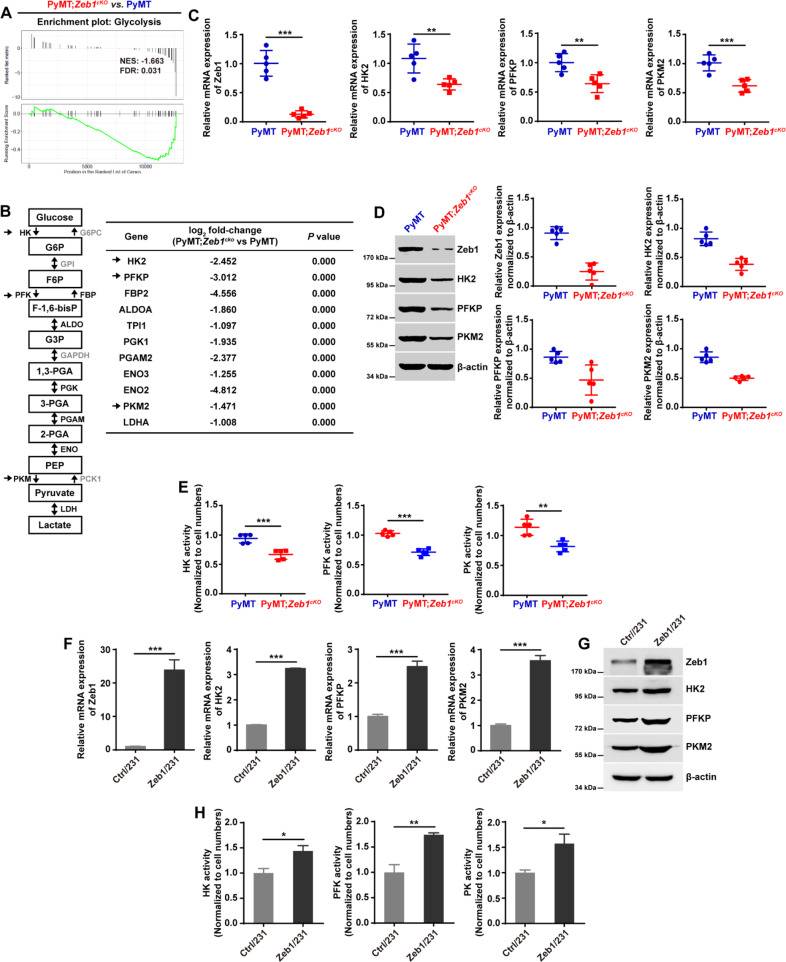
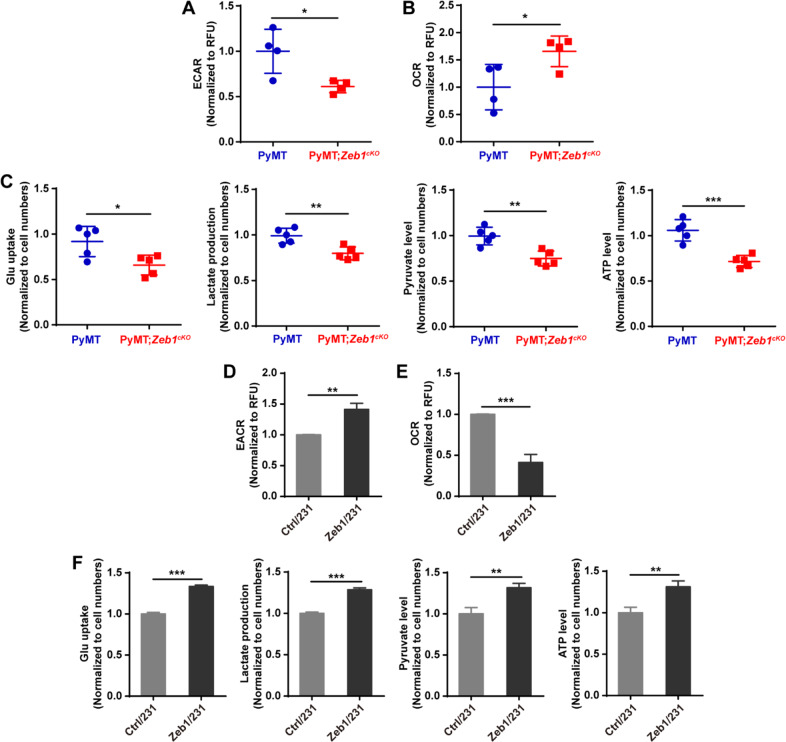
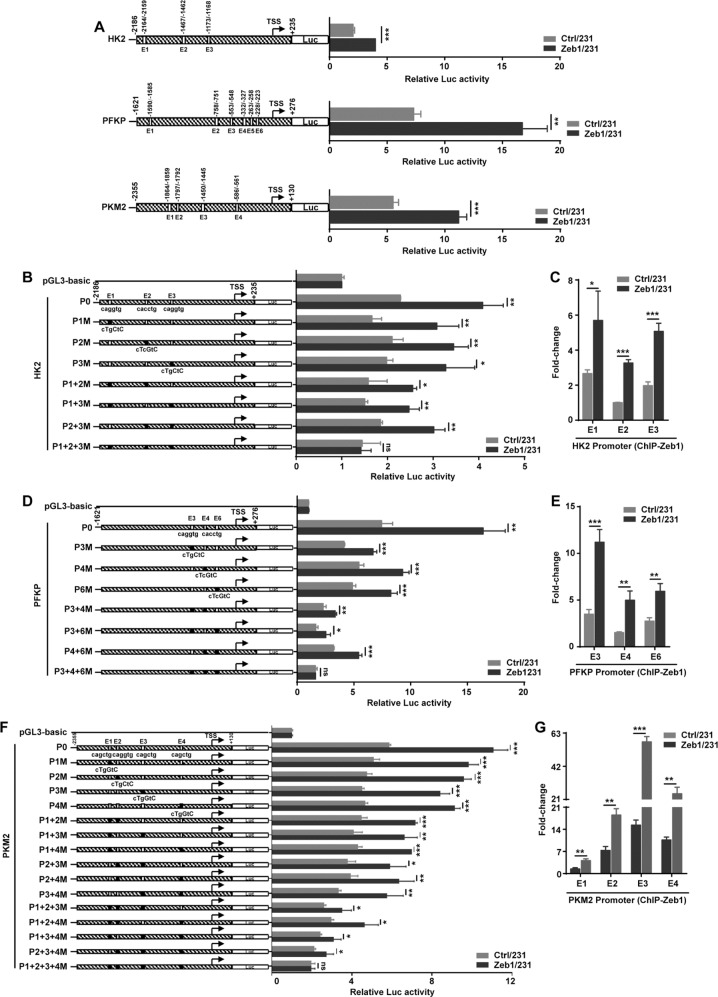
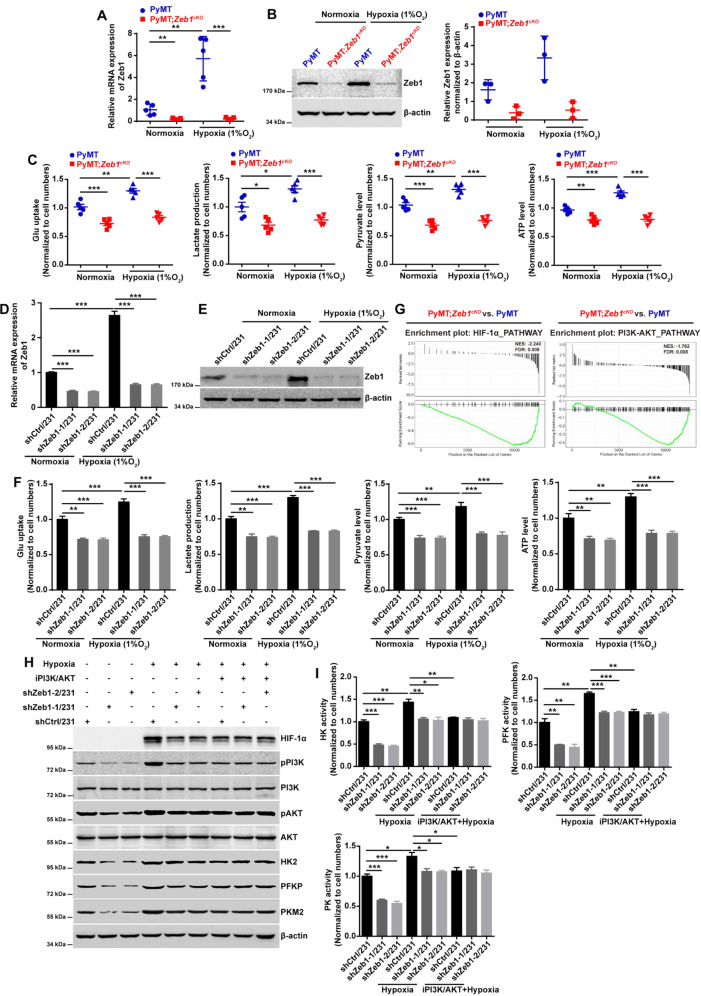
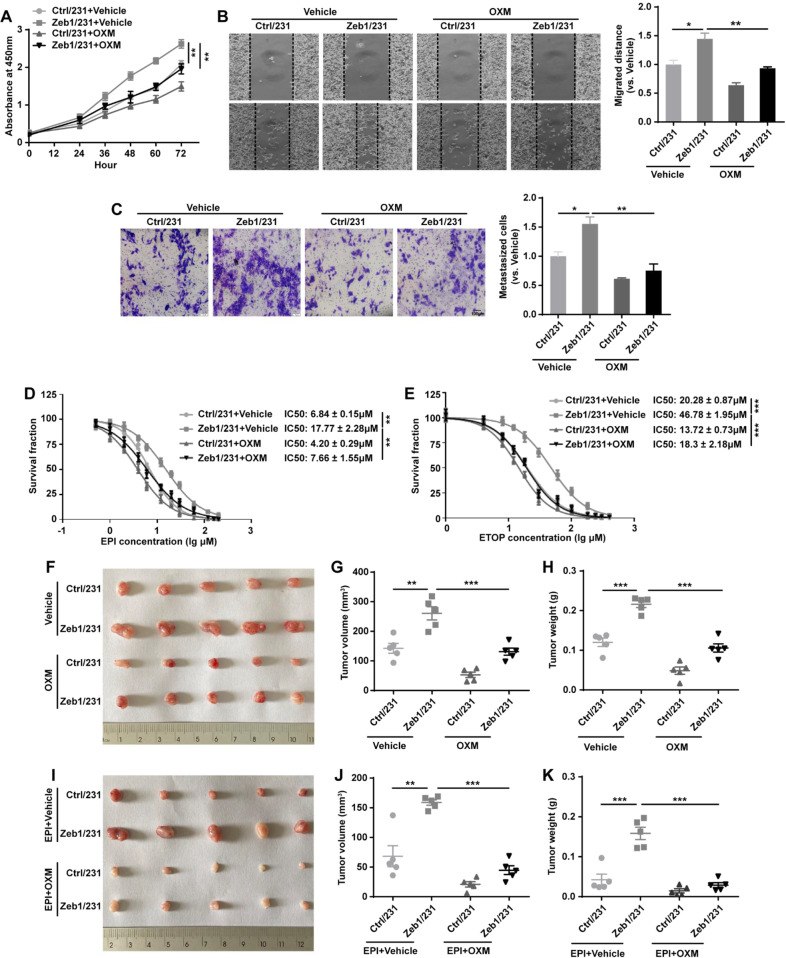
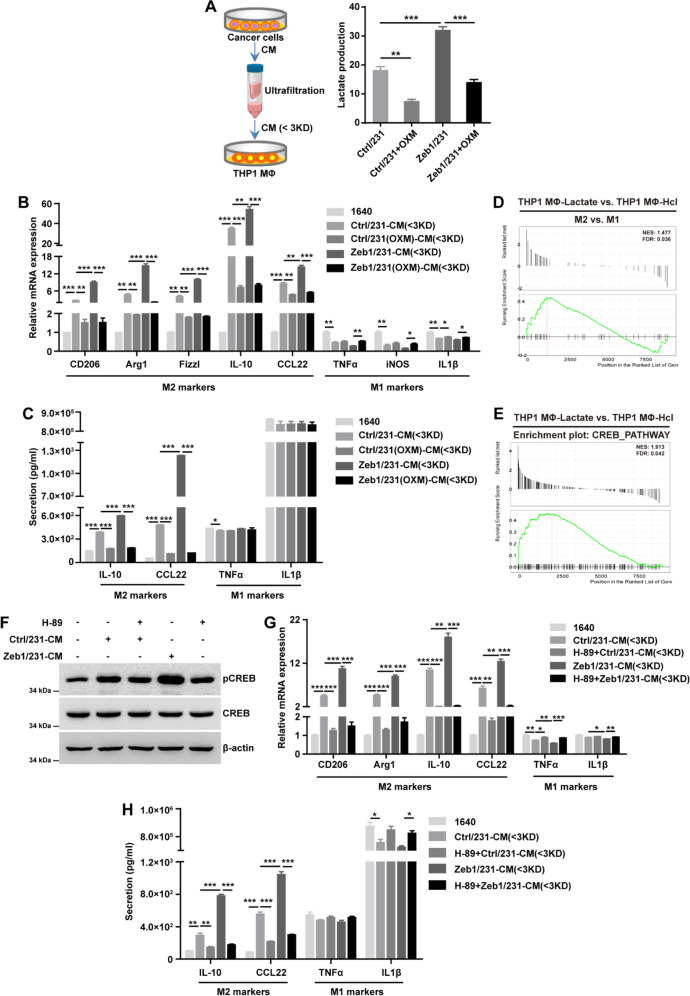
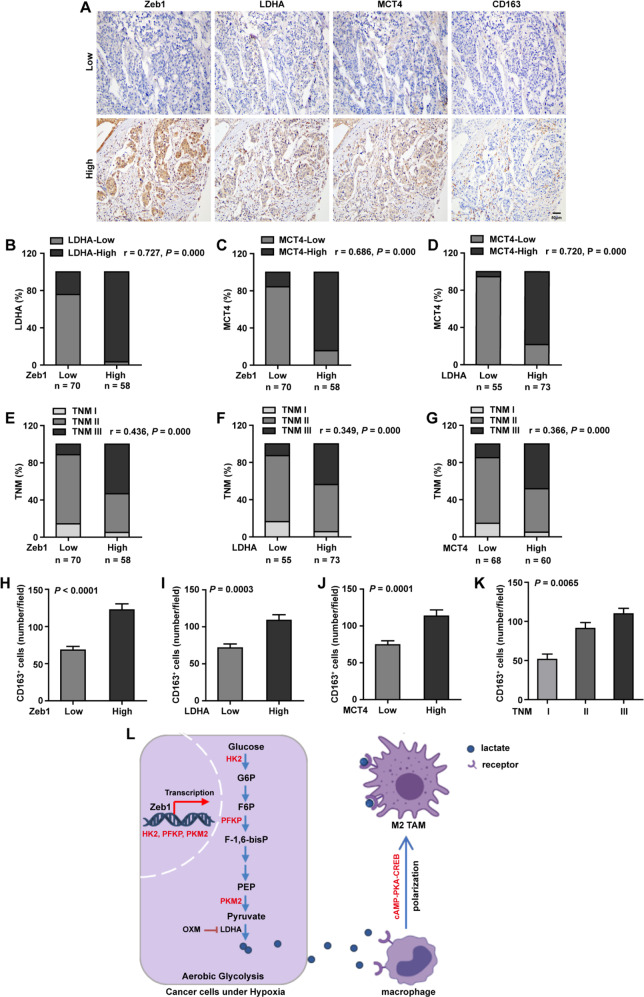
Aerobic glycolysis (the Warburg effect) has been demonstrated to facilitate tumor progression by producing lactate, which has important roles as a proinflammatory and immunosuppressive mediator. However, how aerobic glycolysis is directly regulated is largely unknown. Here, we show that ectopic Zeb1 directly increases the transcriptional expression of HK2, PFKP, and PKM2, which are glycolytic rate-determining enzymes, thus promoting the Warburg effect and breast cancer proliferation, migration, and chemoresistance in vitro and in vivo. In addition, Zeb1 exerts its biological effects to induce glycolytic activity in response to hypoxia via the PI3K/Akt/HIF-1α signaling axis, which contributes to fostering an immunosuppressive tumor microenvironment (TME). Mechanistically, breast cancer cells with ectopic Zeb1 expression produce lactate in the acidic tumor milieu to induce the alternatively activated (M2) macrophage phenotype through stimulation of the PKA/CREB signaling pathway. Clinically, the expression of Zeb1 is positively correlated with dysregulation of aerobic glycolysis, accumulation of M2-like tumor-associated macrophages (TAMs) and a poor prognosis in breast cancer patients. In conclusion, these findings identify a Zeb1-dependent mechanism as a driver of breast cancer progression that acts by stimulating tumor-macrophage interplay, which could be a viable therapeutic target for the treatment of advanced human cancers.


Conflict of interest statement

The authors declare no competing interests.

Figures

Fig. 1
Fig. 1. Zeb1 is a key regulator of glycolytic gene expression.
A GSEA of transcriptome data from PyMT;Zeb1cKO vs PyMT cells revealing enrichment of a gene signature associated with reduced glycolysis in PyMT;Zeb1cKO breast cancer cells. NES, normalized enrichment score; FDR, false discovery rate. B Differential expression of glycolytic genes identified by RNA-sequencing. C, D The relative (C) mRNA and (D) protein levels of Zeb1, HK2, PFKP, and PKM2 in PyMT and PyMT;Zeb1cKO cells (n = 5). E The enzyme activities of HK, PFK, and PKM in PyMT and PyMT;Zeb1cKO cells (n = 5). F, G The relative (F) mRNA and (G) protein levels of HK2, PFKP, and PKM2 in empty vector-expressing (Ctrl/231) and Zeb1-expressing (Zeb1/231) MDA-MB-231 cells. H The enzyme activities of HK, PFK, and PKM in Ctrl/231 and Zeb1/231 cells. Dots depict individual samples in (CE). Data are representative of five (CE) or three (FH) independent experiments and presented as mean ± SEM. *P < 0.05, **P < 0.01, ***P < 0.001 vs the respective control by an unpaired Student’s t-test.
Fig. 2
Fig. 2. Ectopic Zeb1 induces aerobic glycolysis.
A, B The alternations in (A) ECAR and (B) OCR in PyMT and PyMT;Zeb1cKO cells (n = 5). C The alternations in glucose uptake, pyruvate level, lactate production, and ATP level in PyMT and PyMT;Zeb1cKO cells (n = 5). D, E The alternations in (D) ECAR and (E) OCR in Ctrl/231 and Zeb1/231 cells. F The alternations in glucose uptake, pyruvate level, lactate production, and ATP level in Ctrl/231 and Zeb1/231 cells. Dots depict individual samples in (AC). Data are representative of five (AC) or three (DF) independent experiments and presented as mean ± SEM. *P < 0.05, **P < 0.01, ***P < 0.001 vs the respective control by an unpaired Student’s t-test.
Fig. 3
Fig. 3. Zeb1 regulates glycolytic gene transcription.
A Luciferase assay for the wild-type promoters of HK2 (−2186/+235), PKFP (−1621/+276) and PKM2 (−2355/+130) in Ctrl/231 and Zeb1/231 cells. B Luciferase assay for the E2-box-mutated promoters of HK2 in Ctrl/231 and Zeb1/231 cells. C ChIP assay for recruitment of Zeb1 to the endogenous HK2 promoter in Ctrl/231 and Zeb1/231 cells. D Luciferase assay for the E2-box-mutated promoters of PFKP in Ctrl/231 and Zeb1/231 cells. E ChIP assay for recruitment of Zeb1 to the endogenous PFKP promoter in Ctrl/231 and Zeb1/231 cells. F Luciferase assay for the E2-box-mutated promoters of PKM2 in Ctrl/231 and Zeb1/231 cells. G ChIP assay for recruitment of Zeb1 to the endogenous PKM2 promoter in Ctrl/231 and Zeb1/231 cells. Data are representative of three independent experiments and presented as mean ± SEM. *P < 0.05, **P < 0.01, ***P < 0.001 vs the respective control by an unpaired Student’s t-test.
Fig. 4
Fig. 4. Zeb1 regulates aerobic glycolysis under hypoxia.
A, B The relative (A) mRNA and (B) protein levels of Zeb1 in PyMT and PyMT;Zeb1cKO cells under normoxic and hypoxic conditions. C The alternations in glucose uptake, pyruvate level, lactate production, and ATP level in PyMT and PyMT;Zeb1cKO cells under normoxic and hypoxic conditions. D, E The relative (D) mRNA and (E) protein levels of Zeb1 in scramble shRNA-transfected (shCtrl/231) and Zeb1-specific shRNA-transfected (shZeb1/231) MDA-MB-231 cells under normoxic and hypoxic conditions. F The alternations in glucose uptake, pyruvate level, lactate production, and ATP level in shCtrl/231 and shZeb1/231 cells under normoxic and hypoxic conditions. G GSEA for transcriptome data from PyMT;Zeb1cKO vs PyMT cells revealing enrichment of a gene signature associated with reduced HIF-1α and PI3K-Akt signaling pathway activities in PyMT;Zeb1cKO breast cancer cells. NES, normalized enrichment score; FDR, false discovery rate. H The protein levels of HIF-1α, HK2, PFKP, and PKM2 in shCtr//231 and shZeb1/231 cells under normoxic and hypoxic conditions in response to a PI3K/Akt inhibitor LY294002. I The enzyme activities of HK, PFK, and PKM in shCtrl/231 and shZeb1/231 cells under normoxic and hypoxic conditions in response to LY294002. Dots depict individual samples in (AC). Data are representative of five (A, C) or three (B, DF, H, I) independent experiments and presented as mean ± SEM. *P < 0.05, **P < 0.01, ***P < 0.001 vs the respective control by an unpaired Student’s t-test.
Fig. 5
Fig. 5. Zeb1-induced aerobic glycolysis contributes to breast cancer progression.
A The cell viability of Ctrl/231 and Zeb1/231 cells by treatment with OXM. B, C The cell migration of Ctrl/231 and Zeb1/231 cells by treatment with OXM evaluated by (B) wound-healing and (C) transwell assays. D, E The cell viability of Ctrl/231 and Zeb1/231 cells by treatment with (D) EPI or (E) ETOP in the presence of OXM. F In vivo xenograft tumorigenicity of BALB/c mice injected with Ctrl/231 and Zeb1/231 cells by treatment with OXM. G, H Approximate tumor (G) volume and (H) weight of BALB/c mice injected with Ctrl/231 and Zeb1/231 cells by treatment with OXM. I In vivo xenograft tumorigenicity of BALB/c mice injected with Ctrl/231 and Zeb1/231 cells by treatment with EPI and/or OXM. J, K Approximate tumor (J) volume and (K) weight of BALB/c mice injected with Ctrl/231 and Zeb1/231 cells by treatment with EPI and/or OXM. Data are representative of five (FK) or three (AE) independent experiments and presented as mean ± SEM; **P < 0.01, ***P < 0.001 vs the respective control by one-way ANOVA followed by Tukey’s honestly significant difference test in (A) and (D, E). *P < 0.05, **P < 0.01, ***P < 0.001 vs the respective control by an unpaired Student’s t-test in (B, C, G, H, J, K).
Fig. 6
Fig. 6. Zeb1-induced lactate production contributes to M2 TAM polarization.
A Lactate concentration in fractionated CM from Ctrl/231 and Zeb1/231 cells treated with OXM. B, C The relative (B) mRNA and (C) protein levels of M1 and M2 macrophage markers in THP1 MΦ treated with fractionated CM from Ctrl/231 and Zeb1/231 cells in the presence of OXM. D, E GSEA of transcriptome data from THP1 MФ-lactate vs THP1 MФ-HCl cells revealing enrichment of a gene signature associated with increased (D) M2 TAM phenotypes and (E) CREB signaling pathway activity in THP1 MФ-lactate cells. NES, normalized enrichment score; FDR, false discovery rate. F The protein levels of phospho-CREB and total CREB in THP1 MΦ treated with fractionated CM from Ctrl/231 and Zeb1/231 cells in the presence of a PKA inhibitor H89. G, H The relative (G) mRNA and (H) protein levels of M1 and M2 macrophage markers in THP1 MΦ treated with fractionated CM from Ctrl/231 and Zeb1/231 cells in the presence of H89. Data are representative of three (AC, FH) independent experiments and presented as mean ± SEM. *P < 0.05, **P < 0.01, ***P < 0.001 vs the respective control by an unpaired Student’s t-test.
Fig. 7
Fig. 7. Zeb1 is positively correlated with aerobic glycolysis in human breast cancer.
A Representative images of immunohistochemical staining for Zeb1, LDHA, MCT4, and CD163 in serial sections of the same tumor from two patients. Scale bars, 50 μm. B A positive correlation between the expression of Zeb1 and LDHA in 128 human breast cancer samples. r = 0.727, P = 0.000 by Spearman’s rank correction test. C A positive correlation between the expression of Zeb1 and MCT4 in human breast cancer samples. r = 0.686, P = 0.000 by Spearman’s rank correction test. D A positive correlation between the expression of LDHA and MCT4 in human breast cancer samples. r = 0.720, P = 0.000 by Spearman’s rank correction test. E A positive correlation between the expression of Zeb1 and TNM stages in 128 human breast cancer samples. r = 0.436, P = 0.000 by Spearman’s rank correction test. F A positive correlation between the expression of Zeb1 and TNM stages in human breast cancer samples. r = 0.349, P = 0.000 by Spearman’s rank correction test. G A positive correlation between the expression of LDHA and TNM stages in human breast cancer samples. r = 0.366, P = 0.000 by Spearman’s rank correction test. H A positive correlation between the expression of Zeb1 and CD163 in human breast cancer samples. P < 0.0001 by an unpaired Student’s t-test. I A positive correlation between the expression of LDHA and CD163 in human breast cancer samples. P = 0.0003 by an unpaired Student’s t-test. J A positive correlation between the expression of MCT4 and CD163 in human breast cancer samples. P = 0.0001 by an unpaired Student’s t-test. K A positive correlation between the expression of CD163 and TNM stages in human breast cancer samples. P = 0.0065 by one-way analysis of variance. L A working model illustrating that Zeb1-induced metabolic reprogramming of glycolysis regulates M2 TAM polarization in breast cancer.

Similar articles

Cited by

References

    1. Hanahan D, Weinberg RA. Hallmarks of cancer: the next generation. Cell. 2011;144:646–74. doi: 10.1016/j.cell.2011.02.013. - DOI - PubMed
    1. Koppenol WH, Bounds PL, Dang CV. Otto Warburg’s contributions to current concepts of cancer metabolism. Nat Rev Cancer. 2011;11:325–37. - PubMed
    1. Pavlova NN, Thompson CB. The emerging hallmarks of cancer metabolism. Cell Metab. 2016;23:27–47. - PMC - PubMed
    1. Vander Heiden MG, Cantley LC, Thompson CB. Understanding the Warburg effect: the metabolic requirements of cell proliferation. Science. 2009;324:1029–33. - PMC - PubMed
    1. Liberti MV, Locasale JW. The Warburg effect: how does it benefit cancer cells? Trends Biochem Sci. 2016;41:211–218. - PMC - PubMed

Publication types

MeSH terms