. 2022 Mar 4;13(1):1169.
doi: 10.1038/s41467-022-28785-9.

Endothelial Unc5B controls blood-brain barrier integrity

Affiliations

Endothelial Unc5B controls blood-brain barrier integrity

Kevin Boyé et al. Nat Commun. .

Abstract

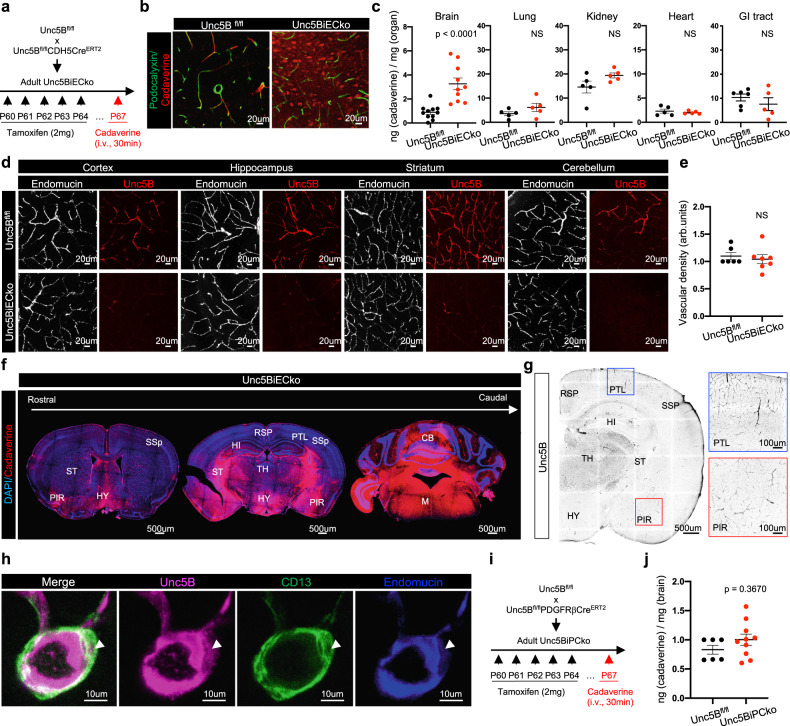
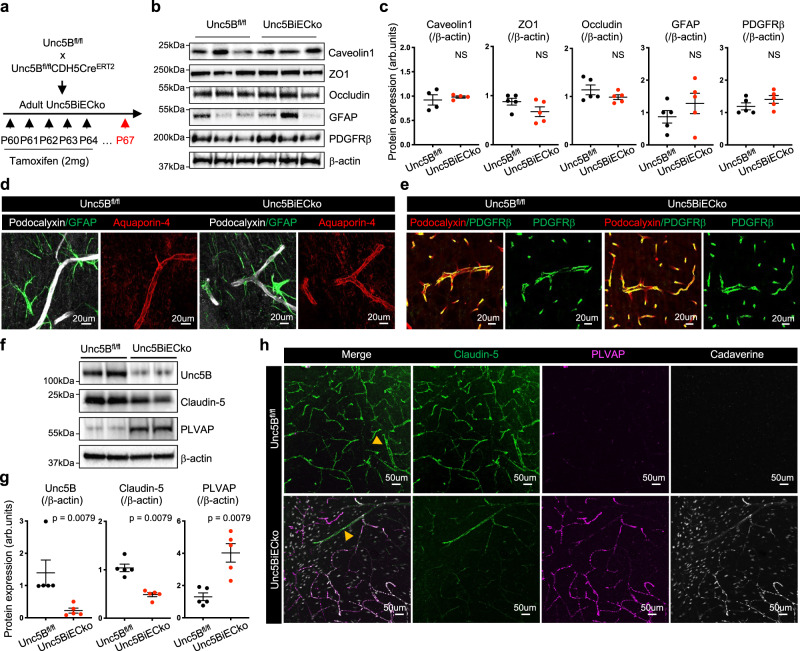
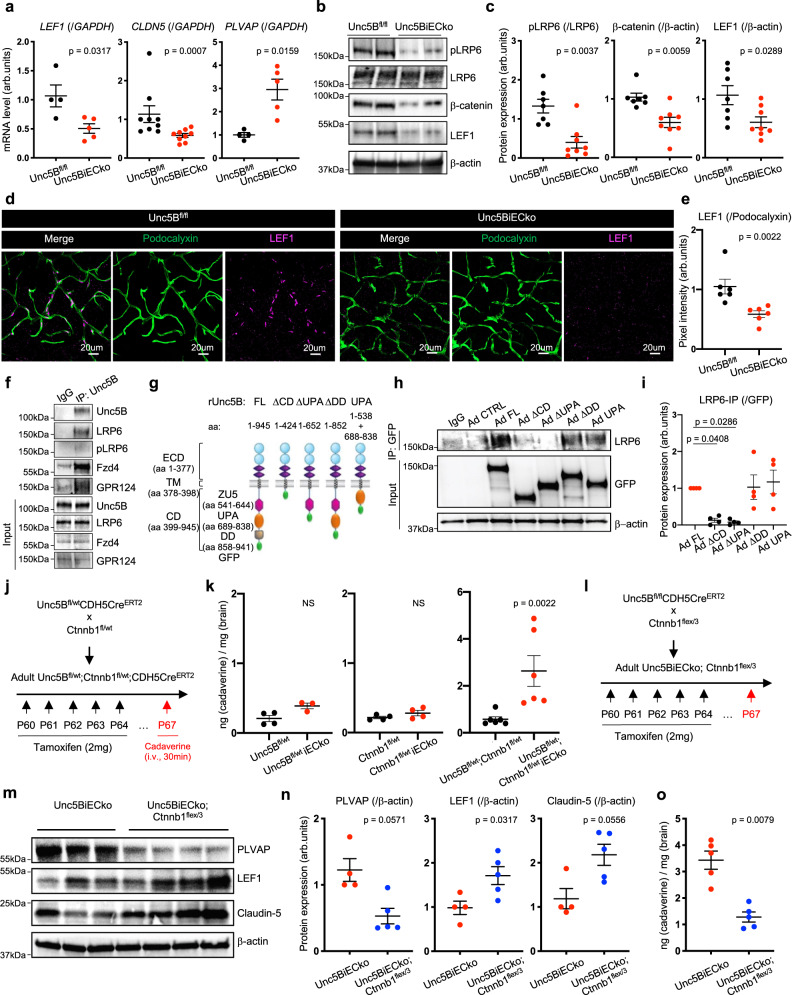
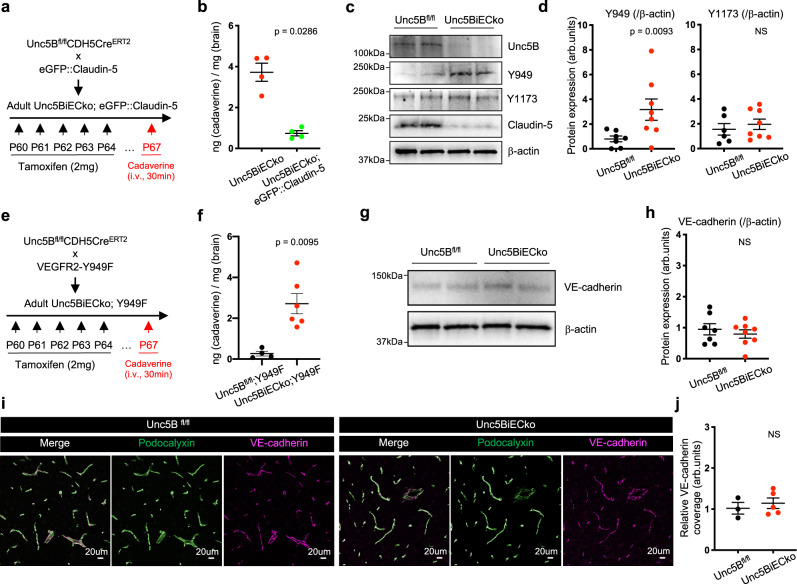
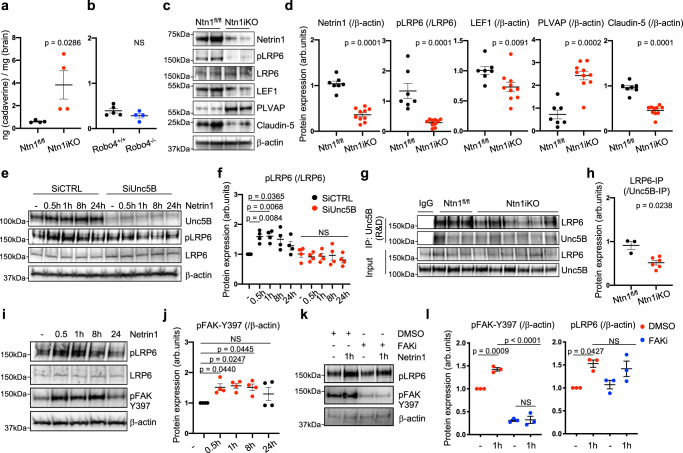
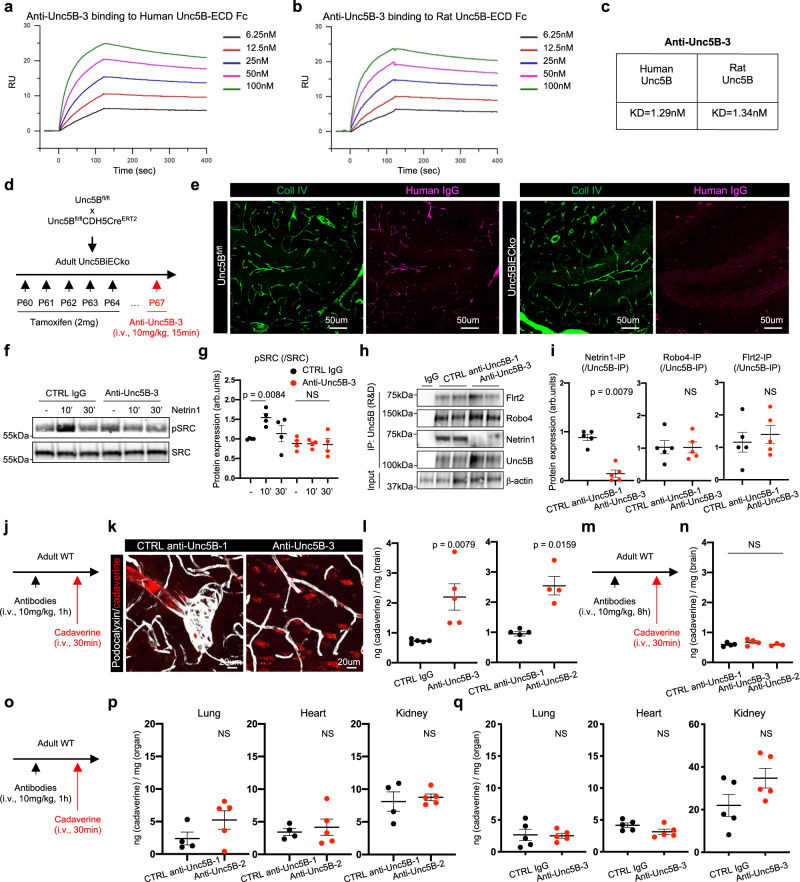
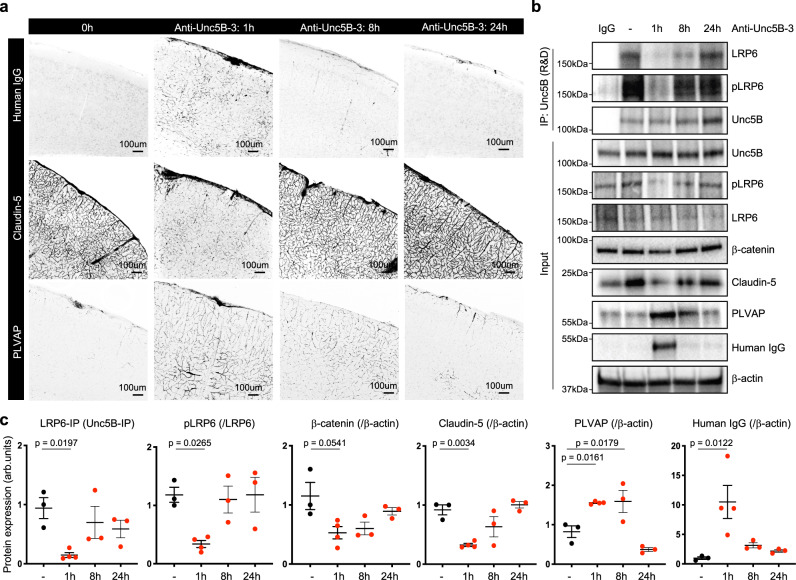
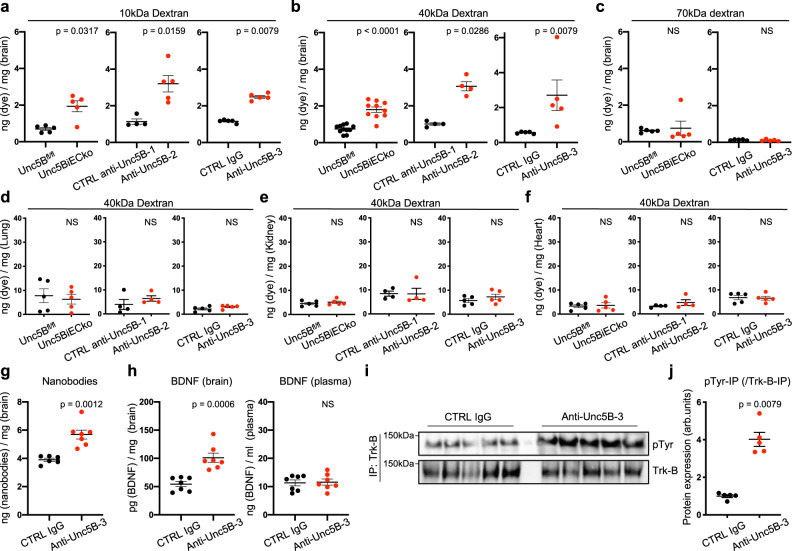
Blood-brain barrier (BBB) integrity is critical for proper function of the central nervous system (CNS). Here, we show that the endothelial Unc5B receptor controls BBB integrity by maintaining Wnt/β-catenin signaling. Inducible endothelial-specific deletion of Unc5B in adult mice leads to BBB leak from brain capillaries that convert to a barrier-incompetent state with reduced Claudin-5 and increased PLVAP expression. Loss of Unc5B decreases BBB Wnt/β-catenin signaling, and β-catenin overexpression rescues Unc5B mutant BBB defects. Mechanistically, the Unc5B ligand Netrin-1 enhances Unc5B interaction with the Wnt co-receptor LRP6, induces its phosphorylation and activates Wnt/β-catenin downstream signaling. Intravenous delivery of antibodies blocking Netrin-1 binding to Unc5B causes a transient BBB breakdown and disruption of Wnt signaling, followed by neurovascular barrier resealing. These data identify Netrin-1-Unc5B signaling as a ligand-receptor pathway that regulates BBB integrity, with implications for CNS diseases.


Conflict of interest statement

A.E., K.B., L.G. and L.P-F. are inventors on patent applications that cover the generation of Unc5B blocking antibodies, and their application. The remaining authors declare no competing interests.

Figures

Fig. 1
Fig. 1. Endothelial Unc5B controls BBB integrity.
a Unc5B gene deletion strategy using tamoxifen injection in adult mice. b Immunofluorescence staining with the indicated antibodies and confocal imaging of adult brain sections at P67, 30 min after i.v cadaverine injection and reproduced on n = 4 Unc5Bfl/fl and n = 5 Unc5BiECko brains. c Quantification of dye content in brains and peripheral organs at P67, 30 min after i.v. cadaverine injection, n = 11 Unc5Bfl/fl and n = 10 Unc5BiECko brains (exact p-value = 0.0000397); n = 5 Unc5Bfl/fl and n = 10 Unc5BiECko lungs, kidneys and hearts; n = 6 Unc5Bfl/fl and n = 5 Unc5BiECko GI tracts. Each dot represents one mouse. d Immunofluorescence staining with the indicated antibodies and confocal imaging of adult brain sections, reproduced on n = 4 Unc5Bfl/fl and n = 4 Unc5BiECko brains. e Quantification of endomucin+ vascular density. Each dot represents the mean of several images, n = 6 Unc5Bfl/fl and n = 7 Unc5BiECko brains. One control mouse value was set as 1. f Tile-scan confocal imaging of adult Unc5BiECko brain sections at P67, 30 min after i.v cadaverine injection and reproduced on n = 3 Unc5Bfl/fl and n = 3 Unc5BiECko brains. g Immunofluorescence staining of Unc5B and tile-scan confocal imaging of brain sections, reproduced on n = 4 mice. Boxes show higher magnifications of cortical areas. h Immunofluorescence staining with the indicated antibodies and confocal imaging of adult brain sections, reproduced on n = 4 Unc5Bfl/fl and n = 4 Unc5BiECko brains. Arrowhead: Unc5B+/CD13+ pericyte. i, j Unc5Bfl/fl was crossed with PDGFRβCreERT2 and BBB permeability was assessed at P67, 30 min after i.v. cadaverine injection, n = 6 Unc5Bfl/fl and n = 10 Unc5BiPCko brains. Each dot represents one mouse. All data are shown as mean ± SEM. NS non-significant, RSP Retrosplenial cortex, PTL Posterior parietal association areas, SSp Primary somatosensory cortex, PIR Piriform cortex, HI Hippocampus, HY Hypothalamus, TH Thalamus, ST Striatum, CB Cerebellum, M Medulla. Two-sided Mann–Whitney U test was performed for statistical analysis. Source data are provided as a Source Data file.
Fig. 2
Fig. 2. Unc5B controls Claudin-5 and PLVAP expression.
a Unc5B gene deletion strategy using tamoxifen injection in adult mice. Western blot (b) and quantification (c) of brain protein extracts at P67. Quantification of Caveolin-1 expression was performed on n = 4 Unc5Bfl/fl and n = 4 Unc5BiECko brains. Quantification of ZO1, Occludin, GFAP and PDGFRβ expression was performed on n = 5 Unc5Bfl/fl and n = 5 Unc5BiECko brains. Each dot represents one mouse. One control mouse was set as 1. d, e Immunofluorescence staining with the indicated markers and confocal imaging of brain sections, reproduced on n = 4 Unc5Bfl/fl and n = 4 Unc5BiECko brains. Western blot (f) and quantification (g) of P67 brain protein extracts, n = 5 Unc5Bfl/fl and n = 5 Unc5BiECko brains. Each dot represents one mouse. One control mouse value was set as 1. h Immunofluorescence staining with the indicated antibodies and confocal imaging of P67 piriform cortex 30 min after i.v cadaverine injection, reproduced on n = 4 Unc5Bfl/fl and n = 4 Unc5BiECko brains. Arrowheads: larger vessels. All data are shown as mean ± SEM. NS non-significant. Two-sided Mann–Whitney U test was performed for statistical analysis. Source data are provided as a Source Data file.
Fig. 3
Fig. 3. Unc5B regulates BBB Wnt/β-catenin signaling.
a qPCR analysis of P67 brain mRNA extracts, n = 4 Unc5Bfl/fl and n = 5 Unc5BiECko brains for quantification of LEF1 and PLVAP mRNA levels, n = 9 Unc5Bfl/fl and n = 9 Unc5BiECko brains for quantification of CLDN5 mRNA levels. Each dot represents one mouse. One control mouse was set as 1. Western blot (b) and quantification (c) of Wnt/β-catenin signaling components in brain protein extracts, n = 7 Unc5Bfl/fl and n = 8 Unc5BiECko brains. Each dot represents one mouse. One control mouse was set as 1. Immunofluorescence (d) and quantification (e) of LEF1 staining on adult brain sections. Each dot is the mean of several images, n = 6 Unc5Bfl/fl and n = 6 Unc5BiECko brains. One control mouse was set as 1. f CTRL IgG and Unc5B immunoprecipitation on cultured brain endothelial cells, reproduced on n = 3 independent experiment. g Schematic of Unc5B adenoviral constructs. CTRL IgG or GFP immunoprecipitation in Unc5B siRNA knockdown ECs infected with siRNA resistant Unc5B adenovirus (h), and quantification of LRP6 pulldown (i), n = 4 independent experiment. Each dot represents one independent experiment. j Unc5B and Ctnnb1 gene deletion strategy using tamoxifen injection in adult mice. k Quantification of cadaverine content in P67 brains, 30 min after i.v. cadaverine injection, n = 4 Unc5Bfl/wt, n = 3 Unc5Bfl/wtiECko, n = 4 Ctnnb1fl/wt, n = 4 Ctnnb1fl/wtiECko, n = 6 Unc5Bfl/wt;Ctnnb1fl/wt and n = 6 Unc5Bfl/wt;Ctnnb1fl/wtiECko brains. Each dot represents one mouse. l Unc5B gene deletion and Ctnnb1flex/3 gene overexpression strategy using tamoxifen injection. Western blot (m) and quantification (n) of P67 brain protein extracts, n = 4 Unc5BiECko and n = 5 Unc5BiECko;Ctnnb1flex/3 brains. Each dot represents one mouse. One control mouse was set as 1. o Quantification of P67 brain cadaverine content, 30 min after i.v cadaverine injection, n = 5 Unc5BiECko and n = 5 Unc5BiECko;Ctnnb1flex/3 brains. Each dot represents one mouse. All data are shown as mean ± SEM. NS non-significant. Two-sided Mann–Whitney U test was performed for statistical analysis between two groups. ANOVA followed by Bonferroni’s multiple comparisons test was performed for statistical analysis between multiple groups. Source data are provided as a Source Data file.
Fig. 4
Fig. 4. Claudin-5 but not VEGFR2 is involved in Unc5B BBB regulation.
a Unc5B deletion and eGFP::Claudin-5 gene overexpression strategy using tamoxifen injection. b Quantification of P67 brain cadaverine content, 30 min after i.v cadaverine injection, n = 4 Unc5BiECko and n = 4 Unc5BiECko;eGFP::Claudin-5 brains. Each dot represents one mouse. Western blot (c) and quantification (d) of P67 brain protein extracts, n = 7 Unc5Bfl/fl and n = 8 Unc5BiECko brains. Each dot represents one mouse. One control mouse was set as 1. e Unc5B and VEGFR2-Y949F gene recombination strategy using tamoxifen injection. f Quantification of P67 brain cadaverine content, 30 min after i.v cadaverine injection, n = 4 Unc5Bfl/fl;Y949F and n = 6 Unc5BiECko;Y949F brains. Each dot represents one mouse. Western blot (g) and quantification (h) of brain protein extracts, n = 7 Unc5Bfl/fl and n = 8 Unc5BiECko brains. Each dot represents one mouse. One control mouse was set as 1. Immunofluorescence with the indicated antibodies (i) and quantification (j) of VE-cadherin coverage on P67 brain sections. Each dot is the mean of several images, n = 3 Unc5Bfl/fl and n = 5 Unc5BiECko brains. One control mouse was set as 1. All data are shown as mean ± SEM. NS non-significant. Two-sided Mann–Whitney U test was performed for statistical analysis. Source data are provided as a Source Data file.
Fig. 5
Fig. 5. Netrin-1 controls BBB integrity.
a, b Quantification of cadaverine content in P67 brains, 30 min after i.v. cadaverine injection. Ntn1 gene deletion was induced by tamoxifen injection between P60 and P64, n = 4 Ntn1fl/fl, n = 4 Ntn1iko, n = 5 Robo4+l+ and n = 4 Robo4+l− brains. Each dot represents one mouse. Western blot (c) and quantification (d) of brain protein extracts, n = 7 Ntn1fl/fl and n = 10 Ntn1iko brains. Each dot represents one mouse. One control mouse was set as 1. Western blot (e) and quantification (f) of mouse brain ECs treated with scrambled CTRL or Unc5B siRNA for 48 h and treated with recombinant mouse Netrin-1 (500 ng/ml) or not (−) for the indicated times. Each dot represents one independent experiment, n = 4 independent experiment. g CTRL IgG or Unc5B immunoprecipitation of brain protein extracts and Western blot for LRP6. h quantification of LRP6 pulldown with Unc5B, n = 3 Ntn1fl/fl and n = 6 Ntn1iko brains. Each dot represents one mouse. One control mouse was set as 1. Western blot (i) and quantification (j) of mouse brain ECs treated with recombinant mouse Netrin-1 (500 ng/ml) or not (−) for the indicated times. Each dot represents one independent experiment, n = 4 independent experiment. Western blot (k) and quantification (l) of mouse brain ECs treated with CTRL DMSO or FAK inhibitor (5 uM) for 30 min followed by recombinant mouse Netrin-1 treatment (500 ng/ml) or not (−) for 1 h. Each dot represents one independent experiment, n = 3 independent experiment (pFAK-Y397(/β-actin): exact p-value between DMSO + Netrin1 (1 h) and FAKi + Netrin1 (1 h) = 0.000031). All data are shown as mean ± SEM. NS non-significant. Two-sided Mann–Whitney U test was performed for statistical analysis between two groups. ANOVA followed by Bonferroni’s multiple comparisons test was performed for statistical analysis between multiple groups. Source data are provided as a Source Data file.
Fig. 6
Fig. 6. Netrin-1 binding to Unc5B mediates BBB integrity.
a, b Surface Plasmon Resonance measurements of anti-Unc5B-3 binding to human and rat Unc5B-ECD-Fc. c Dissociation constant for anti-Unc5B-3 binding to human and rat Unc5B. d Unc5B gene deletion strategy using tamoxifen injection. e Anti-Unc5B-3 was i.v. injected in P67 Unc5Bfl/fl or Unc5BiECko mice for 15 min. Mice were perfused and anti-Unc5B-3 binding was detected by immunofluorescence on brain sections using an anti-human IgG antibody, reproduced on n = 4 Unc5Bfl/fl and n = 3 Unc5BiECko brain. Western-blot (f) and quantification (g) of ECs treated with CTRL IgG or anti-Unc5B-3 for 1 h followed by recombinant mouse Netrin-1 treatment (500 ng/ml) for 10 min or 30 min. Each dot represents one independent experiment, n = 4 independent experiment. h Unc5B immunoprecipitation with a commercial antibody (R&D systems) of brain protein extracts from mice i.v injected with CTRL or anti-Unc5B-3 antibodies (1 h, 10 mg/kg), and western blot with antibodies recognizing the indicated ligands. i Quantification of h, n = 5 CTRL anti-Unc5B-1 and n = 5 anti-Unc5B-3 treated animals. Each dot represents one mouse. One control mouse was set as 1. j I.v. antibody injection strategy. k Immunofluorescence staining on brain sections from antibody-injected mice. l Quantification of brain cadaverine content, n = 5 CTRL IgG, n = 5 anti-Unc5B-3, n = 5 CTRL anti-Unc5B-1 and n = 4 anti-Unc5B-2 treated animals. Each dot represents one mouse. m I.v. antibody injection strategy. n Quantification of brain cadaverine content, n = 4 CTRL anti-Unc5B-1, n = 4 anti-Unc5B-3 and n = 3 anti-Unc5B-2 treated animals. Each dot represents one mouse. o I.v. antibody injection strategy. p, q Quantification of cadaverine content in peripheral organs, n = 4 CTRL anti-Unc5B-1, n = 5 anti-Unc5B-2, n = 5 CTRL IgG and n = 5 anti-Unc5B-3 treated animals. Each dot represents one mouse. All data are shown as mean ± SEM. NS non-significant. Two-sided Mann–Whitney U test was performed for statistical analysis between two groups. ANOVA followed by Bonferroni’s multiple comparisons test was performed for statistical analysis between multiple groups. Source data are provided as a Source Data file.
Fig. 7
Fig. 7. Wnt /β-catenin signaling regulation by Unc5B-blocking antibodies.
a Immunofluorescence staining of Human IgG, Claudin-5 and PLVAP and confocal imaging on brain sections from mice i.v. injected with anti-Unc5B-3 (10 mg/kg) for 1 h, 8 h or 24 h, reproduced on n = 3 untreated brains, n = 4 anti-Unc5B-3 treated brains for 1 h, n = 3 anti-Unc5B-3 treated brains for 8 and n = 3 anti-Unc5B-3 treated brains for 24 h. b CTRL IgG or Unc5B immunoprecipitation of brain protein extracts from mice i.v. injected with anti-Unc5B-3 and protein quantification (c), n = 3 control IgG treated brains, n = 4 anti-Unc5B-3 treated brains for 1 h and n = 3 anti-Unc5B-3 treated brains for 8 and n = 3 anti-Unc5B-3 treated brains for 24 h. Each dot represents one mouse. One control mouse was set as 1. All data are shown as mean ± SEM. NS non-significant. ANOVA followed by Bonferroni’s multiple comparisons test was performed for statistical analysis between multiple groups. Source data are provided as a Source Data file.
Fig. 8
Fig. 8. Size-selectivity of anti-Unc5B induced BBB opening.
Quantification of 10 kDa (a) 40 kDa (b) and 70 kDa (c) dextran content in P67 brains. Unc5Bfl/fl and Unc5BiECko mice were injected with tamoxifen between P60-P64. CTRL anti-Unc5B-1, CTRL IgG, anti-Unc5B-2 and anti-Unc5B-3 antibodies were i.v. injected (10 mg/kg) for 1 h. Dextran was i.v. injected for 30 min. Quantification of 10 kDa dextran was performed on n = 5 Unc5Bfl/fl and n = 5 Unc5BiECko brains, n = 4 CTRL anti-Unc5B-1, n = 5 anti-Unc5B-2, n = 5 CTRL IgG and n = 5 anti-Unc5B-3 treated brains. Quantification of 40 kDa dextran was performed on n = 11 Unc5Bfl/fl and n = 10 Unc5BiECko brains (exact p-value = 0.000040), n = 4 CTRL anti-Unc5B-1, n = 4 anti-Unc5B-2, n = 5 CTRL IgG and n = 5 anti-Unc5B-3 treated brains. Quantification of 70 kDa dextran was performed on n = 5 Unc5Bfl/fl and n = 5 Unc5BiECko brains, n = 5 CTRL IgG and n = 5 anti-Unc5B-3 treated brains. Each dot represents one mouse. df Quantification of 40 kDa dextran content in P67 organs, n = 5 Unc5Bfl/fl and n = 5 Unc5BiECko brains, n = 4 CTRL anti-Unc5B-1, n = 4 anti-Unc5B-2, n = 5 CTRL IgG and n = 5 anti-Unc5B-3 treated brains. Each dot represents one mouse. g Quantification of P67 brain nanobody content 1 h after i.v CTRL IgG or anti-Unc5B-3 injection (10 mg/kg) and 30 min after i.v nanobody injection, n = 6 CTRL IgG and n = 7 anti-Unc5B-3 treated brains. Each dot represents one mouse. h Quantification of P67 brain and plasma BDNF concentration 1 h after i.v CTRL IgG or anti-Unc5B-3 injection (10 mg/kg) and 30 min in after i.v BDNF injection, n = 7 CTRL IgG and n = 7 anti-Unc5B-3 treated brains. Each dot represents one mouse. Trk-B immunoprecipitation of brain protein extracts from mice i.v. injected with CTRL IgG or anti-Unc5B-3 antibodies (10 mg/kg) for 1 h (i) and quantification of phospho-tyrosine pulldown (j), n = 5 CTRL IgG and n = 5 anti-Unc5B-3 treated brains. Each dot represents one mouse. One control mouse was set as 1. All data are shown as mean ± SEM. NS: non-significant. Two-sided Mann–Whitney U test was performed for statistical analysis between two groups. Source data are provided as a Source Data file.

References

    1. Zhao Z, Nelson AR, Betsholtz C, Zlokovic BV. Establishment and dysfunction of the blood-brain barrier. Cell. 2015;163:1064–1078. - PMC - PubMed
    1. Obermeier B, Daneman R, Ransohoff RM. Development, maintenance and disruption of the blood-brain barrier. Nat. Med. 2013;19:1584–1596. - PMC - PubMed
    1. Daneman R, Prat A. The blood-brain barrier. Cold Spring Harb. Perspect. Biol. 2015;7:a020412. - PMC - PubMed
    1. Nitta T, et al. Size-selective loosening of the blood-brain barrier in claudin-5-deficient mice. J. Cell Biol. 2003;161:653–660. - PMC - PubMed
    1. Luissint AC, Artus C, Glacial F, Ganeshamoorthy K, Couraud PO. Tight junctions at the blood brain barrier: physiological architecture and disease-associated dysregulation. Fluids Barriers CNS. 2012;9:23. - PMC - PubMed

Publication types

LinkOut - more resources