. 2022 Mar 4;13(1):1174.
doi: 10.1038/s41467-022-28693-y.

Mechanical control of nuclear import by Importin-7 is regulated by its dominant cargo YAP

Affiliations

Mechanical control of nuclear import by Importin-7 is regulated by its dominant cargo YAP

María García-García et al. Nat Commun. .

Abstract

Mechanical forces regulate multiple essential pathways in the cell. The nuclear translocation of mechanoresponsive transcriptional regulators is an essential step for mechanotransduction. However, how mechanical forces regulate the nuclear import process is not understood. Here, we identify a highly mechanoresponsive nuclear transport receptor (NTR), Importin-7 (Imp7), that drives the nuclear import of YAP, a key regulator of mechanotransduction pathways. Unexpectedly, YAP governs the mechanoresponse of Imp7 by forming a YAP/Imp7 complex that responds to mechanical cues through the Hippo kinases MST1/2. Furthermore, YAP behaves as a dominant cargo of Imp7, restricting the Imp7 binding and the nuclear translocation of other Imp7 cargoes such as Smad3 and Erk2. Thus, the nuclear import process is an additional regulatory layer indirectly regulated by mechanical cues, which activate a preferential Imp7 cargo, YAP, which competes out other cargoes, resulting in signaling crosstalk.


Conflict of interest statement

The authors declare no competing interests.

Figures

Fig. 1
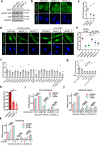
Fig. 1. Imp7 nuclear accumulation is regulated by cell density.
a Schematic representation of the experimental design to identify proteins sensitive to changes in nucleo-cytoplasmic balance as a function of cell density by a quantitative MS approach. Created with Biorender.com. b Quantitative MS hypothesis-free analysis of nuclear and cytosolic fractions of RPE-1 cells grown at low (10,417 cells/cm2) or high (218,750 cells/cm2) confluence. For each protein identified, the difference of cytosolic change between low and high confluence was substracted to the difference of nuclear change between low and high confluence (z-score). We selected and sorted the 5% identified proteins with the higher and lower z-scores. c, d Immunofluorescence of endogenous Imp7 in RPE-1 cells plated at the high and low confluence. Quantification is shown in graph (d). N = 58 cells for each condition, from 3 independent experiments. P-value = 1.100e−14. ei Immunofluorescence of the indicated endogenous proteins in RPE-1 cells plated at high and low cell confluence. Rb: retinoblastoma. Data representative from three biologically independent experiments. j Quantification of the nucleo-cytoplasmic intensity ratio of the indicated proteins in high and low-density cell cultures (high and low). From left to right in the graph, N = 248, 242, 222, 144, 401, 310, 266, 209, 80, and 63 cells per condition, from 3 independent experiments. Statistical analysis with a two-tailed unpaired t-test. From left to right, P-values = 0.052, 0.706, 0.067, 0.024, and 0.131. Raw data are available in the Source Data file. Data represent mean ± s.e.m. Scale bar 10 µm. P-values below or equal to 0.05, 0.01, or 0.005 were considered statistically significant and were labeled with 1, 2, or 3 asterisks, respectively.
Fig. 2
Fig. 2. Imp7 nuclear accumulation is regulated by different mechanical cues.
a Diagram showing cell spreading in different area micropatterns used in (b, c). b, c Immunofluorescence of endogenous Imp7 and nuclei in RPE-1 cells plated on different area micropatterns (dashed line indicates cell boundary) (b). Quantification of the nucleo-cytoplasmic distribution of Imp7 is shown in (c). N = 30 cells per condition from 3 independent experiments. P-value = 1.435e−09. d Diagram showing cell spreading in different stiffness matrices used in (e, f). e, f Immunofluorescence of endogenous Imp7 and nuclei in RPE-1 cells plated on soft (2.3 kPa) and stiff (55 kPa) polyacrylamide matrices. Quantification of the nucleo-cytoplasmic distribution of Imp7 is shown in (f). N = 30 cells per condition from 3 independent experiments. P-value = 2.871e−12. g Diagram showing cell stretching used in (h, i). h, i Immunofluorescence of endogenous Imp7 and nuclei in MOVAS cells plated on silicone membranes and submitted to bi-axial stretching for 1 h and 20% amplitude. Recovering was obtained after 3 h. Quantification is shown in the right graph (i). N = 60 (control), 65 (stretching), and 54 (recovery) cells from 3 independent experiments. P-value = 1.252e−23 (stretched) and 0.061 (recovered). Raw data are available in the Source Data file. Statistical analysis with a two-tailed unpaired t-test. Data represent mean ± s.e.m. Scale bar 10 μm. P-values below or equal to 0.05, 0.01, or 0.005 were considered statistically significant and were labeled with 1, 2, or 3 asterisks, respectively.
Fig. 3
Fig. 3. Actomyosin-controlled tension and Nesprin1 regulate Imp7 localization.
a Diagram showing loss of cell spreading upon disruption of the actin cytoskeleton. b, c Immunofluorescence of endogenous Imp7 and nuclei in RPE-1 cells upon 1 h of 1 µM Cyt D treatment (b). Quantification is shown in graph (c). N = 33 (control) and 47 (Cyt D treated condition) cells from 3 independent experiments. P-value = 1.465e−06. d, e Immunostaining for endogenous Imp7 (d) and quantification of its distribution (e) in RPE-1 cells, exposed to either vehicle or 10 µM blebbistatin for 1 h. N = 30 (control) and 31 (blebbistatin) cells from 3 independent experiments. P-value = 2.641e−05. f, g Immunostaining for endogenous Imp7 (f) and quantification of its distribution (g) in RPE-1 cells, exposed to either vehicle or 25 µM Y27632 (ROCK inhibitor) for 1 h. N = 41 (control) and 43 (treated) cells from 3 independent experiments. P-value = 0.0413. h, i Immunofluorescence of endogenous Imp7 and nuclei in RPE-1 cells upon overexpression of GFP (Control) or GFP-DN KASH (DN KASH) (h). Quantification is shown in graph (i). N = 30 and 31 cells, respectively, from a representative experiment of three independent experiments. P-value = 2.751e−08. Raw data are available in the Source Data file. Statistical analysis with a two-tailed unpaired t-test. Data represent mean ± s.e.m. Scale bar 10 μm. P-values below or equal to 0.05, 0.01, or 0.005 were considered statistically significant and were labeled with 1, 2, or 3 asterisks, respectively.
Fig. 4
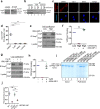
Fig. 4. YAP is actively imported into the nucleus by the nuclear transport receptor Imp7.
a Association of endogenous Imp7 and YAP was analyzed by in situ PLA (red puncta) in RPE-1 cells using anti-YAP (63.7) and anti-Imp7 (rabbit) antibodies. Different controls are shown: anti-YAP or anti-Imp7 alone, and anti-YAP and anti-Imp7 with an unrelated antibody (anti-Impα5 and anti-MMP2, respectively). Images representative from three biologically independent experiments. b Lysates from RPE-1 cells grown at low confluence were immunoprecipitated with anti-Imp7 antibody. Immunoprecipitates and whole-cell lysates (WCL) were analyzed by immunoblotting with anti-YAP antibody and Imp7 as indicated in the figure. N-sMASE antibody was used as an immunoprecipitation antibody control. Three independent experiments were carried out. c Direct binding of YAP, but not YAP ΔC, to Imp7. GFP8Q, GFP8Q-YAP, or GFP8Q-YAP ΔC and GST-Imp7 or GST resin were combined (+) as indicated. Coomassie staining shows a fraction of the initial mixes (input) and pull-downs after the washes (right side). Representative of three biologically independent experiments. d Partitioning of GFP8Q-YAP, GFP8Q-YAP ΔC, and GFP8Q into FG particles derived from scNup116 FG domain. RanQ69L was used to block the interaction between cargo and the NTR. The brightness of image scans was individually adjusted. The average of partition coefficients is indicated for each condition. Representative of three independent experiments. e, f Import into nuclei of digitonin-permeabilized HeLa cells was followed for 5 min in the presence of an energy-regenerating system (EGS), a Ran mix, and 0.7 µM cargo GFP8Q-YAP that was pre-complexed with Imp7. Atto647N-labeled MBP (G260C mutant) was added as a control for the identification of leaky nuclei (cells labeled with white asterisks). Phase contrast was adjusted individually. Quantification is shown in graph (f). N = 42 cells in YAP + Imp7 + Ran, N = 36 cells in YAP + Ran, and N = 40 cells in YAP + Imp7 condition, data from 5 independent experiments. Raw data are available in the Source Data file. Statistical analysis with a two-tailed unpaired t-test. Data represent mean ± s.e.m. Scale bar 10 µm.
Fig. 5
Fig. 5. Imp7 is required for YAP/TAZ nuclear accumulation in cells, and YAP function in gene expression.
a Immunoblot showing specific depletion of Imp7 with two independent siRNAs. GAPDH is the loading control. YAP and pS127 YAP blots were performed in different gels simultaneously. Quantification is shown in Supplementary Fig. 5a–d. Irrelevant lanes in the blot were removed and denoted by the dotted line. b, c Immunofluorescence (b) and quantification (c) of the localization of endogenous YAP/TAZ in RPE-1 cells transfected with either control or Imp7 siRNAs. N = 38 cells per condition from three independent experiments. P-value = 1.438e−11 (siImp7_a) and 1.709e−15 (siImp7_b). d, e Immunofluorescence (d) and quantification (e) of endogenous YAP/TAZ localization and nuclei in RPE-1 cells silenced with two independent Imp7 siRNAs. An empty vector or a X. laevis sequence of HA-Imp7, siRNA-insensitive, were overexpressed (d). Starting from the right, N = 48, 48, 48, 47, 38, and 35 cells per condition, from 3 independent experiments. P-value = 9.679e−11 (siImp7_a) and 1.928e−05 (siImp7_b). f, g Quantification of the effect on YAP/TAZ nucleo-cytoplasmic balance upon silencing of the indicated importins. N range = 30 to 37 cells per condition from 3 independent experiments. P-values from left to right: panel f, 0.229, 1.149e−05, 0.178, 0.093, 1.742e−06, 0.309, 0.114, 0.0001, 0.106, 0.316, 4.448e−26, 0.262, 0.106, 0.059, 0.287, 0.176, 0.353, 0.126, 0.261, 1.969e−07, and 1.790e−26; panel g, 0.007, 4.641e−26, 0.536, 0.525, 0.322, and 0.339. h TEAD transcriptional activity in RPE-1 cells expressing the 8× GTIIC-luciferase reporter. Cells were silenced with control or Imp7 siRNAs. Luciferase activity was analyzed as described in Methods. Data are normalized to control siRNA silenced cells. Three independent experiments were analyzed. P-value = 0.041 (siImp7_a) and 0.005 (siImp7_b). ik qRT-PCR analysis of Ankirin1 (ANKRD), Ctgf and Cyr61 expression in RPE-1 cells transfected with either control or Imp7 siRNAs, and cultured at low/high confluence for 24 h (i), on stiff (55 kPa) or soft (2.3 kPa) substrates for 24 h (j), or under non-stretching/stretching conditions (biaxial stretching, 1 h) (k). Data were normalized to low confluence (i), stiff substrate (j), and stretching (k). Data from three biological replicates for each experiment. Statistical analysis with a two-tailed unpaired t test. Data represent mean ± s.e.m. P-values from left to right i: 0.005, 0.012, 0.009, 0.078, 0.084, 0.059, 0.074, 0.057, and 0.288; j: 0.006, 0.007, 0.009, 0.559, 0.092, 0.154, 0.548, 0.519, and 0.061; k: 0.0062, 0.0099, 0.0061, 0.263, 0.448, 0.619, 0.063, 0.071, and 0.393. Scale bar 10 µm. Raw data available in the Source Data file. P-values below or equal to 0.05, 0.01, or 0.005 were considered statistically significant and were labeled with 1, 2, or 3 asterisks, respectively.
Fig. 6
Fig. 6. Msk is required for Yki nuclear accumulation and Yki-induced organ growth in vivo.
a, b Confocal images of Drosophila imaginal discs overexpressing GFP, GFP-Yki, and GFP-Yki + msk siRNA under the UAS/Gal4 system in the dorsal compartment (under the control of apterusGal4). Quantification in the graph (b). From left to right, N = 7, 18, and 22 discs. Scale bar 100 μm. P-value = 2.870e−07 (column 1 vs. 2), 2.392e−06 (column 2 vs. 3) and 0.084 (column 1 vs. 3). c, d Confocal images of Drosophila imaginal discs overexpressing Yki and Yki + msk siRNA under the UAS/Gal4 system in the dorsal compartment. Quantification of Yki nucleo-cytoplasmic ratio is shown in graph (d). Zooms are shown below. N = 66 and 54 cells from a representative experiment of 3 independent experiments. Scale bar 10 μm. P-value = 1.007e−14. e Confocal images of Drosophila imaginal discs overexpressing Yki and stained against Yki and Msk. Zooms are shown below. Data representative from 3 biologically independent experiments. Scale bar 10 μm. f Confocal images of Drosophila imaginal discs overexpressing YFP-msk under the UAS/Gal4 system in the dorsal compartment (under the control of apterusGal4) and stained against Yki and Msk. Data representative of three biologically independent experiments. Scale bar 10 μm. g, h S2 cells overexpressing different combinations of the indicated proteins were grown on top of a ConA coated surface. YFP-Msk was immunoprecipitated with anti-GFP. The immunopurified complexes and total cell lysates (WCL) were immunoblotted as indicated. IgG was marked with an asterisk and Yki was marked with a #. Quantification from three biologically independent co-immunoprecipitations is shown (h). Statistical analysis with a two-tailed unpaired t-test. Data represent mean ± s.e.m. ns non-significant. P-value = 0.167 (4th vs. 5th bar), 0.00023 (4th vs. 6th bar) and 0.0029 (5th vs. 6th bar). Raw data are available in the Source Data file. P-values below or equal to 0.05, 0.01, or 0.005 were considered statistically significant and were labeled with 1, 2, or 3 asterisks, respectively.
Fig. 7
Fig. 7. Cell density, actomyosin-controlled tension, and the Hippo pathway regulate Imp7–YAP complex formation.
a Cells at low confluency were treated with 1 µM Cyt D for 1 h or control vehicle, lysates were made, and YAP was immunoprecipitated. The immunopurified complexes and cell lysates were immunoblotted as indicated. Representative of three biologically independent experiments. b RPE-1 cells were grown to either low (10,417 cells/cm2, cultured for two days) or high confluence (67,708 cells/cm2). Anti-YAP or control IgG (anti-ESE-1) were used to immunopurify associated complexes and were immunoblotted as indicated. Representative of three biologically independent experiments. c, d In situ PLA detection of the association between endogenous YAP (63.7) and Imp7 in RPE-1 cells treated with DMSO, Cyt D, blebbistatin, or Y27632. d Quantification of the PLA signal. From left to right, N = 10, 9, 12, and 12 fields per condition, from 3 independent experiments. P-value = 3.506e−05 (Control vs. Cyt D), 4.679e−05 (Control vs. Blebb) and 4.903e−05 (Control vs. Y27632). e, f Cells were grown at low or high confluency. High confluency cells were treated with vehicle (−) or MST1/2 inhibitor (+, XMU-MP-1) at 6 µM for 16 h. Cells were lysed and Imp7 was immunoprecipitated. Immunoprecipitated fractions and whole-cell lysates were blotted as indicated. Quantification of 3 biologically independent experiments is shown (f). Irrelevant lanes in the blot were removed and denoted by the dotted line. g, h Cells at low confluency were treated with vehicle (−) or MST1/2 inhibitor (+, XMU-MP-1) at 6 µM for 16 h. One hour before lysis, cells were (+) or were not (−) treated with Cyt D at 1 µM. Cells were lysed and Imp7 was immunoprecipitated. Immunoprecipitated fractions and lysates were blotted with the indicated antibodies. Quantification of three biologically independent experiments is shown (h). i, j Direct binding of YAP WT and YAP S128E, but not YAP ΔC or S127E, to GST-Imp7. GFP8Q-YAP WT, GFP8Q-YAP S128E, GFP8Q-YAP S127E, or GFP8Q-YAP ΔC and GST-Imp7 resin were combined. Coomassie staining shows a fraction of the initial mixes (input) and pull-downs. Quantification of the GFP8Q-YAP Coomassie bands are shown (j). N = 3 biologically independent experiments. Statistical analysis with a two-tailed unpaired t-test. Data represent mean ± s.e.m. Scale bar 10 µm. ns non-significant. P-value = 0.018 (WT vs. S127E), 0.703 (WT vs. S128E), 0.070 (ΔC vs. S127E), 0.019 (ΔC vs. S128E), and 0.025 (S127E vs. S128E). Raw data are available in the Source Data file. P-values below or equal to 0.05, 0.01, or 0.005 were considered statistically significant and were labeled with 1, 2, or 3 asterisks, respectively.
Fig. 8
Fig. 8. YAP determines Imp7 mechanoresponse.
a, b Immunofluorescence of endogenous Imp7 and nuclei in RPE-1 cells growing at the low confluence and silenced for YAP with two independent siRNAs. Vehicle (DMSO) or Cyt D (1 µM, 1 h) treated sets are shown. Quantification is shown in graph (b). From left to right in the graph, N = 240, 236, 270, 321, 167, and 190 cells per condition, from 3 independent experiments. P-value = 1.069e−14 (DMSO siControl vs DMSO siYAP_a), 1.210e-16 (DMSO siControl vs. DMSO siYAP_b), 5.361e-12 (DMSO siControl vs. Cyt D siYAP_a), 0.101 (DMSO siYAP_a vs. DMSO siYAP_b), 0.206 (DMSO siYAP_a vs. Cyt D siControl), 0.090 (DMSO siYAP_a vs. CytD siYAP_a), 0.011 (DMSO siYAP_b vs. Cyt D siControl), 0.831 (DMSO siYAP_b vs. Cyt D siYAP_b), and 0.804 (Cyt D siYAP_a vs. Cyt D siYAP_b). c, d Immunofluorescence of endogenous Imp7 and nuclei in RPE-1 cells growing at low or high confluence treated with 6 µM XMU-MP-1 for 16 h. Quantification is shown in graph (d). From left to right in the graph, N = 93, 273, and 194 cells per condition, from 3 independent experiments. P-value = 5.480e−14 (1st vs. 2nd bars), 0.0036 (1st vs. 3rd bars), and 1.422e−25 (2nd vs. 3rd bars). e, f Immunofluorescence of endogenous Imp7 in RPE-1 cells growing at a low confluence, silenced for Smad3 and treated with (+) or without (−) TGFβ (10 ng/ml for 2 h). Quantification is shown in graph (f). From left to right in the graph, N = 51, 50, 53, and 45 cells per condition, from 3 independent experiments. g Immunoblot showing specific depletion of Smad3. Several loading controls are shown. Representative of three biologically independent experiments. Raw data are available in the Source Data file. Statistical analysis with a two-tailed unpaired t-test. Data represent mean ± s.e.m. Scale bar 10 µm. ns non-significant. P-values below or equal to 0.05, 0.01, or 0.005 were considered statistically significant and were labeled with 1, 2, or 3 asterisks, respectively.
Fig. 9
Fig. 9. YAP restricts Smad3 nuclear accumulation independent of pSmad3 and TAZ.
a, b Immunofluorescence of endogenous Smad3 in RPE-1 cells at the low confluence and silenced for YAP with two independent siRNAs. Cells treated with (+) or without (−) TGFβ. Quantification is shown in graph (b). From left to right in the graph, N = 65, 77, 51, 64, 55, and 73 cells per condition, from 3 independent experiments. P-value = 2.356e−19 (1st vs. 2nd bars), 0.010 (1st vs. 3rd bars), 0.109 (1st vs. 5th bars), 1.147e−07 (2nd vs. 4th bars) and 0.00099 (2nd vs. 6th bars). ce Immunoblot showing specific phosphorylation of Smad3, Smad3, YAP, and TAZ total levels in cells silenced for YAP with two independent siRNAs. Quantification of pS423/425 Smad3 (pSmad3)/Smad3 levels is shown in graph (d). N = 3 biologically independent experiments. Quantification of TAZ/Smad3 levels is shown in graph (e). N = 3 biologically independent experiments. Statistical analysis with a two-tailed unpaired t-test. Data represent mean ± s.e.m. In graph d, p-value = 0.0012 (1st vs. 2nd bars), 0.470 (2nd vs. 4th bars), 0.446 (2nd vs. 6th bars), 0.0083 (3rd vs. 4th bars) and 0.0047 (5th vs. 6th bars). In graph e, p-value = 0.095 (1st vs. 3rd bars), 0.356 (1st vs. 5th bars), 0.515 (2nd vs. 6th bars) and 0.464 (2nd vs. 4th bars). Scale bar 10 µm. ns non-significant. Raw data are available in the Source Data file. P-values below or equal to 0.05, 0.01, or 0.005 were considered statistically significant and were labeled with 1, 2, or 3 asterisks, respectively.
Fig. 10
Fig. 10. YAP restricts Smad3 and Imp7 association.
ad In situ PLA detection of the association between endogenous Smad3 and Imp7 in RPE-1 cells growing at low (a, b) or high confluence (c, d) and silenced with control or two independent siRNAs for YAP. Quantification of the PLA signal is in panels (b) and (d). N = 9 fields (low confluence) and N = 12 fields (high confluence) from 3 independent experiments. In panel b: P-value = 0.0011 (1st vs. 2nd lanes) and 0.00079 (1st vs. 3rd lanes). In panel d: p-value = 0.311 (1st vs. 2nd lanes), 0.076 (1st vs. 3rd lanes), and 0.563 (2nd vs. 3rd lanes). e, f In situ PLA detection of the association between endogenous Smad3 and Imp7 in RPE-1 cells overexpressing the indicated proteins and growing at the low confluence. f Quantification of the PLA signal. N = 16 fields in each sample from 3 independent experiments. P-value = 8.563e−10 (1st vs. 2nd bars), 0.541 (1st vs. 3rd), 0.336 (1st vs. 4th), 1.437e−11 (2nd vs. 4th), and 0.726 (3rd vs. 4th). g Immunoblot showing the levels of overexpressed EYFP-YAP, EYFP-YAP S127E, and EYFP-YAP ΔC mutants in RPE-1 cells. h, i In situ PLA detection of the association between endogenous Smad3 and Imp7 in RPE-1 cells growing at the high confluence and treated with (+) or without (−) XMU-MP-1 for 16 h. i Quantification of the PLA signal. N = 13 fields for each sample from 3 independent experiments. Statistical analysis with a two-tailed unpaired t-test. Data represent mean ± s.e.m. Scale bar 10 µm. P-value = 2.014e−07. Raw data are available in the Source Data file. P-values below or equal to 0.05, 0.01, or 0.005 were considered statistically significant and were labeled with 1, 2, or 3 asterisks, respectively. j A graphical model to explain the results of this study. In conditions of low cell tension, such as high cell density or disruption of the actin cytoskeleton, YAP is no longer competent to bind Imp7 due to phosphorylation on YAP serine 127. This setting favors Smad3 and Erk2 association with Imp7, which results in more nuclear Smad3 and Erk2. On the contrary, under conditions of high cell tension, such as low cell density and intact contractile actin cytoskeleton, the Hippo pathway is inactive, resulting in the formation of the Imp7–YAP complex, which drives YAP and YAP-dependent Imp7 nuclear localization. Under these conditions, the association of Smad3 and Erk2 to Imp7 is limited by YAP. This mechanism permits the regulation of other signaling pathways by the Hippo pathway in a cell tension-dependent manner by the competition of YAP for Smad3 or Erk2 access to Imp7. Created using Biorender.com.

Similar articles

Cited by

References

    1. Hannezo E, Heisenberg CP. Mechanochemical feedback loops in development and disease. Cell. 2019;178:12–25. - PubMed
    1. Wozniak MA, Chen CS. Mechanotransduction in development: a growing role for contractility. Nat. Rev. Mol. Cell Biol. 2009;10:34–43. - PMC - PubMed
    1. Gilbert PM, Weaver VM. Cellular adaptation to biomechanical stress across length scales in tissue homeostasis and disease. Semin. Cell Dev. Biol. 2017;67:141–152. - PMC - PubMed
    1. Jaalouk DE, Lammerding J. Mechanotransduction gone awry. Nat. Rev. Mol. Cell Biol. 2009;10:63–73. - PMC - PubMed
    1. Vogel V, Sheetz M. Local force and geometry sensing regulate cell functions. Nat. Rev. Mol. Cell Biol. 2006;7:265–275. - PubMed

Publication types

MeSH terms

Substances