. 2022 Mar 4;13(1):1004.
doi: 10.1038/s41467-022-28648-3.

Whole-genome sequencing of 1,171 elderly admixed individuals from São Paulo, Brazil

Affiliations

Whole-genome sequencing of 1,171 elderly admixed individuals from São Paulo, Brazil

Michel S Naslavsky et al. Nat Commun. .

Erratum in

  • Author Correction: Whole-genome sequencing of 1,171 elderly admixed individuals from Brazil.
    Naslavsky MS, Scliar MO, Yamamoto GL, Wang JYT, Zverinova S, Karp T, Nunes K, Ceroni JRM, de Carvalho DL, da Silva Simões CE, Bozoklian D, Nonaka R, Dos Santos Brito Silva N, da Silva Souza A, de Souza Andrade H, Passos MRS, Castro CFB, Mendes-Junior CT, Mercuri RLV, Miller TLA, Buzzo JL, Rego FO, Araújo NM, Magalhães WCS, Mingroni-Netto RC, Borda V, Guio H, Rojas CP, Sanchez C, Caceres O, Dean M, Barreto ML, Lima-Costa MF, Horta BL, Tarazona-Santos E, Meyer D, Galante PAF, Guryev V, Castelli EC, Duarte YAO, Passos-Bueno MR, Zatz M. Naslavsky MS, et al. Nat Commun. 2022 Mar 30;13(1):1831. doi: 10.1038/s41467-022-29575-z. Nat Commun. 2022. PMID: 35354829 Free PMC article. No abstract available.

Abstract

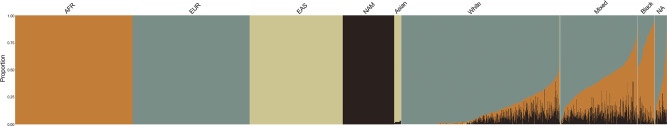
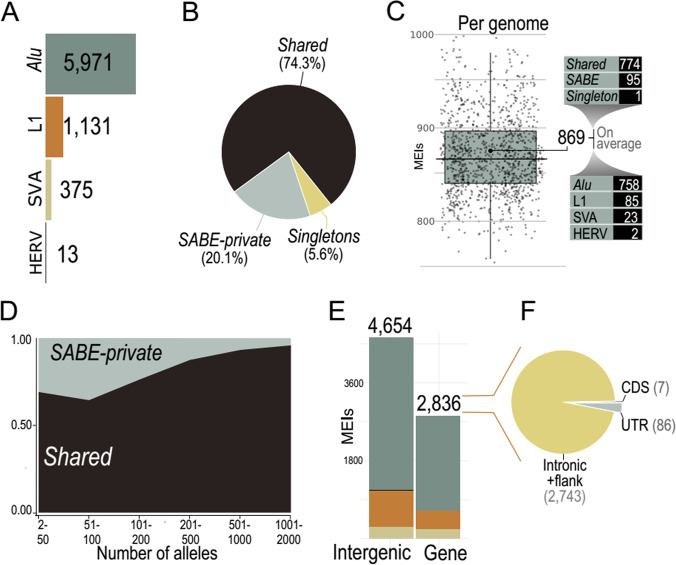
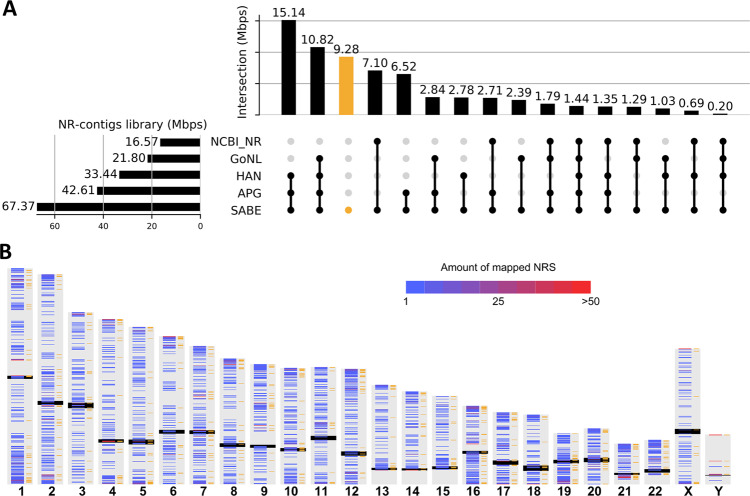
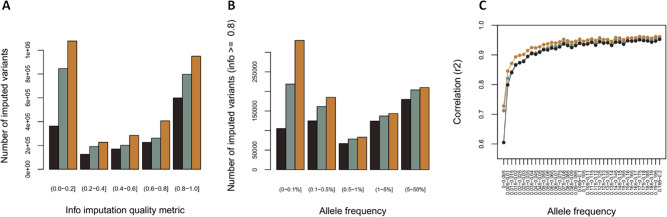
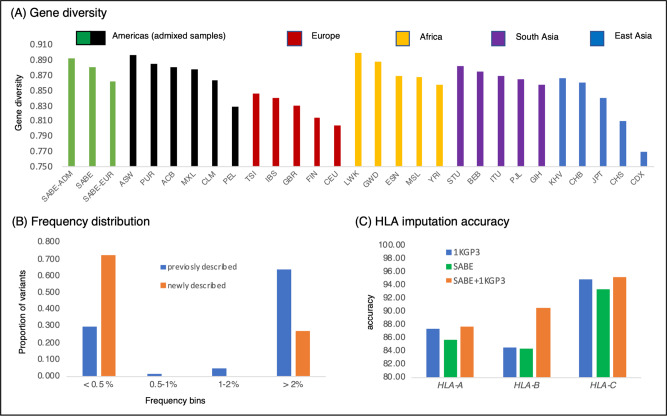
As whole-genome sequencing (WGS) becomes the gold standard tool for studying population genomics and medical applications, data on diverse non-European and admixed individuals are still scarce. Here, we present a high-coverage WGS dataset of 1,171 highly admixed elderly Brazilians from a census-based cohort, providing over 76 million variants, of which ~2 million are absent from large public databases. WGS enables identification of ~2,000 previously undescribed mobile element insertions without previous description, nearly 5 Mb of genomic segments absent from the human genome reference, and over 140 alleles from HLA genes absent from public resources. We reclassify and curate pathogenicity assertions for nearly four hundred variants in genes associated with dominantly-inherited Mendelian disorders and calculate the incidence for selected recessive disorders, demonstrating the clinical usefulness of the present study. Finally, we observe that whole-genome and HLA imputation could be significantly improved compared to available datasets since rare variation represents the largest proportion of input from WGS. These results demonstrate that even smaller sample sizes of underrepresented populations bring relevant data for genomic studies, especially when exploring analyses allowed only by WGS.


Conflict of interest statement

The authors declare no competing interests.

Figures

Fig. 1
Fig. 1. Global ancestry inference of SABE cohort.
Individual ancestry bar plots of SABE cohort (N = 1168) using supervised admixture analysis (K = 4). Africans (AFR), Europeans (EUR), East Asians (EAS), and Native Americans (NAM) samples are used as parental populations. SABE cohort individuals are distributed by self-reported ethnoracial groups (according to the Brazilian Institute of Geography and Statistics categories Asian, White, Mixed, and Black; see Supplementary Fig. 5). NA not available.
Fig. 2
Fig. 2. A landscape of mobile element insertions (MEIs) into SABE genomes.
A Total of MEIs in SABE genomes. As expected, Alu and L1 elements are predominant elements. B Proportion MEIs in Shared (present in DGV genomes), in two or more genomes from SABE cohort (SABE-private) and present in only one SABE genome (Singletons) C Number of MEIs per individual. The lower and upper hinges correspond to the 25th and 75th percentiles, respectively, and the whiskers represent the 1.58 × interquartile range (IQR) extending from the hinges. D Distribution of allele frequencies of Shared and SABE-private MEIs. E Number of MEIs into genes and in intergenic regions. F Number of MEIs in the coding region (CDS), untranslated regions (UTR), or intronic and flank (2 kbp near genes).
Fig. 3
Fig. 3. Non-reference genome sequences (NRS) in the SABE dataset.
A UpSet plot showing the presence of the SABE NRS in other public databases (sharing among datasets indicated by connected dots): NCBI nonredundant database (NCBI_NR), Genome of the Netherlands (GoNL), NAH Chinese (HAN), and African (APG) pan-genomes. B Distribution of NRS across chromosomes. The black bars mark centromeres, bands on the left of each chromosome show density of NRS contigs, orange bands on the right side of each chromosome indicate positions of SABE-private NRS. Chromosome representations are not in scale.
Fig. 4
Fig. 4. Comparison of imputation performance of SABE, 1KGP3, and SABE + 1KGP3 reference panels using the Omni 2.5 M array data for 6487 Brazilians from EPIGEN as target panel (chromosome 15).
A The total number of imputed variants across different classes of info score quality metric. B The total number of imputed variants with info score ≥0.8 across the allele frequency spectrum. C Improvement in imputation accuracy as a function of minor allele frequency (MAF) for the target dataset after imputation (MAF from 0 to 0.2, bin sizes of 0.005). Similar results were reached for the other chromosomes tested and for each cohort (Supplementary Figs. 14-36; Supplementary Tables 10-16).
Fig. 5
Fig. 5. HLA polymorphism in the SABE cohort.
SABE and 1KGP3 samples were processed with the same HLA workflow, as described in the Supplementary Information. A Average gene diversity across SABE and the 1KGP3 populations considering haplotypes of all SNVs, i.e., the 2064 SNVs from six HLA class I genes, HLA-A, HLA-B, HLA-C, HLA-E, HLA-F, and HLA-G. SABE all samples from SABA dataset, SABE-ADM samples with at least 30% of both European and African global ancestry, SABE-EUR samples with 100% European global ancestry. B The proportion of previously and newly described SABE HLA SNVs according to different minor allele frequency classes. C HLA imputation accuracy when using the 1KGP3 (blue), SABE (green), and combining both (orange). Imputation was performed on 146 highly admixed Brazilians previously genotyped on Axiom Human Origins array and HLA genotyping by sequence-based typing methods.

References

    1. Wall JD, et al. The GenomeAsia 100K Project enables genetic discoveries across Asia. Nature. 2019;576:106–111. - PMC - PubMed
    1. Taliun, D. et al. Sequencing of 53,831 diverse genomes from the NHLBI TOPMed Program. bioRxiv. https://www.biorxiv.org/content/10.1101/563866v1 (2019). - DOI - PMC - PubMed
    1. Karczewski KJ, et al. The mutational constraint spectrum quantified from variation in 141,456 humans. Nature. 2020;581:434–443. - PMC - PubMed
    1. Telenti A, et al. Deep sequencing of 10,000 human genomes. Proc. Natl Acad. Sci. USA. 2016;113:11901–11906. - PMC - PubMed
    1. Li J, et al. Decoding the genomics of abdominal aortic aneurysm. Cell. 2018;174:1361–1372 e10. - PubMed

Publication types