. 2022 Mar 4;13(1):1185.
doi: 10.1038/s41467-022-28587-z.

Cytonemes coordinate asymmetric signaling and organization in the Drosophila muscle progenitor niche

Affiliations

Cytonemes coordinate asymmetric signaling and organization in the Drosophila muscle progenitor niche

Akshay Patel et al. Nat Commun. .

Abstract

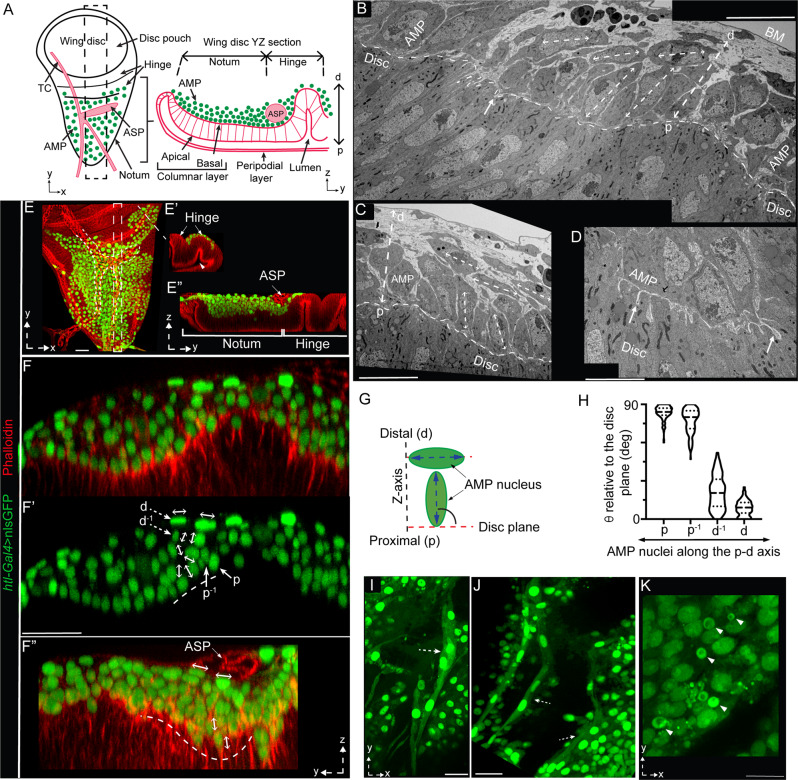
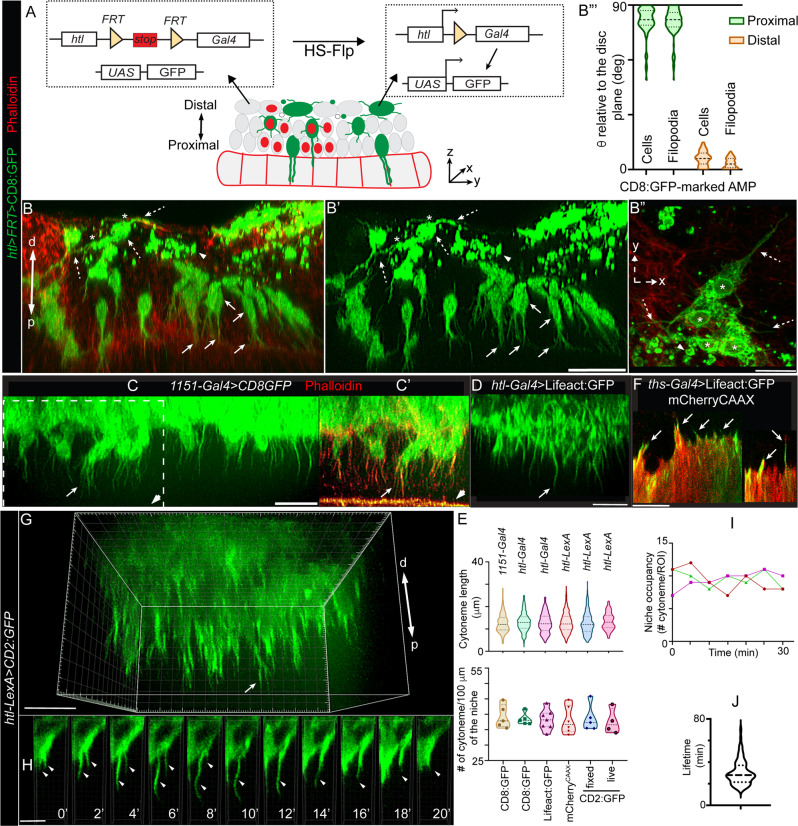
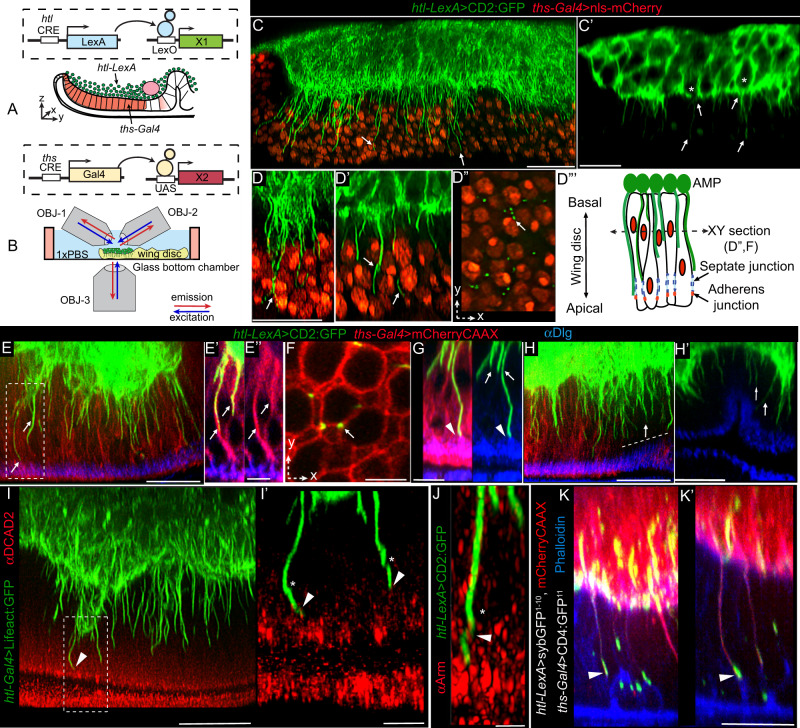
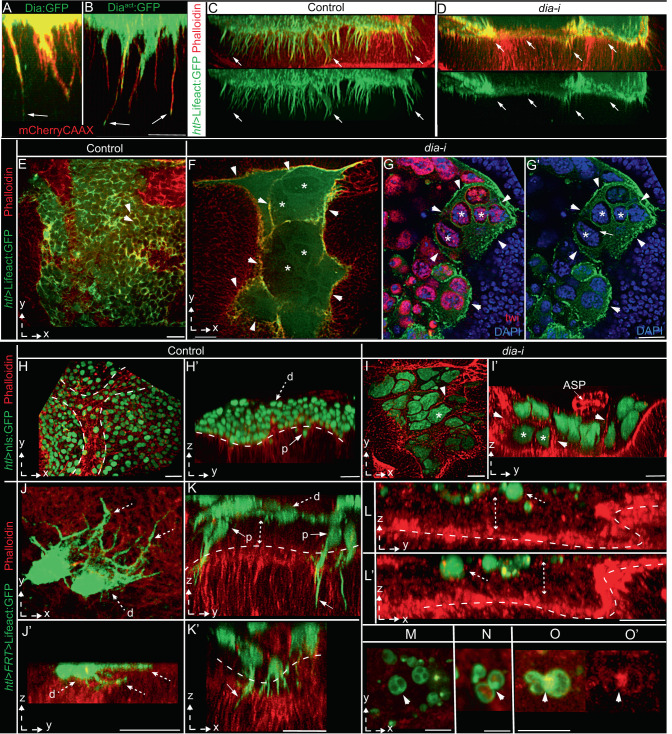
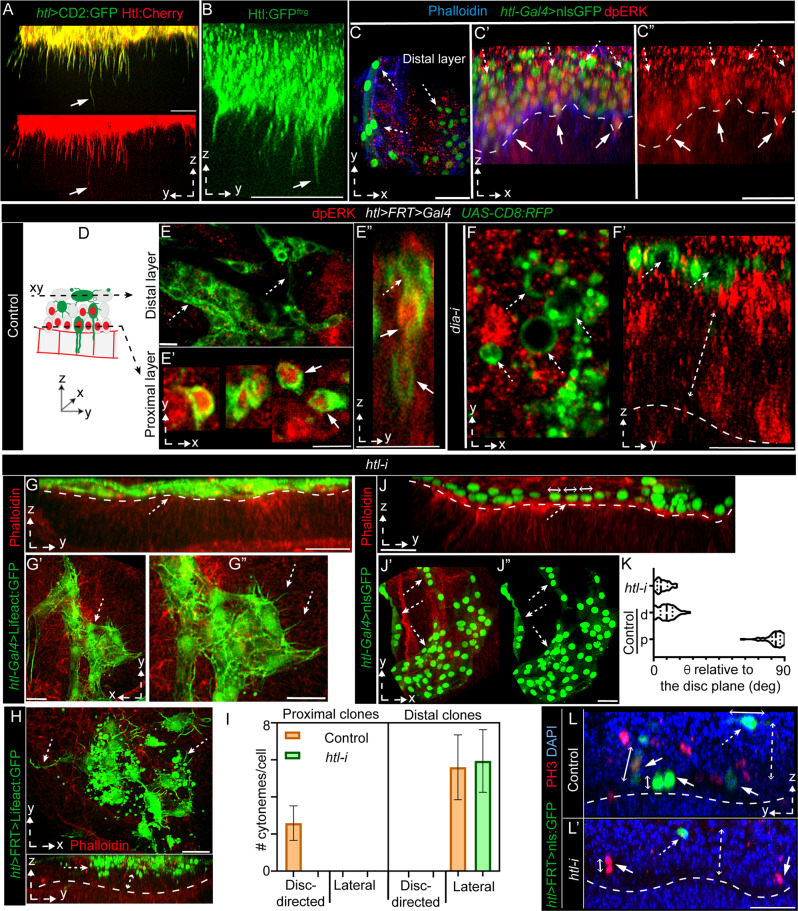
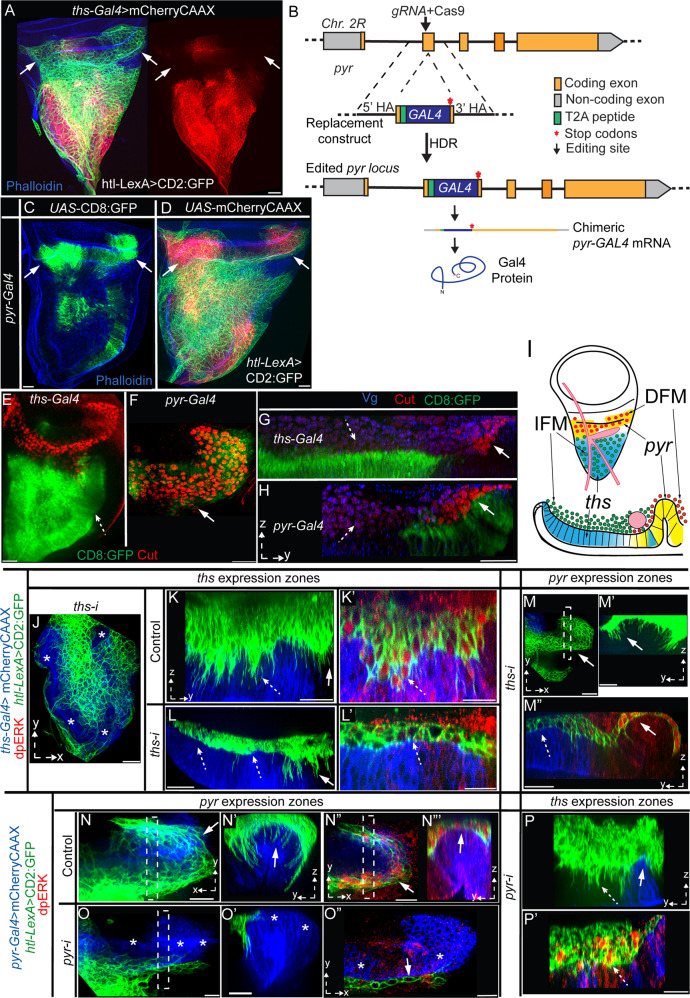
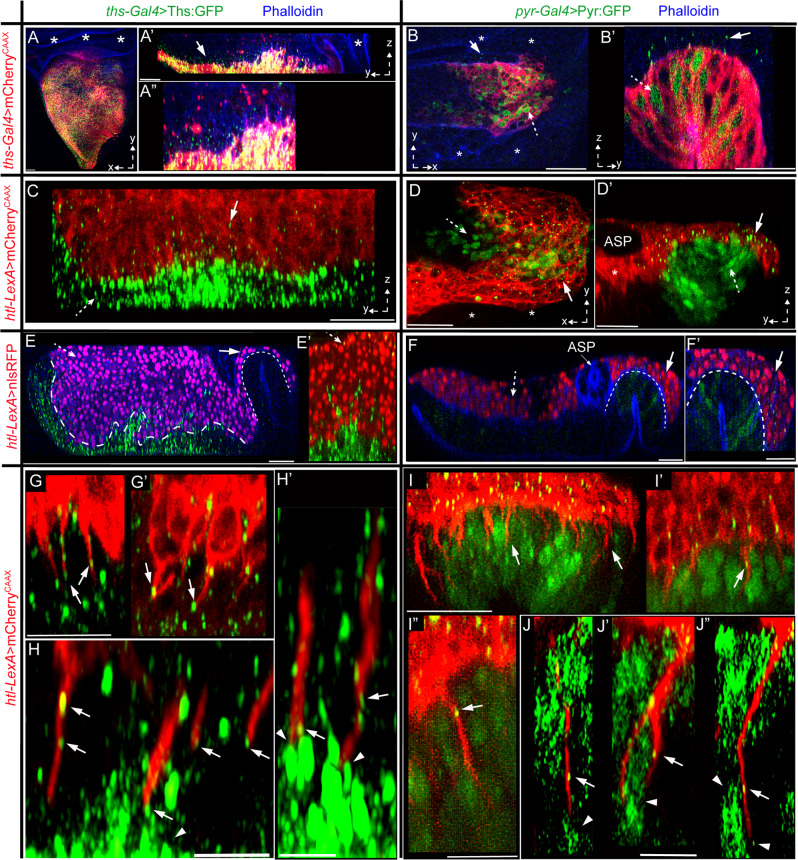
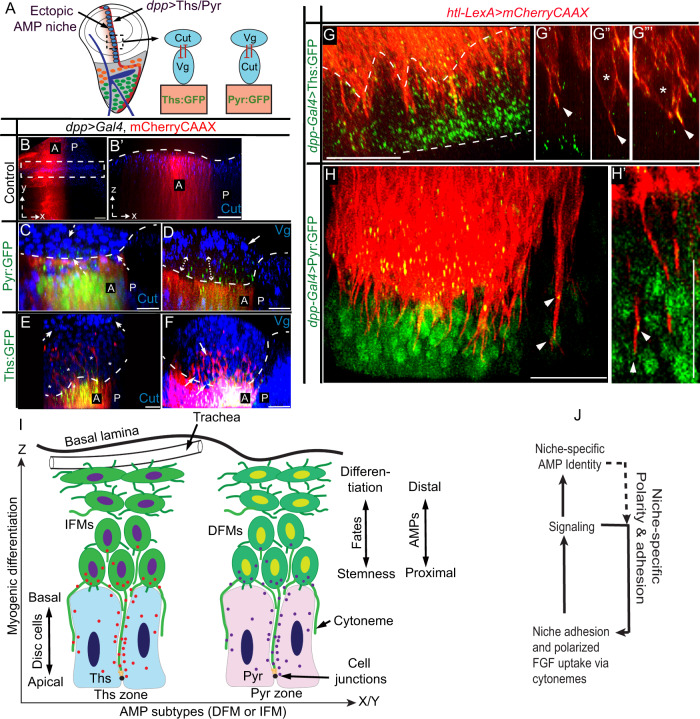
Asymmetric signaling and organization in the stem-cell niche determine stem-cell fates. Here, we investigate the basis of asymmetric signaling and stem-cell organization using the Drosophila wing-disc that creates an adult muscle progenitor (AMP) niche. We show that AMPs extend polarized cytonemes to contact the disc epithelial junctions and adhere themselves to the disc/niche. Niche-adhering cytonemes localize FGF-receptor to selectively adhere to the FGF-producing disc and receive FGFs in a contact-dependent manner. Activation of FGF signaling in AMPs, in turn, reinforces disc-specific cytoneme polarity/adhesion, which maintains their disc-proximal positions. Loss of cytoneme-mediated adhesion promotes AMPs to lose niche occupancy and FGF signaling, occupy a disc-distal position, and acquire morphological hallmarks of differentiation. Niche-specific AMP organization and diversification patterns are determined by localized expression and presentation patterns of two different FGFs in the wing-disc and their polarized target-specific distribution through niche-adhering cytonemes. Thus, cytonemes are essential for asymmetric signaling and niche-specific AMP organization.


Conflict of interest statement

The authors declare no competing interests.

Figures

Fig. 1
Fig. 1. Correlation of the AMP position and polarity relative to the disc.
A Drawing of an L3 wing disc showing the spatial organization of AMPs, wing disc notum and hinge areas, and ASP (air-sac primordium) and TC (transverse connective); dashed box (left), ROI used for all subsequent YZ cross-sectional images. BD TEM sections of wing disc (w1118) showing YZ views of different wing disc notum areas; double-sided dashed arrows, long axes of elliptical AMPs; p-d dashed arrow, proximo (p)-distal (d) axis relative to the disc plane (dashed line); white arrow, cytoneme-like disc-invading projections from AMPs (D see Supplementary Fig. 1A,A’); BM basement membrane. EE” Spatial organization of nls:GFP-marked AMP nuclei, orthogonal to the wing disc notum (E, E”) and hinge (E, E’) as illustrated in A. FH Cross-sections of wing disc regions (indicated in ROI box in A) harboring nls:GFP-marked AMPs; double-sided arrows, nuclear orientation; F’ green channel of F; dashed and solid arrows, distal and proximal layer cells, respectively; G drawing illustrating the strategy to measure nuclear orientation as angles (Theta, θ) between AMP nuclei and the disc plane; H graph showing quantitative analyses of AMP nuclear orientation at different disc-relative locations; p: proximal (125 nuclei), d: distal (58 nuclei), p−1: one layer above p (119 nuclei), d−1: one layer below d (84 nuclei); also see Supplementary Table 1 and see “Methods” section for statistics; source data are provided as a “Source Data” file. IK Single XY optical sections of the discs, showing diverse morphologies of distal AMPs; dashed arrows, elongated syncytial cells; arrowhead, small nonpolar cells (also see Supplementary Fig. 1B–D’). E, F” red, phalloidin, marking tissue outlines (also indicated by dashed line). Genotype: UAS-nls:GFP/+; htl-Gal4/+ (EK). Scale bars: 20 μm; 10 μm (B, C, K); 5 μm (D).
Fig. 2
Fig. 2. Disc-specific AMP polarity and adhesion are linked to polarized AMP cytonemes.
A Schematic depiction of htl>FRT>stop>FRT>Gal4 construct and its application to generate FLIP-out clones exclusively in AMPs (also see Supplementary Fig. 1E, F). B-B” Wing disc harboring random CD8:GFP-marked AMP clones (hs-Flp; UAS-CD8:GFP; htl>FRT>stop>FRT>Gal4) showing orthogonal and lateral polarity of AMPs and AMP cytonemes relative to disc plane; arrow and dashed arrow, proximal and distal AMPs/AMP cytonemes, respectively; arrowhead, distal small non-polar cells; *, adherent distal AMPs; phalloidin (red), actin-rich disc-AMP junction and cell-cortex (also see Supplementary Fig. 1G–H”); B’ GFP channel of B; B”’ Violin plots showing angles (Theta, θ; see Fig. 1G) between proximal and distal AMPs and their cytonemes relative to their underlying disc plane (see Supplementary Table 2 for statistical analyses). CE Comparison of AMP cytonemes (arrows) marked by various fluorescent proteins driven by different transcription drivers, in fixed and live tissues, as indicated; arrowhead, actin-rich (phalloidin-marked) apical-junction of disc epithelium; E Graphs comparing length and numbers (count/100 μm length of AMP-disc interface) of orthogonal cytonemes (n = >125 cytonemes for each genotype/condition, imaged from >5 wing disc/genotype under fixed condition and four discs under live condition; see “Source Data” for statistics). F Actin-rich cytonemes (arrow) from wing disc cells expressing mCherryCAAX and Lifeact:GFP (fixed tissue). GJ Live dynamics of AMP cytonemes; G 3D-rendered image showing live cytonemes captured from p-to-d direction of the tissue; H dynamics of cytonemes (arrow) (2 min time-lapse, also see Supplementary Movies 1–4); I Graphs showing numbers of niche-occupying cytonemes over time within selected ROIs; three graph colors, three discs; J Graph showing the distribution of cytonemes lifetimes (n = 77 cytonemes; also see Supplementary Fig. 2D). Source data for B”‘, I, and J are provided as a “Source Data” file. CJ Genetic crosses: enhancer-Gal4/-LexA x UAS-/LexO-fluorescent protein (FP), as indicated. Scale bars: 20 μm; 5 μm (H).
Fig. 3
Fig. 3. AMP cytonemes anchor AMPs to the wing disc adherens junctions.
A, B Schematic depictions of the genetic strategy (A) used to simultaneously mark AMPs and the disc notum, and imaging strategy (B) using multi-view microscopy for deep-tissue imaging. C, D”’ Triple-view confocal imaging showing CD2:GFP-marked orthogonally polarized cytonemes (arrow) emanating from disc-proximal AMPs (*, in C’) and invading through the intercellular space between nls:mCherry-marked disc cells (C, D, D’); D”-D”’ single XY cross-sections of disc, as illustrated in D”’, showing multiple cytonemes sharing the same intercellular space. EH’ CD2:GFP-marked AMP cytonemes at the intercellular space of mCherryCAAX-marked wing discs approaching apical adherens junctions (Dlg stain, blue); E’, E”, dashed box area in E; F XY cross-section of disc showing niche sharing by multiple cytonemes; G Airyscan image of cytoneme tip approaching adherens junction (arrowhead), H, H’ AMP cytonemes (arrow) in both ths-Gal4 expressing (red) and non-expressing areas (dashed line). I, J Tip regions of AMP cytonemes contacting disc adherence junction that is marked with DCAD2 (I, I’) and Arm (J); *, helical twists in cytonemes; arrowhead, contact sites; I’ zoomed-in image from ROI in I. K, K’ Synaptic cytoneme-disc contact sites mapped by syb-GRASP (see “Methods” section) between sybGFP1–10- and mCherryCAAX-expressing AMP cytonemes and the actin-rich (phalloidin, blue) apical junction of CD4:GFP11-expressing wing-disc cells. All images are YZ cross sections unless noted. All panels, Gal4/UAS or LexA/LexO or genetic combinations of both used, as indicated (see Methods). Scale bars: 20 μm; 5 μm (E, E’, I’, F, G); 2 μm (J).
Fig. 4
Fig. 4. Disc-cytoneme adhesion determines AMP position and fates.
AD AMP cytoneme formation depends on Dia; A, B mCherryCAAX-marked AMP cytonemes localizing Dia:GFP (A UAS-mCherryCAAX/UAS-Dia:GFP; htl-Gal4/+) and Diaact:GFP (B hsflp/+; UAS-mCherryCAAX/+; htl>FRT>stop>FRT>Gal4/UAS-Diaact:GFP). C, D Loss of cytonemes (arrow) in Lifeact:GFP-marked AMPs expressing dia-i; average numbers of orthogonal cytonemes/100 μm of AMP-disc interface (± standard deviation (SD)): control (htl-Gal4>Lifeact:GFP) = 36.9 ± 3.8, and dia-i condition (htl-Gal4>Lifeact:GFP; dia-i) = 6 ± 4.1; Source data are provided as a “Source Data” file. EI’ Comparison of control disc (E, H, H’) and disc expressing dia-i in AMPs under htl-Gal4, showing changes in the number of AMPs and AMP nuclei, morphologies, and orientations relative to the disc; G, G’ DAPI and Twi-stained; EG’ and HI’ AMPs expressing Lifeact:GFP and nls:GFP, respectively; red, phalloidin; arrowhead, actin-rich cell outline; * examples of giant nuclei within a large chamber; arrow in G’ shows the cytoplasmic space and thin Lifeact:GFP-marked membrane cortex surrounding each giant nucleus indicating hemifusion; dashed line in H and H’, tracheal outline and AMP-disc junction, respectively. JO Comparison between control (JK’) and dia-i-expressing (LO’) AMP clones for their proximo-distal localization, polarity, and morphology; dashed arrow, distal cell/cytonemes, solid arrow, proximal cell/cytonemes, dashed line, AMP-disc junction, dashed double-sided arrow, space between basal disc surfaces and distal clones; MO’ arrowhead, multi-nucleated cells (M), actin-rich (phalloidin stained and Lifeact:GFP-marked) fusogenic synapse (NO’). XY or YZ views are indicated. Genotypes: UAS-X/+, htl-Gal4/UAS-dia-i (D, FG’, I, I’). UAS-FP/+; htl-Gal4/+ (C, E, H, H’) HS-Flp/+; UAS-X/+; htl>FRT>stop>FRT>Gal4/+ (JK’). HS-Flp/+; UAS-X/+; htl>FRT>stop>FRT>Gal4/UAS-dia-i (LO’). X = FP, as indicated. Scale bars: 20 μm; 10 μm (A, B, MO).
Fig. 5
Fig. 5. AMP cytonemes localize Htl and require FGF signaling for disc-adherence.
A CD2:GFP-marked AMP cytonemes (arrows) localize Htl:mCherry (LexO-Htl:mCherry/+; htl-LexA, LexO-CD2:GFP/+). B Orthogonal AMP cytonemes localize Htl:GFPfTRG. C, C” nls:GFP-marked AMPs stained with anti-dpERK. DF’ CD8:RFP-marked clones (green, pseudo-colored) of control and dia-i-expressing AMPs showing the FGF signaling state (nuclear dpERK, red); D drawing depicting optical sections in E and E’, showing differences in numbers of dpERK positive clones between proximal (95.77% ±6.63 (±SD); 52 clones) and distal (3.19% ±3.62; 92 clones) AMP layers (p < 0.0001)). GL Effects of htl-i expression under either htl-Gal4 (G, G”, J, K) or htl>FRT>Gal4 (single cell clones; H, I, L, L’); G, G”, J, K Discs harboring either Lifeact:GFP-marked (G, G”) or nls:GFP-marked (J, K) htl-i-expressing AMPs showing selective loss of-orthogonal cytonemes (G, G”, cytoneme numbers/100 μm of AMP-disc interface: control = 36.9 ± 3.8 and htl-i = 0; p < 0.0001), cell polarity (H-K), AMP number and layers (J, J”), and induction of fusogenic responses (G, G”, H, J’, J”). I Graphs comparing orthogonal and lateral cytoneme numbers per single-cell AMP clone; Control proximal layer had only orthogonal cytonemes (average ± SD: 2.6 ± 0.9/cell; total n = 64 cytonemes/25 clones) and distal layer had only lateral cytonemes (5.6 ± 1.8/cell; total n = 105 cytonemes/19 clones); htl-i-expressing clones were distal and had only lateral cytonemes (6.1 ± 1.7/cell; total n = 146 cytonemes/24 clones); error bars: SD; also see Supplementary Table 2. K Graphs comparing AMP nuclear angles (Theta, θ) in control (n = 125 proximal/58 distal nuclei) and htl-i-expressing AMPs (n = 33 nuclei; p < 0.0001). L, L’ Discs with DAPI and PH3 staining showing relative location and orientation of nls:GFP-marked control (L) and htl-i-expressing (L’) AMP clones. C, C’, EL’ dashed arrow, distal cells/cytonemes; solid arrow, proximal cell/cytonemes; dashed line, AMP-disc junction; dashed double-sided arrow, space between the basal disc surface and the distal layer. Source data are provided as a “Source Data” file; p-values, unpaired two-tailed t-test. Genotypes: HS-Flp/+;UAS-X/+;htl>FRT>stop>FRT>Gal4/+ (E, E”, L). HS-Flp/+;UAS-X/+;htl>FRT>stop>FRT>Gal4/UAS-diaRNAi (F, F’); HS-Flp/+;UAS-X/UAS-htlRNAi;htl>FRT>stop>FRT>Gal4/+ (H, I, L’). X = FP as indicated. Scale bars: 20 μm; 30 μm (C, C”); 10 μm (E, E’).
Fig. 6
Fig. 6. Wing discs express Pyr and Ths in distinct zones to support different AMP subtypes.
A Spatial patterns of ths-Gal4-driven mCherryCAAX expression in the wing disc notum and the distribution of CD2:GFP-marked AMPs; arrow, ths expression-free hinge area; right panel, red channel from the left panel. B Scheme depicting the genome editing strategy to generate a pyr-Gal4 enhancer trap construct (see Supplementary Fig. 3). C, D Wing disc expression patterns of pyr-Gal4-driven CD8:GFP (C) and mCherryCAAX (D) and its spatial correlation to the AMP distribution (D arrow). EI Images showing CD8:GFP-marked ths-Gal4 and pyr-Gal4 expression zones in wing discs and their correlation with the localization of IFM-specific (high Vg, blue; low Cut, red; dashed arrow) and DFM-specific (high Cut, red; dashed arrow) progenitors; I schematic depicting the results of EH. JM” Images, showing effects of ths-i expression from ths source (ths-Gal4; mCherryCAAX-marked, blue) on the resident AMPs (AMP number, cytonemes, polarity, multi-layered organization, and dpERK signaling (red)) and non-resident AMPs (over the unmarked pyr-zone); dotted line (M”), ASP. NP’ Images showing effects of pyr-i expression from pyr source (pyr-Gal4, blue area) on the resident AMPs and non-resident AMPs (unmarked ths-expression zone). JP’ solid arrows, pyr expression zone; dashed arrow, ths-expression zone; dashed box, ROIs used to produce YZ views. Scale bars: 20 μm.
Fig. 7
Fig. 7. Cytoneme-mediated FGF exchange generates niche-specific asymmetric signaling.
A, B’ XY and YZ views (as indicated) of wing discs expressing mCherryCAAX and either Ths:GFP under ths-Gal4 (A, A”) or Pyr:GFP under pyr-Gal4 (B, B’). C, D’ Images of wing discs harboring mCherryCAAX-marked AMPs; wing discs expressing either Ths:GFP or Pyr:GFP as indicated. AD’ dashed arrow, signal in the source; arrow, non-autonomous punctate distribution in the AMP; *, non-expressing areas of the lacking signal distribution. E, F’ Wing discs expressing either Ths:GFP or Pyr:GFP as indicated, showing niche-specific effects of signal overexpression on proliferation of niche-resident and non-resident AMPs (nls:GFP marked); thick and thin dashed line, interface between AMPs and ths-expression and pyr-expression zones, respectively; dashed and solid arrows, effects on ths-expression and pyr-expression zones, respectively. GJ YZ views of wing discs expressing either Ths:GFP or Pyr:GFP as indicated and harboring mCherryCAAX-marked AMPs, showing disc-invading cytonemes receiving GFP-tagged signal (arrow) from the disc cells; arrowheads, localized signal enrichment in source cells. Scale bars: 20μm; 5 μm (H, H’).
Fig. 8
Fig. 8. Cytoneme-mediated FGF-specific organizations in ectopic niches.
AF Asymmetric FGF signaling and ligand-specific organization of DFM-specific (αCut, blue) and IFM-specific (αVg, blue) AMPs when dpp-Gal4 ectopically expressed either Pyr:GFP or Ths:GFP (dpp-Gal4>UAS-Pyr:GFP or Ths:GFP,>UAS-mCherryCAAX) in the wing disc pouch as illustrated in A; A Drawing depicting the experiments and results in BF; dashed line, AMP-disc junctions; B’ XZ section from ROI in B; dashed and solid arrows, Cut and Vg expressing AMPs, respectively; double-sided arrow (D), proximal zone of Pyr:GFP expressing niche lacking Vg-positive AMPs. G, G”’ Wing disc pouch expressing Ths:GFP under dpp-Gal4 and showing mCherryCAAX-marked AMP and AMP cytonemes; *, proximal AMPs with orthogonal polarity and cytonemes; G”, G”, single optical sections showing Ths:GFP on cytonemes (arrowheads); dashed lines, disc epithelium. H, H’ Wing disc pouch expressing Pyr:GFP under dpp-Gal4 and showing mCherryCAAX-marked AMP and AMP cytonemes; arrowhead, Pyr:GFP on cytonemes. I, J Models for the niche-specific asymmetric signaling and organization via cytonemes-mediated Pyr and Ths signaling (I) and signaling feedbacks reinforcing the cytoneme polarity and adhesion (J). Scale bars: 20 μm.

References

    1. Yamashita YM, Yuan H, Cheng J, Hunt AJ. Polarity in stem cell division: asymmetric stem cell division in tissue homeostasis. Cold Spring Harb. Perspect. Biol. 2010;2:a001313. - PMC - PubMed
    1. Losick VP, Morris LX, Fox DT, Spradling A. Drosophila stem cell niches: a decade of discovery suggests a unified view of stem cell regulation. Dev. Cell. 2011;21:159–171. - PMC - PubMed
    1. Florian MC, Geiger H. Concise review: polarity in stem cells, disease, and aging. Stem Cells. 2010;28:1623–1629. - PMC - PubMed
    1. Morrison SJ, Spradling AC. Stem cells and niches: mechanisms that promote stem cell maintenance throughout life. Cell. 2008;132:598–611. - PMC - PubMed
    1. Venkei ZG, Yamashita YM. Emerging mechanisms of asymmetric stem cell division. J. Cell Biol. 2018;217:3785–3795. - PMC - PubMed

Publication types

MeSH terms

Substances

LinkOut - more resources