. 2022 Mar 4;13(1):1163.
doi: 10.1038/s41467-022-28720-y.

White matter integrity in mice requires continuous myelin synthesis at the inner tongue

Affiliations

White matter integrity in mice requires continuous myelin synthesis at the inner tongue

Martin Meschkat et al. Nat Commun. .

Abstract

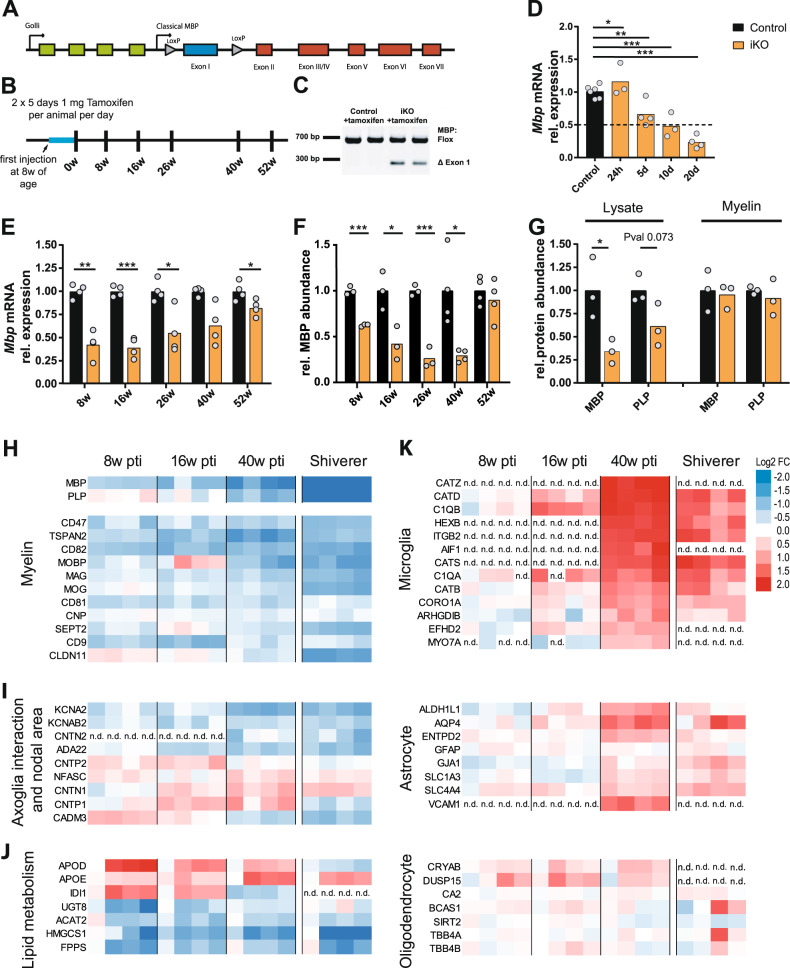
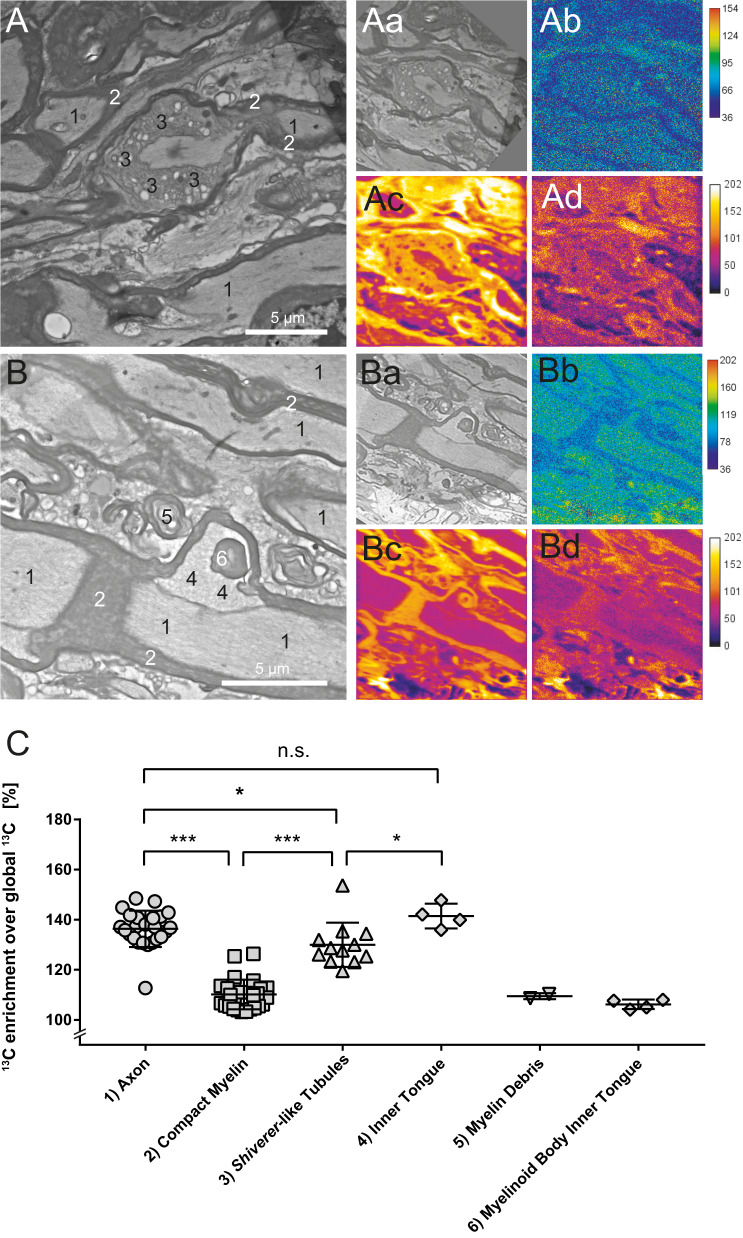
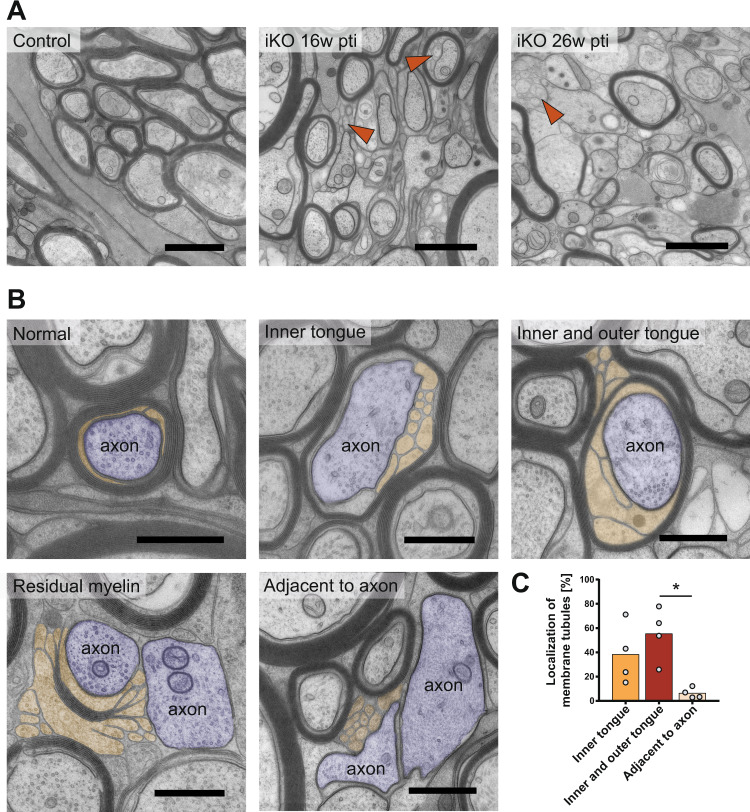
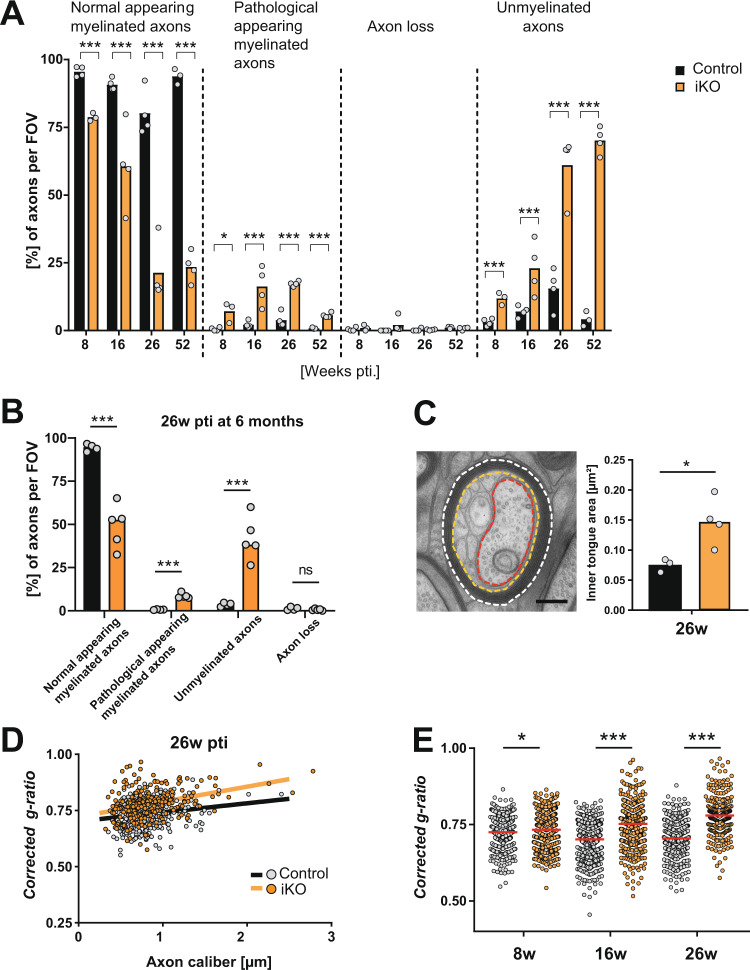
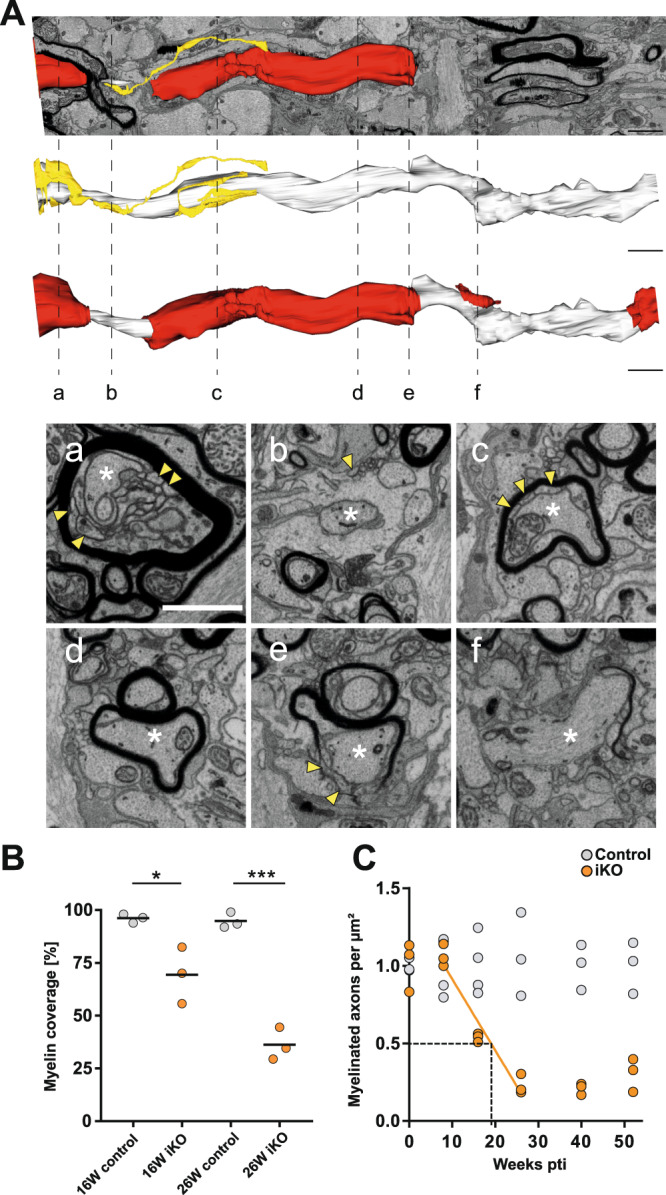
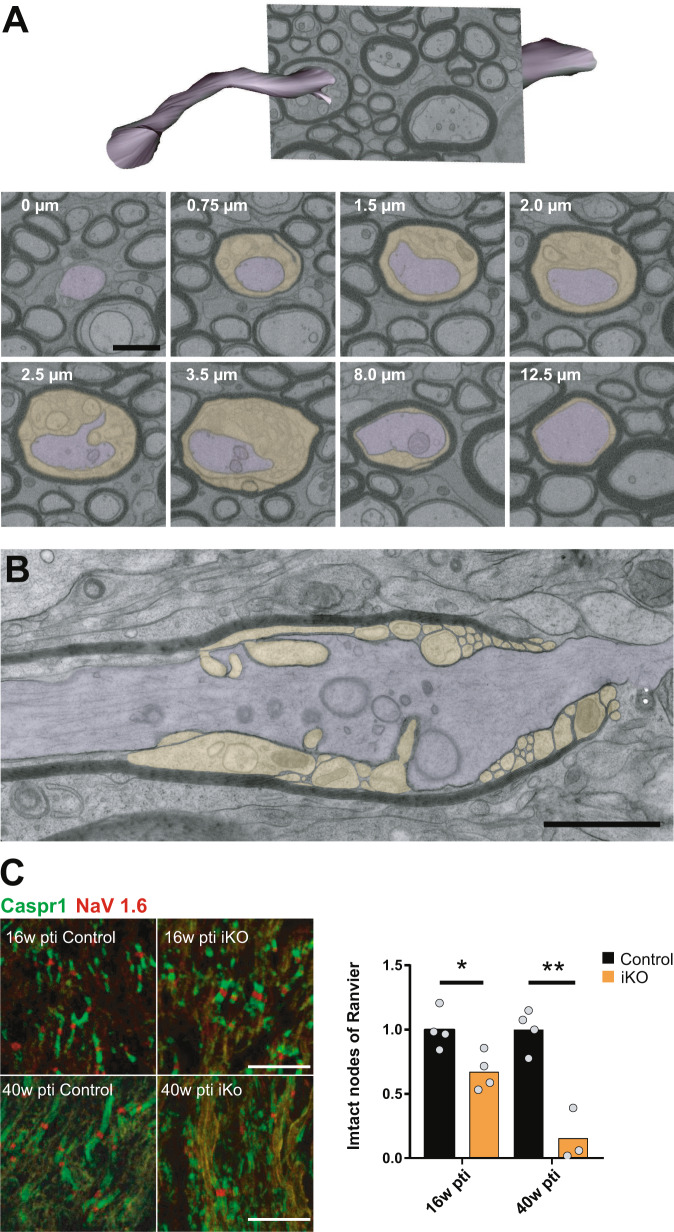
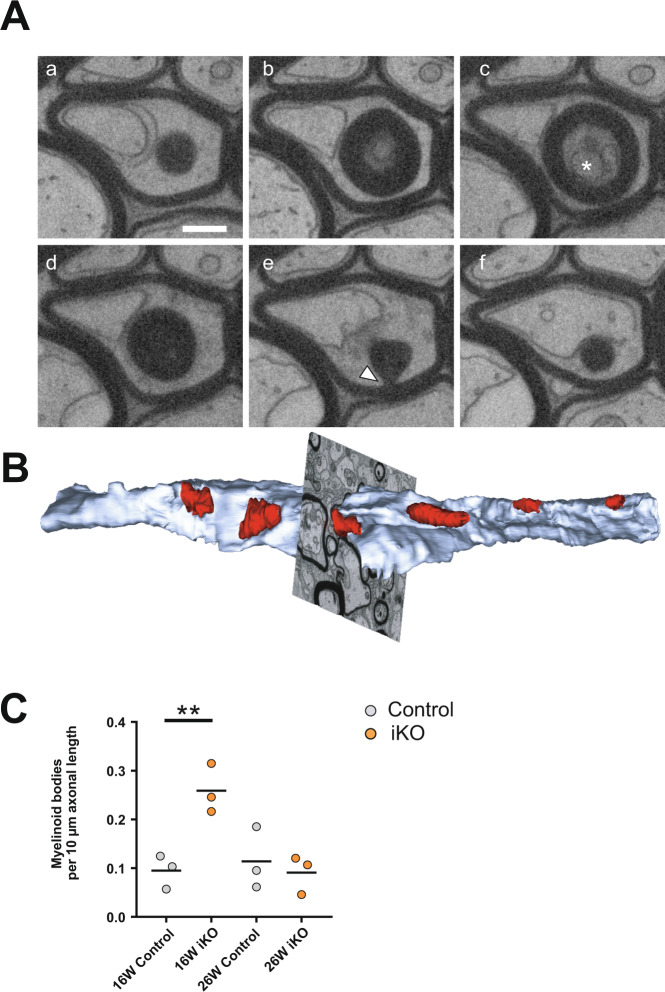
Myelin, the electrically insulating sheath on axons, undergoes dynamic changes over time. However, it is composed of proteins with long lifetimes. This raises the question how such a stable structure is renewed. Here, we study the integrity of myelinated tracts after experimentally preventing the formation of new myelin in the CNS of adult mice, using an inducible Mbp null allele. Oligodendrocytes survive recombination, continue to express myelin genes, but they fail to maintain compacted myelin sheaths. Using 3D electron microscopy and mass spectrometry imaging we visualize myelin-like membranes failing to incorporate adaxonally, most prominently at juxta-paranodes. Myelinoid body formation indicates degradation of existing myelin at the abaxonal side and the inner tongue of the sheath. Thinning of compact myelin and shortening of internodes result in the loss of about 50% of myelin and axonal pathology within 20 weeks post recombination. In summary, our data suggest that functional axon-myelin units require the continuous incorporation of new myelin membranes.


Conflict of interest statement

The authors declare no competing interests.

Figures

Fig. 1
Fig. 1. Deletion of the Mbp gene in mature oligodendrocytes and subsequent molecular changes.
A Schematic of Mbp gene structure with floxed exon 1. B Experimental design and time points of analysis. C Floxed exon 1 of the classical Mbp locus is deleted upon tamoxifen injection using the inducible Plp-CreERT2 mouse line. This PCR result was confirmed in n = 3 mice (Leone et al.). D, E Relative Mbp mRNA abundance in brain lysate at the indicated time points post tamoxifen injection (pti) in male mice. The stippled line indicates a reduction to 50%. D Two-tailed unpaired t test: control vs iKO: 24 h pti: p = 0,0259; 5 days pti: p = 0.035; 10 days pti: p = 0.0016; 20 days pti: p < 0.0001. E Two-tailed unpaired t test: control vs iKO: 8 weeks pti: p = 0.01972; 16 weeks pti: p = 0.00655; 26 weeks pti: p = 0.042; 40 weeks pti: p = 0.0598; 52 weeks pti: p = 0.0373. F Relative abundance of MBP in brain lysate at the indicated time points by immunoblot analysis. multiple t tests: control vs iKO: 8 weeks pti (female mice): p = 0.0002; 16 weeks pti (male and female mice): p = 0.022; 26 weeks pti (female mice): p = 0.0006; 40 weeks pti (male mice): p = 0.012; 52 weeks pti (male mice): p = 0.47. G Immunoblot analysis of MBP and PLP abundance in lysate and myelin fraction 26 weeks pti in male mice. The protein abundance in the myelin fraction is unchanged (see also Figs. S1 and S2). Two-tailed unpaired t test: control vs iKO in brain lysate: MBP abundance: p = 0.032; PLP abundance: p = 0.073; control vs iKO in myelin purification: MBP abundance: p = 0.7664; PLP abundance: p = 0.5. (p  < 0.05 (*), p < 0.01 (**), p < 0.001 (***)). Single data points in the graphs represent individual mice (n-number). Source data are provided with this paper. HK Heatmaps of the normalized abundance of proteins selected from the quantitative proteome analysis of whole optic nerve in iKO at the indicated time points and shiverer mice at the age of 10 weeks (all male mice). Myelin proteins (H), proteins involved in axo-glia interaction and present in the node area (I), and proteins of lipid metabolism (J) are depicted. Markers of microglia, astrocytes, and oligodendrocytes (K) were assigned to the cell type according to Zhang et al.. Shown are the averages of two technical replicates from N = 4 mice, optic nerve lysate, 8, 16, and 40 weeks pti and shiverer at 10 weeks of age. For normalization, iKO abundance values were divided by the mean of the corresponding control group with the color code representing downregulation (blue) or upregulation (red) as log2-transformed fold-change. Abundance values for MBP and PLP were derived from a dataset recorded in the MSE acquisition mode dedicated to correct quantification of exceptionally abundant proteins (see also Fig. S3–S5, Supplementary Table 1, and “Methods” for details), n.d. not detected.
Fig. 2
Fig. 2. Determination of myelin turnover by 13C-lysine feeding and NanoSIMS imaging in Mbp iKO.
Longitudinal spinal cord TEM section of iKO (n = 1, male) fed for 45 days with 13C-Lys diet and sacrificed after 1 week of chase with non-labeled control diet at 26 weeks pti. At the indicated structures (numbered 1–6 in AC), small regions of interest (ROIs) were sampled manually on the overlaid NanoSIMS isotopic maps and the enrichment of 13C was calculated from the 13C14N/12C14N isotopic ratio of every pixel in the ROIs. A Tubular–vesicular enlargement of the inner tongue. B A myelinoid body is visible in the inner tongue. Aa, Ba Aligned TEM image; Ab, Bb image ratio of 13C14N/12C14N; Ac, Bc 12C14N NanoSIMS image; Ad, Bd 13C14N NanoSIMS image. C 13C enrichment of the sampled ROI. Every data point (representing the n—number used for statistical analysis) corresponds to the average value of the sampled ROI drawn manually on the analyzed structure indicated in A, B. Numbers on the TEM image correspond to the sampled structures in C. Two-tailed unpaired t test: axon vs compact myelin: p < 0.0001; axon vs shiverer-like tubules p = 0.0262; axon vs inner tongue p = 0.1933; compact myelin vs shiverer-like tubules: p < 0.0001; shiverer-like tubules vs inner tongue: p = 0.0287; (mean +/− SD, p <  0.05 (*), p <  0.001 (***)). Source data are provided with this paper. Scale bars: A, B 5 µm.
Fig. 3
Fig. 3. Demyelination and emergence of shiverer-like membrane tubules in Mbp iKO mice.
A Electron micrographs of high-pressure frozen optic nerve showing progressive demyelination. Arrowheads indicate shiverer-like tubules. B Illustration of myelin pathology: membrane tubules (colored in orange) emerge at the inner tongue of iKO myelin. Tubulations at the outer tongue of a myelinated axon (colored in purple) are found associated with tubulations also at the inner tongue. At places where most compact myelin is lost, membrane tubules loop out and leave a partially demyelinated axon behind. Tubules are also found next to demyelinated axons. C Quantification of the occurrence of membrane tubules. Preparation by high-pressure freezing (HPF) and freeze substitution (FS), optic nerve 16 weeks pti, n = 4 iKO animals, 4 random sampled micrographs covering in total 1.600 µm2 were used for quantification (one-way Anova with Tukey’s multiple comparison test: inner tongue vs adjacent to axon: p = 0.1015; inner tongue vs inner and outer tongue: p = 0.4545; adjacent to axon vs inner and outer tongue: p = 0.0146 (male and female mice), p < 0.05 (*). Source data are provided with this paper. Scale bars A 1 µm; B 500 nm.
Fig. 4
Fig. 4. Thinning and loss of compact myelin after Mbp ablation.
A Quantification of phenotypes at the indicated time points. Analysis was performed on optic nerve cross-sections on a total area of >330 µm2 with >200 axons per animal, all axons in the field of view (FOV)  were counted. Single data points in graphs represent individual mice (n-number) (two-tailed unpaired t test, p < 0.05 (*), p < 0.001 (***)). Exact p values are stated in the respective Source data file. B Quantification of phenotypes 26 weeks pti in optic nerve of mice induced at an old age of 6 months (multiple unpaired t test, control vs iKO (all male mice)): normal appearing myelinated axons: p = 0.0002; pathological appearing myelinated axons: p < 0.0001; unmyelinated axons: 0.00053; axon loss: p = 0.222; p < 0.001 (***). C Illustration of corrected g-ratio measurement. Three lines are drawn for the area measurement: the outline of the fiber (stippled white line), an outline of the inner border of the compact myelin (orange), and the axon (red). Scale bar: 200 nm. The area of the inner tongue was subtracted from the total fiber area before the calculation of the diameter (see “Methods”). Inner tongue area is increased in iKO (n = 4) compared to control (n = 3) in optic nerve 26 weeks pti. Measured on TEM cross-sections, at least 150 axons per mouse were analyzed. Unpaired two-tailed t test; p = 0.0294 (p < 0.05 (*)). D Scatterplot depicting the corrected g-ratios at 26 weeks pti, 150 axons per mouse were analyzed. E Corrected g-ratio measurements reveal a progressive decrease in compact myelin at the indicated time points, axon calibers pooled (Kolmogorow–Smirnow Test; 8 weeks pti: p = 0.0155; 16 weeks pti: p < 0.0001; 26 weeks pti: p < 0.0001; (p < 0.05 (*), p < 0.001 (***)) with an n-number of 3 mice for each genotype except at 26 weeks pti with 4 cKO animals. Source data are provided with this paper.
Fig. 5
Fig. 5. Demyelination by internode shortening in Mbp iKO mice.
A 3D reconstruction of an image stack acquired by focused ion beam-scanning electron microscopy (FIB-SEM) at 26 weeks pti in the optic nerve of an iKO mouse (shown in Supplementary Movie 1): Yellow: non-compact myelin tubules, white: axon, (white asterisk) red: myelin. At stippled lines, the indicated corresponding image from the stack is shown. Yellow arrowheads point at myelin tubules. Internodes are shortened and fragmented. B Quantification of myelin coverage on 3D volumes of iKO and control mice (n = 3) 16 weeks pti and (n = 3) 26 weeks pti with >90 axons per mouse in the percentage of axonal length within the FIB-SEM volume that is myelinated. Unpaired two-tailed t test (16 weeks pti p = 0.027; p < 0.05 (*); 26 weeks pti p = 0.0003; p < 0.001 (***), male and female mice). C Myelinated axons counted per area on TEM images and normalized to control (n = 3). The regression line indicates a 50% loss of myelinated axons within 19–20 weeks pti. At 26 weeks pti, demyelination is maximal. Source data are provided with this paper. Scale bars: A 2 µm; a 1 µm.
Fig. 6
Fig. 6. Juxtaparanodal myelin tubulation and loss of nodal organization.
A Segmentation of axon and myelin tubules in an image stack acquired by FIB-SEM in the optic nerve of iKO 26 weeks pti (shown in Supplementary Movie 2). The distance along the internode is indicated in the images. Membrane tubules emerge at the juxtaparanode (0.75–3.5 µm) while most of the internode is unaffected. B Longitudinal TEM section reveals the juxtaparanode localization of the tubules and the detachment of the paranodal loops. This phenotype was observed independently in two groups of female mice (n = 7 controls; n = 10 iKOs and n = 3 controls; n = 5 iKO) and two groups of male mice (n = 3 controls; n = 5 iKOs and n = 2 controls; n = 4 iKOs). C Confocal light microscopy of immunofluorescence staining of the nodal marker NaV1.6 and paranodal marker Caspr1 on optic nerve cryosections reveals loss of functional nodes of Ranvier (two-tailed unpaired t test, control vs iKO; 16 weeks pti: p = 0.0207; 40 weeks pti: p = 0.0051 (p < 0.05 (*), p < 0.01 (**)). Source data are provided with this paper. Scale bars: 500 nm (A, B), 10 µm (C).
Fig. 7
Fig. 7. Myelinoid bodies at the inner tongue.
A Electron micrographs selected from a FIB-SEM image stack reveal the presence of a myelinoid body (asterisk) at the inner tongue 16 weeks pti in high-pressure frozen optic nerve. This myelinoid body is connected to the myelin sheath (indicated by arrowhead). This observation was made in a group of male mice (n = 4 for both genotypes) and a group of female mice (n = 3 for both genotypes). B Segmentation of myelinoid bodies at the inner tongue from a FIB-SEM image stack (shown in Supplementary Movie 4) acquired 26 weeks pti (blue: axon, red: myelinoid bodies). C The number of myelinoid bodies per µm axonal length is increased 16 weeks pti and not significantly different 26 weeks pti. Quantification on 3D volumes with >90 axons per mouse (n = 3) (two-tailed unpaired t test, control vs iKO: 16 weeks pti: p = 0.0097; 26 weeks pti: p = 0.1838: p < 0.01 (**)). Source data are provided with this paper. Scale bar: 500 nm.

Similar articles

Cited by

References

    1. Emery B. Regulation of oligodendrocyte differentiation and myelination. Science. 2010;330:779–782. - PubMed
    1. Yeung MS, et al. Dynamics of oligodendrocyte generation and myelination in the human brain. Cell. 2014;159:766–774. - PubMed
    1. Crawford AH, Stockley JH, Tripathi RB, Richardson WD, Franklin RJ. Oligodendrocyte progenitors: adult stem cells of the central nervous system? Exp. Neurol. 2014;260:50–55. - PubMed
    1. Hughes EG, Kang SH, Fukaya M, Bergles DE. Oligodendrocyte progenitors balance growth with self-repulsion to achieve homeostasis in the adult brain. Nat. Neurosci. 2013;16:668–676. - PMC - PubMed
    1. Young KM, et al. Oligodendrocyte dynamics in the healthy adult CNS: evidence for myelin remodeling. Neuron. 2013;77:873–885. - PMC - PubMed