. 2022 Apr;21(4):e13562.
doi: 10.1111/acel.13562. Epub 2022 Mar 4.

Different responses to DNA damage determine ageing differences between organs

Affiliations

Different responses to DNA damage determine ageing differences between organs

Maria Vougioukalaki et al. Aging Cell. 2022 Apr.

Abstract

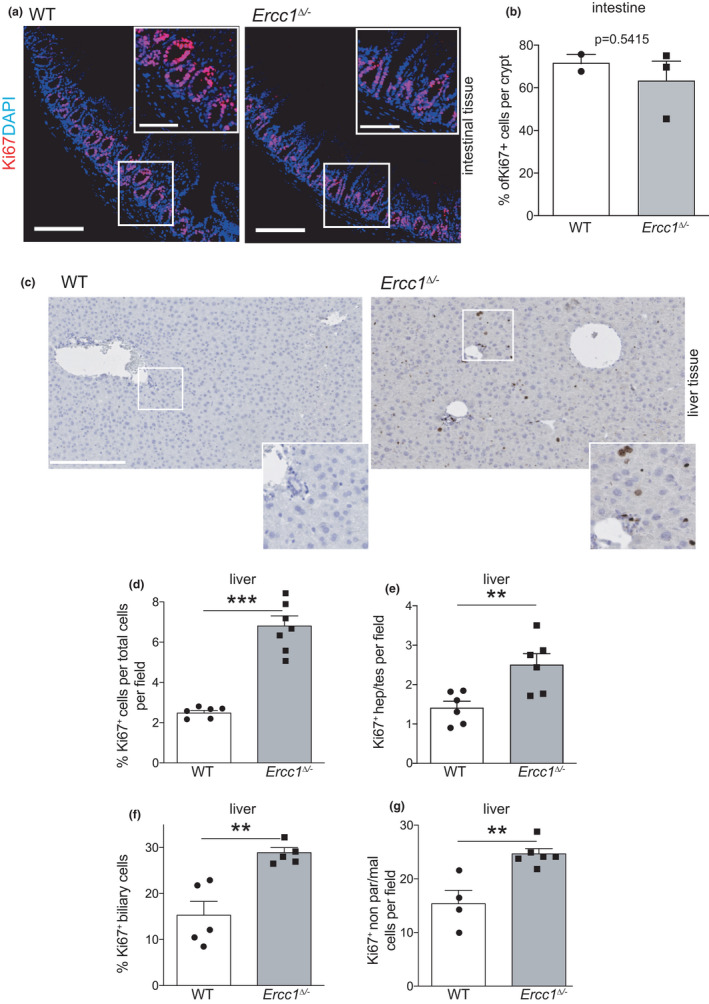
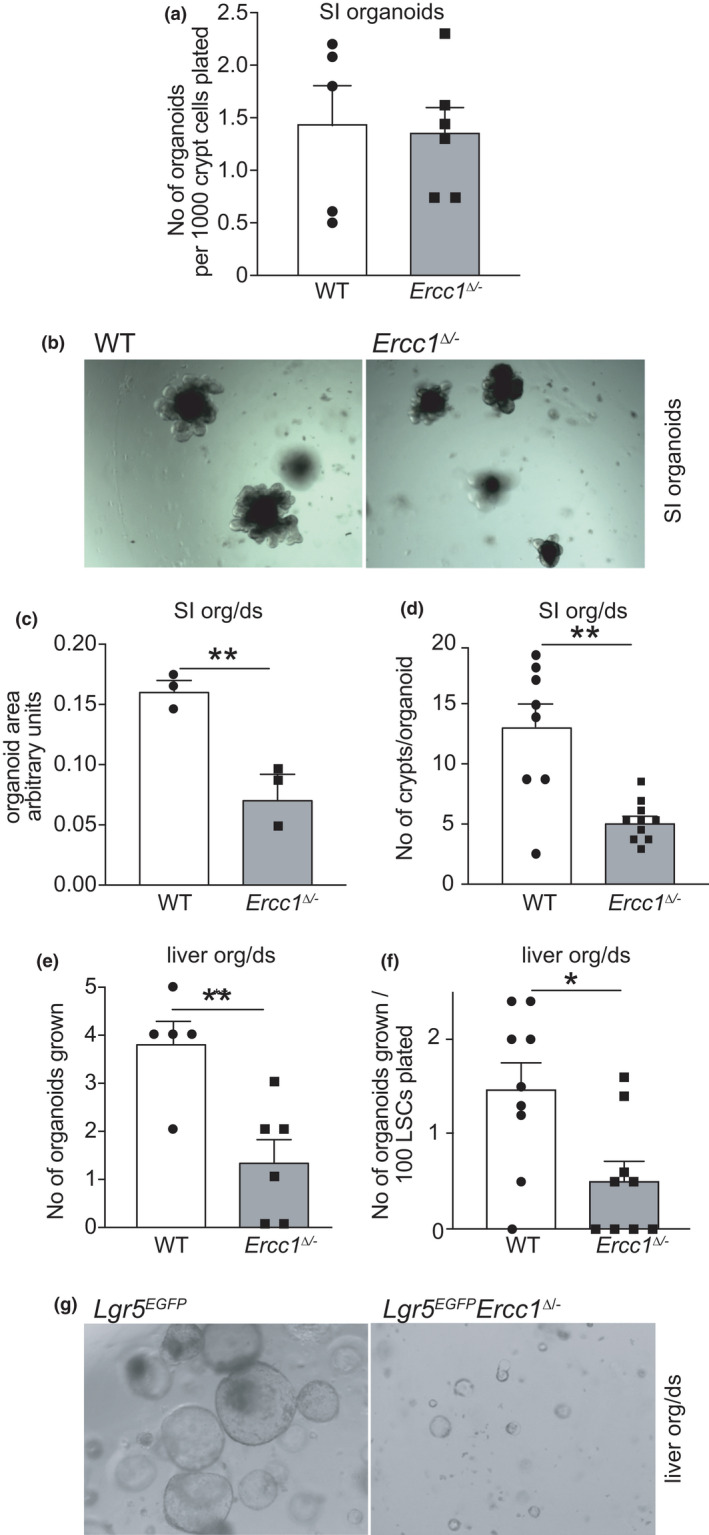
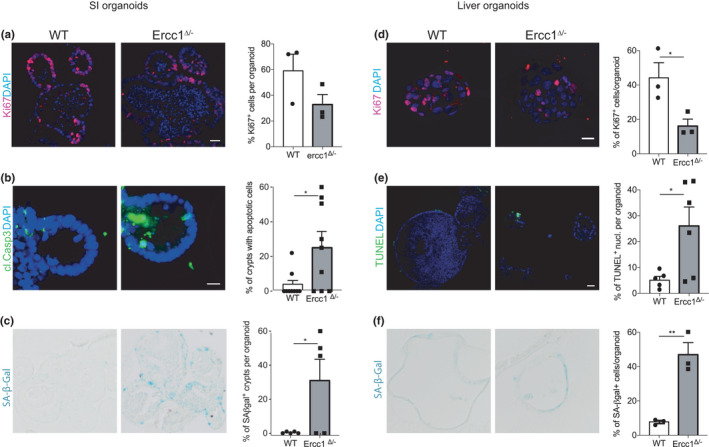
Organs age differently, causing wide heterogeneity in multimorbidity, but underlying mechanisms are largely elusive. To investigate the basis of organ-specific ageing, we utilized progeroid repair-deficient Ercc1Δ/- mouse mutants and systematically compared at the tissue, stem cell and organoid level two organs representing ageing extremes. Ercc1Δ/- intestine shows hardly any accelerated ageing. Nevertheless, we found apoptosis and reduced numbers of intestinal stem cells (ISCs), but cell loss appears compensated by over-proliferation. ISCs retain their organoid-forming capacity, but organoids perform poorly in culture, compared with WT. Conversely, liver ages dramatically, even causing early death in Ercc1-KO mice. Apoptosis, p21, polyploidization and proliferation of various (stem) cells were prominently elevated in Ercc1Δ/- liver and stem cell populations were either largely unaffected (Sox9+), or expanding (Lgr5+), but were functionally exhausted in organoid formation and development in vitro. Paradoxically, while intestine displays less ageing, repair in WT ISCs appears inferior to liver as shown by enhanced sensitivity to various DNA-damaging agents, and lower lesion removal. Our findings reveal organ-specific anti-ageing strategies. Intestine, with short lifespan limiting time for damage accumulation and repair, favours apoptosis of damaged cells relying on ISC plasticity. Liver with low renewal rates depends more on repair pathways specifically protecting the transcribed compartment of the genome to promote sustained functionality and cell preservation. As shown before, the hematopoietic system with intermediate self-renewal mainly invokes replication-linked mechanisms, apoptosis and senescence. Hence, organs employ different genome maintenance strategies, explaining heterogeneity in organ ageing and the segmental nature of DNA-repair-deficient progerias.

Keywords: DNA damage response; ERCC1; adult stem cells; genome maintenance; liver; nucleotide excision repair; organoids; small intestine.


Conflict of interest statement

The authors declare no conflict of interest.

Figures

FIGURE 1
FIGURE 1
Aging‐related phenotypic features of small intestinal and liver from progeroid Ercc1Δ /− mice. (a) Intestinal tissue from 15‐week‐old Ercc1Δ /− and control mice stained with haematoxylin and eosin. Bars 200 μm. (b, c) Intestinal length (b, n = 2) and perimeter (c, n = 4) from 15‐week‐old mice of indicated genotypes. (d) Jejunal crypt density of 15‐week‐old wt and mutant mice. Crypts were counted on paraffin‐embedded 4μm slices of intestinal tissue. The number of crypts of progeroid Ercc1Δ /− mice is not significantly reduced in spite of the overall cachexia and decreased organ size, p = 0.7328 (n = 3). (e) Cell density in jejunal crypts of 15‐week‐old wt and Ercc1Δ /− mice. Cells were counted on DAPI stained 4μm intestinal tissue slices as in (d), p = 0.5415 (n = 3 mice). (f) Immunofluorescent images of small intestine crypt and villi from sections stained for apoptosis (TUNEL), counterstained with DAPI. Bars 50 μm. (g, h) Apoptosis index in crypts (g) and villi (h), (n = 3 mice). (i) Liver tissue from 15‐week‐old Ercc1Δ /− and wt mice assessed for apoptosis (TUNEL). Red arrows: TUNEL+ cells; black cut‐out depicts a TUNEL+ large hepatocyte. Bars 100 μm. (j–m) Apoptosis index in the liver, parenchymal, non‐parenchymal (l), and biliary cell (m) population of 15‐week‐old wt and mutant mice (n = at least 3 mice for WT, n = 5 mice for mutant groups). Quantification of TUNEL+ nuclei was performed on DAB‐stained liver sections. Data: mean ± SEM. *p < 0.05, **p < 0.01
FIGURE 2
FIGURE 2
Steady‐state regenerative potential of intestine and liver of progeroid Ercc1Δ /− mice. (a) Immunofluorescence of intestinal tissue sections from 15‐week‐old wt and mutant mice stained for proliferation marker Ki67, nuclei counterstained with DAPI. Insets here and in other panels are digitally magnified images. Bars 10 μm (5 μm for insets). (b) Steady‐state proliferative index of small intestine from 15‐week‐old Ercc1Δ /− (n = 3) and control mice (n = 2). (c) Immunohistochemical staining for proliferation marker Ki67 of liver from 15‐week‐old Lgr5EGFPErcc1Δ /− and wt mice. Nuclei counterstained with haematoxylin. Bars 250 μm. (d) Proliferative index of Lgr5EGFPErcc1Δ /− liver. Quantitation of Ki67+ cells per total cells in a field as represented in (c) from 15‐week‐old mutant and wt mice. More than 5 fields were quantified from n = 7 mice per genotype. (e–g) Proliferative index of various cell populations (identified on morphology and location) in progeroid Lgr5EGFPErcc1Δ /− and wt liver. Note that nearly all cell populations in Ercc1Δ /− liver show increased proliferation. Over 5 fields were quantified from at least 4 mice per genotype. Data: mean ± SEM, **p < 0.01, ***p < 0.001
FIGURE 3
FIGURE 3
Characterization of small intestinal and liver stem cell populations in progeroid Ercc1Δ /− mice. (a) Enhanced green fluorescent protein (EGFP) immunostaining in crypts of the small intestine from 15‐week‐old mutant and wt mice. Nuclei counterstained with DAPI. Bars 10 μm. (b) Quantitation of intestinal crypt cells expressing high levels of GFP (GFPhi) by flow cytometry of 15‐week‐old wt (n = 4) and Ercc1Δ /− (n = 3) mice. (c) Quantitation of the total EGFP‐expressing (EGFP+) cell population in small intestinal crypts of wt (n = 4) and mutant (n = 3) mice by flow cytometry. (d) Ratio of crypt cells expressing low (EGFPlow, i.e., downstream progenitor population) versus high levels of EGFP (GFPhi, i.e., stem cells) in the intestine of the indicated mice. Each column represents collectively the values for individual crypts for 3 mice per genotype. (e) Quantitation of the GFPhi intestinal population that expresses Ki67 proliferation marker from immunofluorescently stained tissue of 15‐week‐old mice of the indicated genotypes (n = 3 mice per genotype). Note the increase of proliferative stem cells in progeroid Ercc1 mutant mice. (f) Immunofluorescence images of paraffin‐embedded intestinal tissue from 15‐week‐old Lgr5EGFP Ercc1Δ /− and wt mice, stained for EGFP and Ki67. Bars 10 μm. (g) Immunofluorescent staining for Sox9 expression (green) in bile duct cells of liver sections from 15‐week‐old Lgr5EGFP Ercc1Δ /− and wt mice, along with Ki67 (red). Bar 10 μm. (h) Percentage of Sox9+ bile cell population per total cells in liver ducts of 15‐week‐old Ercc1Δ /− and wt mice, quantified from 4μm liver sections stained as in (g) (n = 3 mice). (i) Average number of cells per bile duct in livers of 15‐week‐old Ercc1Δ /− and wt mice, quantified from 4 μm liver sections. Data represent means with SD from quantitation of cells in round bile ducts from 3 mice per genotype and at least 10 bile ducts per mouse. (j) EGFP‐expressing cells in the liver of Lgr5EGFPErcc1Δ /− (n = 3) and control (n = 2) mice. (k) EGFP + Lgr5‐marked stem cells in liver of 15‐week‐old Lgr5EGFPErcc1Δ /− and control mice stained for GFP. Bars 10 μm. Data: mean ± SEM unless otherwise specified. *p < 0.05, ****p < 0.0001
FIGURE 4
FIGURE 4
Ex vivo culture of intestinal and liver SCs from Ercc1Δ /− mice. (a) Organoids grown from intestinal crypt cell suspensions, derived from 15‐week‐old Ercc1Δ /− and wt mice, after 9 days in culture, p = not significant (n = 5 mice per genotype). (b) In vitro cultures of freshly isolated crypts from 15‐week‐old mice of the indicated genotypes. Images after 9 days in culture. (c) Average organoid size of the indicated genotypes after 9 days in culture (n = 3 independent cultures derived from different mice per group). (d) Average number of crypts budded in organoids of the indicated genotypes after 9 days in culture (at least two cultures for each mouse and 3 mice per genotype). (e) Number of organoids grown after plating bile cell containing liver cell suspensions, derived from 15‐week‐old Ercc1Δ /− mice and wt controls (at least two cultures for each mouse and 3 mice per genotype). Organoids were counted at Day 7 of culture. (f) Number of liver organoids grown in secondary cultures, after plating single liver stem cells derived from a primary organoid culture (at least three cultures were measured for each mouse and 3 mice per genotype). Organoids were counted at Day 7 of culture. (g) In vitro cultures of liver organoids grown from bile cell suspensions derived from livers of 15‐week‐old mice of the indicated genotypes. Images were taken after 7 days in culture. Data: mean ± SEM. *p < 0.05, **p < 0.01
FIGURE 5
FIGURE 5
Cell fate phenotypes in Ercc1Δ /− small intestinal and liver organoids. (a) Proliferation index of Ercc1Δ /− intestinal organoids. Immunostaining for Ki67 (red) in Ercc1Δ /− and wt control SI organoids in medium without Wnt3a supplementation. Bar 10 μm. Right, quantitation of proliferative, Ki67+ cells in organoids of the indicated genotypes (n = 3 mice per genotype). (b) DNA damage responses in Ercc1Δ /− SI organoids. Images of crypts of organoids, derived from 15‐week‐old Ercc1Δ /− and control mouse intestines, immunostained for cleaved Caspase‐3. Bar 10 μm. SI organoid crypts containing TUNEL+ cells. Each dot represents the measurement of individual organoid cultures and data from a sample size of 3 mice per genotype. (c) Images of SI organoids from 15‐week‐old mutant and wt mice, stained for senescence‐associated β‐galactosidase (SA‐βGal) activity. Crypts positive for SA‐βGal in organoids of the indicated genotypes. Each dot individual culture of organoids, data from 3 mice per genotype. (d) Immunostaining for Ki67 of liver organoids from 15‐week‐old Ercc1Δ /− and wt mice. Bar 20μm. Proliferation index of organoids (n = 3 mice per genotype). (e) Apoptosis in Ercc1Δ /− and wt liver organoids from 15‐week‐old mice. Bar 50 μm. Percentage TUNEL+ cells per organoid (n = 5 mice per genotype). (f) Histochemical staining for SA‐β‐Gal activity. Percentage of SA‐β‐Gal+ cells per Ercc1Δ /− and wt liver organoid (n = 3 mice per genotype). Data: mean ± SEM. *p < 0.05, **p < 0.01
FIGURE 6
FIGURE 6
Differential responses of repair‐proficient liver and intestinal stem cells to exogenous damage. (a) Schematic of experimental set‐up for organoid formation assay following DNA damage induction. For each genotoxic agent, cultures from 2 wt mice were used and for each mouse, organoids grown in triplicates were quantified. (b‐d) Clonogenic survival of wt liver and intestinal stem cells upon UVC‐exposure (b); 2 h. treatment with the indicated concentrations of illudin S, which is only removed by transcription‐coupled repair (c) and the DNA‐crosslinking agent cisplatin (d). Organoids from single stem cell containing cultures were counted 5 days after treatment (n = 2 mice per group). (e, f) Number of stem cells that have lost cytochrome c at various time points following treatment with cisplatin (e) or illudin S (f). Data: means and SD of replicate samples from 2 mice in total. (g) Quantitation of 6,4‐photoproducts’ immunosignal in organoid stem cells at the indicated time points following UVB irradiation. Plotted is the percentage of remaining fluorescence relative to the 5 min time point from at least 500 nuclei of separate organoids of each mouse (3 mice per time point). p‐values were calculated using Student's t test. Data: mean ± SEM unless otherwise specified. **p < 0.01, ***p < 0.001, ****p < 0.0001
FIGURE 7
FIGURE 7
Tentative model for organ‐specific anti‐ageing strategies. Remaining cellular lifespan largely determines which DNA damage response strategy is preferred by organs/tissues to counteract ageing. For intestine, cell death is preferred, as cells have to function only for 3–5 days and cell loss can be compensated by increased (stem) cell proliferation. Obviously, this is very energy‐demanding (daily a human body produces 200 gram intestinal epithelium) and unaffordable for many organs. Other tissues with continuous but slower cell renewal such as the hematopoietic system (average cell turn‐over ~2 months) rely mostly on replication‐related repair (such as NHEJ/HR and XLR) and apoptosis (Hoeijmakers, 2001). Skin, as an organ with high UV exposure and also intermediate cell renewal combines GG‐NER and TCR with apoptosis and premature differentiation of damaged stem cells (Kim et al., 2020). Finally, tissues with slow (e.g., liver, on average ~1 year) or no cell turn‐over (e.g., the central nervous system, life time) depend on constitutive (cell cycle independent) DNA repair systems, most notably TCR to permit long‐term unperturbed use of the transcribed compartment of the genome, needed for sustained proper cellular functioning. Global genome repair systems (base and nucleotide excision repair) are probably important for all organs and tissues for preventing mutagenesis and permit survival. TLS allows replication bypass of lesions to rescue stalled replication and cellular proliferative capacity, however, at the expense of elevated mutagenesis and cancer risk. Cellular (replicative) senescence opposes cell death in most organs. This model explains the segmental nature of repair‐deficient progeroid syndromes, in which inherited deficiencies in different repair systems are associated with a different subset of organs and tissues displaying accelerated ageing. 1Not including mismatch repair, which is a replication error correction system, important for preventing mutations and cancer, particularly in highly proliferative tissues such as intestine. GG‐NER, global genome nucleotide excision repair; NHEJ/HR, Non‐Homologous End‐Joining/Homologous recombination repair two pathways for double strand break repair; TCR, transcription‐coupled repair; TLS, translesion synthesis; XLR, cross‐link repair

References

    1. Ahmad, A. , Robinson, A. R. , Duensing, A. , van Drunen, E. , Beverloo, H. B. , Weisberg, D. B. , Hasty, P. , Hoeijmakers, J. H. , & Niedernhofer, L. J. (2008). ERCC1‐XPF endonuclease facilitates DNA double‐strand break repair. Molecular and Cellular Biology, 28, 5082–5092. 10.1128/MCB.00293-08 - DOI - PMC - PubMed
    1. Alyodawi, K. , Vermeij, W. P. , Omairi, S. , Kretz, O. , Hopkinson, M. , Solagna, F. , Joch, B. , Brandt, R. M. C. , Barnhoorn, S. , Vliet, N. , Ridwan, Y. , Essers, J. , Mitchell, R. , Morash, T. , Pasternack, A. , Ritvos, O. , Matsakas, A. , Collins‐Hooper, H. , Huber, T. B. , … Patel, K. (2019). Compression of morbidity in a progeroid mouse model through the attenuation of myostatin/activin signalling. Journal of Cachexia, Sarcopenia and Muscle, 10, 662–686. 10.1002/jcsm.12404 - DOI - PMC - PubMed
    1. Andressoo, J.‐O. , Mitchell, J. R. , de Wit, J. , Hoogstraten, D. , Volker, M. , Toussaint, W. , Speksnijder, E. , Beems, R. B. , van Steeg, H. , Jans, J. , de Zeeuw, C. I. , Jaspers, N. G. J. , Raams, A. , Lehmann, A. R. , Vermeulen, W. , Hoeijmakers, J. H. J. , & van der Horst, G. T. J. (2006). An Xpd mouse model for the combined xeroderma pigmentosum/Cockayne syndrome exhibiting both cancer predisposition and segmental progeria. Cancer Cell, 10, 121–132. 10.1016/j.ccr.2006.05.027 - DOI - PubMed
    1. Baar, M. P. , Brandt, R. M. C. , Putavet, D. A. , Klein, J. D. D. , Derks, K. W. J. , Bourgeois, B. R. M. , Stryeck, S. , Rijksen, Y. , van Willigenburg, H. , Feijtel, D. A. , van der Pluijm, I. , Essers, J. , van Cappellen, W. A. , van IJcken, W. F. , Houtsmuller, A. B. , Pothof, J. , de Bruin, R. W. F. , Madl, T. , Hoeijmakers, J. H. J. , … de Keizer, P. L. J. (2017). Targeted apoptosis of senescent cells restores tissue homeostasis in response to chemotoxicity and aging. Cell, 169(132–147), e116. 10.1016/j.cell.2017.02.031 - DOI - PMC - PubMed
    1. Barker, N. (2014). Adult intestinal stem cells: critical drivers of epithelial homeostasis and regeneration. Nature Reviews Molecular Cell Biology, 15, 19–33. 10.1038/nrm3721 - DOI - PubMed

Publication types