. 2022 Apr;100(4):613-627.
doi: 10.1007/s00109-022-02182-7. Epub 2022 Mar 5.

Early reduction of SARS-CoV-2-replication in bronchial epithelium by kinin B2 receptor antagonism

Affiliations

Early reduction of SARS-CoV-2-replication in bronchial epithelium by kinin B2 receptor antagonism

Constanze A Jakwerth et al. J Mol Med (Berl). 2022 Apr.

Abstract

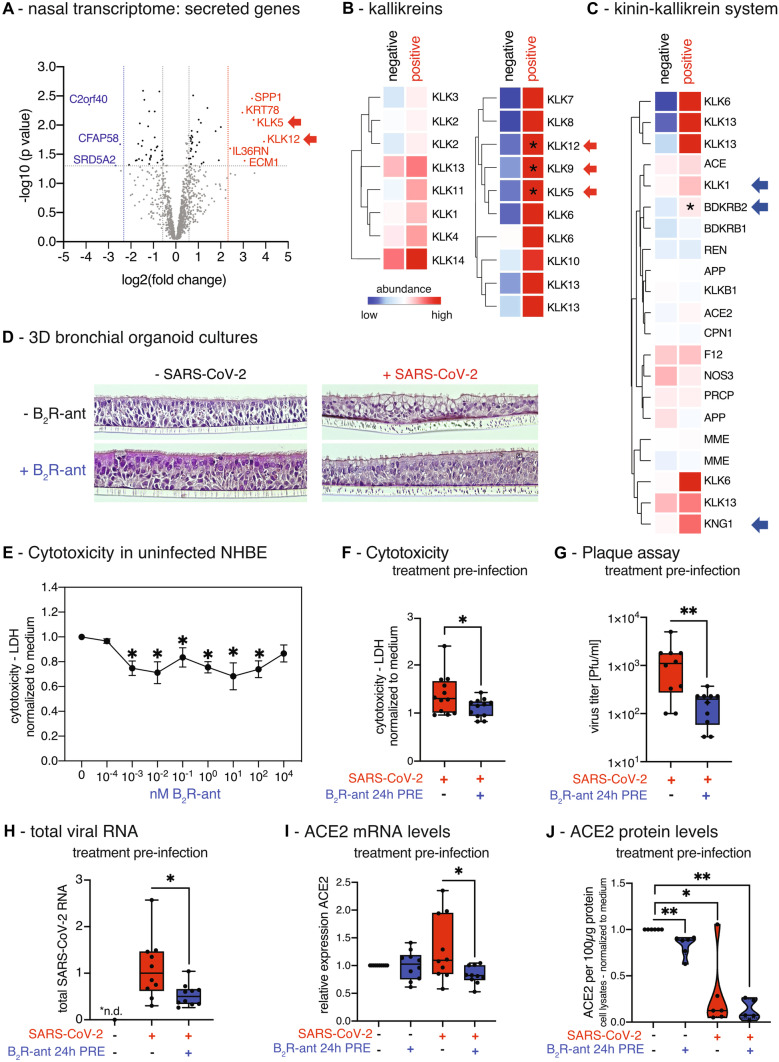
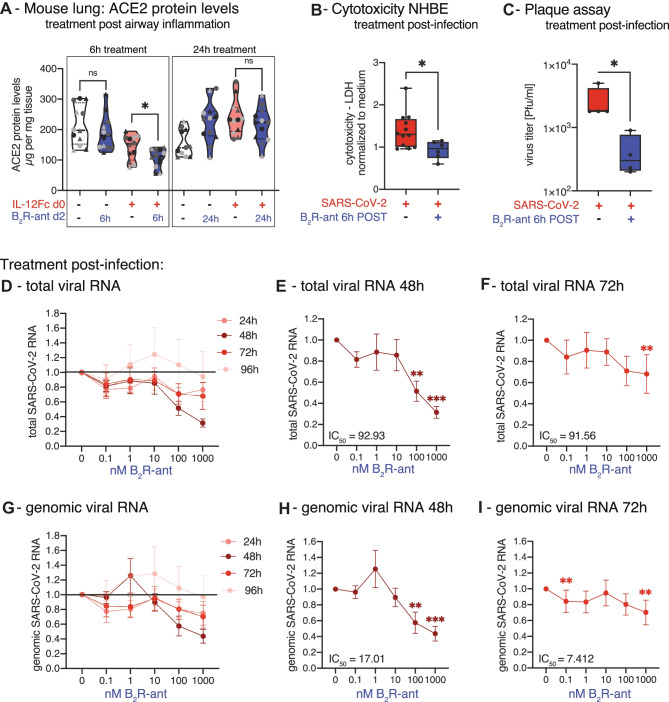
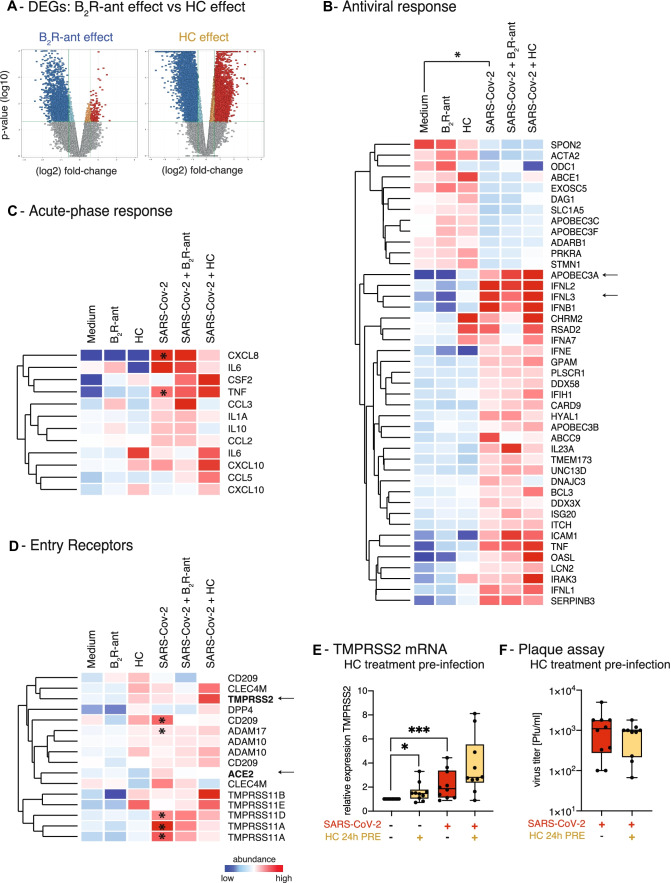
SARS-CoV-2 has evolved to enter the host via the ACE2 receptor which is part of the kinin-kallikrein pathway. This complex pathway is only poorly understood in context of immune regulation but critical to control infection. This study examines SARS-CoV-2-infection and epithelial mechanisms of the kinin-kallikrein-system at the kinin B2 receptor level in SARS-CoV-2-infection that is of direct translational relevance. From acute SARS-CoV-2-positive study participants and -negative controls, transcriptomes of nasal curettages were analyzed. Primary airway epithelial cells (NHBEs) were infected with SARS-CoV-2 and treated with the approved B2R-antagonist icatibant. SARS-CoV-2 RNA RT-qPCR, cytotoxicity assays, plaque assays, and transcriptome analyses were performed. The treatment effect was further studied in a murine airway inflammation model in vivo. Here, we report a broad and strong upregulation of kallikreins and the kinin B2 receptor (B2R) in the nasal mucosa of acutely symptomatic SARS-CoV-2-positive study participants. A B2R-antagonist impeded SARS-CoV-2 replication and spread in NHBEs, as determined in plaque assays on Vero-E6 cells. B2R-antagonism reduced the expression of SARS-CoV-2 entry receptor ACE2, G protein-coupled receptor signaling, and ion transport in vitro and in a murine airway inflammation in vivo model. In summary, this study provides evidence that treatment with B2R-antagonists protects airway epithelial cells from SARS-CoV-2 by inhibiting its replication and spread, through the reduction of ACE2 levels and the interference with several cellular signaling processes. Future clinical studies need to shed light on the airway protection potential of approved B2R-antagonists, like icatibant, in the treatment of early-stage COVID-19. KEY MESSAGES: Induction of kinin B2 receptor in the nose of SARS-CoV-2-positive patients. Treatment with B2R-antagonist protects airway epithelial cells from SARS-CoV-2. B2R-antagonist reduces ACE2 levels in vivo and ex vivo. Protection by B2R-antagonist is mediated by inhibiting viral replication and spread.

Keywords: ACE2; B2R-antagonist; COVID-19; Kinin; Kinin-kallikrein-system; SARS-CoV-2.


Conflict of interest statement

Dr. Jakwerth reports grants from Federal Ministry of Education and Research, grants from European Institute of Innovation & Technology (EIT), during the conduct of the study. Mr. Feuerherd reports personal fees from Helmholtz Zentrum München and Dr. Höhnle AG, outside the submitted work. Dr. Spinner reports grants, personal fees, non-financial support, and other from AbbVie, grants, personal fees, non-financial support, and other from Apeiron, personal fees from Formycon, grants, personal fees, non-financial support, and other from Gilead Sciences, grants, personal fees, and other from Eli Lilly, grants, personal fees, non-financial support, and other from Janssen-Cilag, grants, personal fees, non-financial support, and other from GSK/ViiV Healthcare, grants, personal fees, non-financial support, and other from MSD, outside the submitted work. Prof. Dr. Buch reports personal fees from Virometix AG, other from Virometix AG, other from Trials24 GmbH, other from Clemedi AG, outside the submitted work. Prof. Dr. Protzer reports grants from the Federal Ministry of Education and Research, the German Center for Infection Research (DZIF), the German Research Foundation (DFG), the European Union via Horizon 2020, and the Bavarian Research Foundation during conduct of the study. She receives personal fees as an ad hoc scientific advisor from Abbvie, Arbutus, Gilead, GSK, Johnson & Johnson, Vaccitech. Prof. Dr. Schmidt-Weber reports grants from German Center for Lung Research (DZL), grants from Comprehensive Pulmonary Lung Center (CPC) Munich during the conduct of the study. Personal fees from Allergopharma and Bencard, outside the submitted work. Dr. Zissler reports grants from Federal Ministry of Education and Research, during the conduct of the study. Dr. Chaker reports grants for clinical studies and research and other from Allergopharma, ALK Abello, AstraZeneca, Bencard / Allergen Therapeutics, ASIT Biotech, Lofarma, GSK, Novartis, LETI, Inmunotek, Roche, Sanofi Genzyme, Zeller, and from the European Institute of Technology (EIT); has received travel support from the European Academy of Allergy and Clinical Immunology (EAACI), DGAKI, all outside the submitted work. In addition, Drs. Jakwerth, Feuerherd, Protzer, Schmidt-Weber, Zissler, and Chaker are named as inventors on the patent application “Novel approaches for treatment of SARS-CoV-2-Infection in a patient.” Mr. Guerth, Ms. Oelsner, Dr. Schellhammer, Ms. Giglberger, Ms. Pechtold, Dr. Jerin, Ms. Kugler, Dr. Mogler, Dr. Haller, Ms. Erb, and Prof. Dr. Wollenberg have nothing to disclose.

Figures

Fig. 1
Fig. 1
Induction of kallikreins and kinin receptor B2 in the nasal mucosa of acutely positive COVID-19 study participants. A Volcano plot of significantly differentially regulated genes (DEGs = differentially expressed genes) in nasal curettages of study participants that were acute positive for SARS-CoV-2 compared to healthy individuals (negative) using human miR microarray technology. Highlighted genes have a fold change (FC) ≥ 10 with P < 0.05; genes in red are upregulated; genes in blue are downregulated. B Heat map of gene expression analysis of kallikrein genes and C of genes of the kinin-kallikrein-system (KKS) in nasal curettages comparing acute SARS-CoV-2-positive study participants to healthy controls. All entities are shown. Asterisks indicate significantly regulated genes (P < 0.05) in SARS-CoV-2-infected NHBEs compared to medium. Color code indicates Log2-fold change from low (blue) through 0 (white) to high (red). Duplicate gene names indicate the abundance of two or more isoforms of the same gene in the analysis. D 3D-air–liquid interphase cultures from NHBEs were pre-treated for 24 h with/without 1 nM B2R-antagonist from the basal side and subsequently infected with SARS-CoV-2 for 48 h from the apical side. E Lactate dehydrogenase (LDH) cytotoxicity assay using the LDH Cytotoxicity Detection Kit PLUS studying the effect of increasing doses of the B2R-antagonist after 48 h in primary NHBEs from 4 donors. Results are depicted as mean ± s.e.m. Statistical tests compared each dose of B2R-antagonist with 0 nM B2R-antagonist. F Cytotoxicity assay determining LDH release into the supernatants of cultures of SARS-CoV-2-infected NHBEs from 12 donors that were pre-treated for 24 h with/without 1 nM B2R-antagonist. G Quantification of infectious particles in the supernatants of SARS-CoV-2-infected NHBEs from 10 donors that were pre-treated with/without 1 nM B2R-antagonist for 24 h. Supernatants were titrated on Vero-E6 cells and plaque assay was quantified 24 h later. Results are depicted as plaque-forming units (PFU) per milliliter. H qPCR analysis of total SARS-CoV-2 RNA (viral genome and transcripts, which all contain the N1 sequence region) normalized to human ACTB of SARS-CoV-2-infected primary NHBE after 24 h of pre-treatment with/without 1 nM B2R-antagonist followed by 24 h of SARS-CoV-2 inoculation. For Fig. 1E, F, and H, statistical tests compared SARS-CoV-2-infected versus uninfected samples or B2R-antagonist-treated versus untreated samples. I Analysis of human ACE2 gene expression using qPCR (n = 10) and J of human ACE2 protein levels analyzed by ELISA from cell lysates (n = 6) after 24 h of pre-treatment of NHBEs with/without 1 nM B2R-antagonist, followed by SARS-CoV-2 inoculation for 24 h
Fig. 2
Fig. 2
Treatment of NHBE with B2R-antagonist post-infection in repeated doses inhibits SARS-CoV-2 replication. A In vivo mouse study. Twelve sex-matched mice from three different strains per group were treated on day 0 with intranasal application of 1 μg murine IL-12Fc per mouse or PBS as control to mimic virus-induced airway inflammation. After 48 h, mice were injected s.c. with 2 nmol of the B2R-antagonist icatibant per 10 g of body weight or PBS as control. The experiment was terminated either 6 h or 24 h later and murine lung ACE2 protein levels were analyzed by mouse ACE2 ELISA analysis. Circle:female; triangle:male. Black:C57BL/6, mid gray:C3H HeN, light gray:BALB/c strain. The experiment was carried out twice and the data in the figure represent the mean of each mouse type (strain/sex) of both experiments. Statistical tests compared B2R-antagonist-treated versus untreated groups. B Cytotoxicity assay determining LDH in supernatants from SARS-CoV-2-infected NHBEs from 12 donors that were treated with/without 1 nM B2R-antagonist after 6 h of infection for another 24 h. C Quantification of infectious particles in the supernatants from SARS-CoV-2-infected NHBEs from 4 donors that were treated with/without 1 nM B2R-antagonist after 6 h of infection for another 24 h. Supernatants were titrated on Vero-E6 cells and plaque assay was quantified 24 h later. Results are depicted as plaque-forming units (PFU) per milliliter. For Fig. 2B–C, statistical tests compared B2R-antagonist-treated versus untreated samples. D Relative quantification of total SARS-CoV-2 RNA (viral genome and transcripts, which all contain the N1 sequence region) and G genomic SARS-CoV-2 RNA (containing the RdRP gene) normalized to housekeeping gene index of human ACTB, HPRT, 18S in NHBEs from 8 independent donors that were infected with SARS-CoV-2 for 6 h and then treated with increasing doses of the B2R-antagonist icatibant repeatedly every 24 h for a total of 96 h. In cells treated with E 100 nM and F 1000 nM icatibant for 48 h and with H 100 nM and I 1000 nM icatibant for 72 h, total SARS-CoV-2 RNA and genomic SARS-CoV-2 RNA were significantly reduced. Red indicates SARS-CoV-2-infection; blue indicates B2R-antagonist treatment. PRE indicates pre-treatment; POST indicates post-treatment. In Fig. 2D–I, results are depicted as mean ± s.e.m. and statistical tests compared each dose of icatibant with 0 nM icatibant. Statistically significant differences were depicted as p-values *P < 0.05, **P < 0.01, and ***P < 0.001. ns indicates non-significant. + infected/treated;—indicates not infected/not treated
Fig. 3
Fig. 3
B2R-antagonism exhibits a protective and suppressive effect on gene expression profile of airway epithelial cells. A Volcano plots showing global gene expression changes induced by either treatment with B2R-antagonist or hydrocortisone (HC). Red indicates significantly upregulated entities; blue indicates significantly downregulated entities. Gene expression analysis of pre-treated NHBEs after 24 h of SARS-CoV-2-infection. B Heat map of gene expression analysis of genes involved in the epithelial antiviral response, analysis of the effects of SARS-CoV-2-infection. Only entities with significant changes between SARS-CoV-2-infection and medium are shown (gene expression fold change FC ≥ 1.5 with P < 0.05). C Heat map of gene expression analysis of genes involved in the acute-phase response is depicted. All entities are shown. Asterisks indicate significantly regulated genes (P < 0.05) in SARS-CoV-2 compared to medium. D Heat map of gene expression analysis of known and potential virus entry receptors is depicted. All entities are shown. Color code indicates Log2-fold change from low (blue) through 0 (white) to high (red). Asterisks indicate significantly regulated genes (P < 0.05) in SARS-CoV-2-infected NHBEs compared to medium. Duplicate gene names indicate the presence of two or more isoforms of the same gene in the analysis. E Analysis of TMPRSS2 gene expression by qPCR after 24 h of pre-treatment with/without 10 μM hydrocortisone (HC) followed by 24 h of SARS-CoV-2 inoculation. Red indicates SARS-CoV-2-infection; yellow indicates pre-treatment with hydrocortisone (HC). Statistical tests compared SARS-CoV-2-infected versus uninfected samples or B2R-antagonist-treated versus untreated samples. F Quantification of infectious particles in the supernatants of SARS-CoV-2-infected NHBEs from 10 donors that were pre-treated with/without 10 μM hydrocortisone (HC) for 24 h. Supernatants were titrated on Vero-E6 cells. The plaque assay was quantified 24 h later. Results are depicted as plaque-forming units (PFU) per milliliter
Fig. 4
Fig. 4
B2R-antagonism exhibits a protective and suppressive effect on gene expression profile of airway epithelial cells. GO-term enrichment analysis, which results from the string network analysis of significant DEGs from the gene expression analysis comparing infected NHBE pre-treated with B2R-antagonist with untreated infected NHBE (SARS-CoV-2 + B2R-antagonist versus SARS-CoV-2). Depicted are enrichment of A GO-term GO:0,007,186 “G protein-coupled receptor signaling pathway” and B GO-term GO:0,006,811 “Ion transport.” Genes that were significantly upregulated in the comparison SARS-CoV-2 versus medium are highlighted in red. C Venn diagram showing the cut set of upregulated membrane-bound cell surface receptors in SARS-CoV-2 versus medium and of downregulated DEGs in SARS-CoV-2 + icatibant versus SARS-CoV-2 (FC ≥ 1.5; P ≤ 0.05). D Heat map of gene expression analysis of the 35 membrane-bound cell surface receptors defined in cut set from Fig. 4C, all upregulated upon SARS-CoV-2-infection and downregulated upon pre-treatment with B2R-antagonist are depicted. Only entities with significant changes between SARS-CoV-2-infection and medium (up) and between SARS-CoV-2 + B2R-antagonist and SARS-CoV-2 (down) are shown (gene expression fold change FC ≥ 1.5 with P < 0.05). Color code indicates Log2-fold change from low (blue) through 0 (white) to high (red). Duplicate gene names indicate the abundance of two or more isoforms of the same gene in the analysis

References

    1. Polack FP, Thomas SJ, Kitchin N, Absalon J, Gurtman A, Lockhart S, Perez JL, Perez Marc G, Moreira ED, Zerbini C, et al. Safety and efficacy of the BNT162b2 mRNA Covid-19 vaccine. N Engl J Med. 2020;383:2603–2615. doi: 10.1056/NEJMoa2034577. - DOI - PMC - PubMed
    1. Zhang JJ, Dong X, Cao YY, Yuan YD, Yang YB, Yan YQ, Akdis CA, Gao YD. Clinical characteristics of 140 patients infected with SARS-CoV-2 in Wuhan, China. Allergy. 2020;75:1730–1741. doi: 10.1111/all.14238. - DOI - PubMed
    1. Callaway E. Heavily mutated Omicron variant puts scientists on alert. Nature. 2021;600:21. doi: 10.1038/d41586-021-03552-w. - DOI - PubMed
    1. Hacisuleyman E, Hale C, Saito Y, Blachere NE, Bergh M, Conlon EG, Schaefer-Babajew DJ, DaSilva J, Muecksch F, Gaebler C et al (2021) Vaccine breakthrough infections with SARS-CoV-2 variants. N Engl J Med. 10.1056/NEJMoa2105000 - PMC - PubMed
    1. Schmidt F, Weisblum Y, Muecksch F, Hoffmann HH, Michailidis E, Lorenzi JCC, Mendoza P, Rutkowska M, Bednarski E, Gaebler C et al (2020) Measuring SARS-CoV-2 neutralizing antibody activity using pseudotyped and chimeric viruses. J Exp Med 217. 10.1084/jem.20201181 - PMC - PubMed

Publication types