

Impact of wheat aleurone on biomarkers of cardiovascular disease, gut microbiota and metabolites in adults with high body mass index: a double-blind, placebo-controlled, randomized clinical trial
- PMID: 35247098
- PMCID: PMC9279244
- DOI: 10.1007/s00394-022-02836-9
Impact of wheat aleurone on biomarkers of cardiovascular disease, gut microbiota and metabolites in adults with high body mass index: a double-blind, placebo-controlled, randomized clinical trial
Abstract
Purpose: Aleurone is a cereal bran fraction containing a variety of beneficial nutrients including polyphenols, fibers, minerals and vitamins. Animal and human studies support the beneficial role of aleurone consumption in reducing cardiovascular disease (CVD) risk. Gut microbiota fiber fermentation, polyphenol metabolism and betaine/choline metabolism may in part contribute to the physiological effects of aleurone. As primary objective, this study evaluated whether wheat aleurone supplemented foods could modify plasma homocysteine. Secondary objectives included changes in CVD biomarkers, fecal microbiota composition and plasma/urine metabolite profiles.
Methods: A parallel double-blind, placebo-controlled and randomized trial was carried out in two groups of obese/overweight subjects, matched for age, BMI and gender, consuming foods supplemented with either aleurone (27 g/day) (AL, n = 34) or cellulose (placebo treatment, PL, n = 33) for 4 weeks.
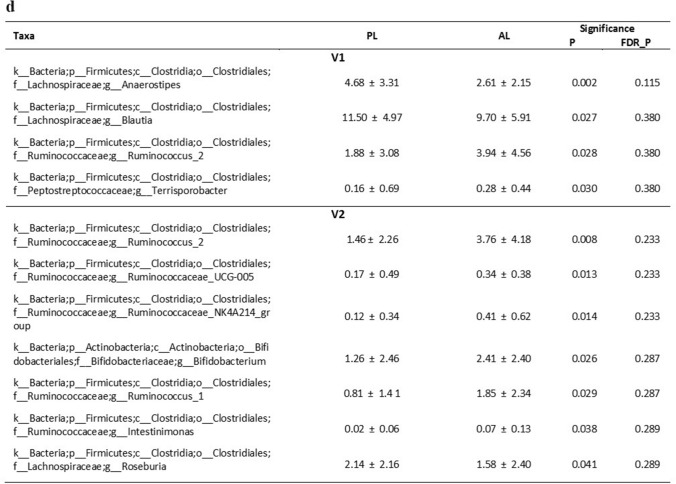
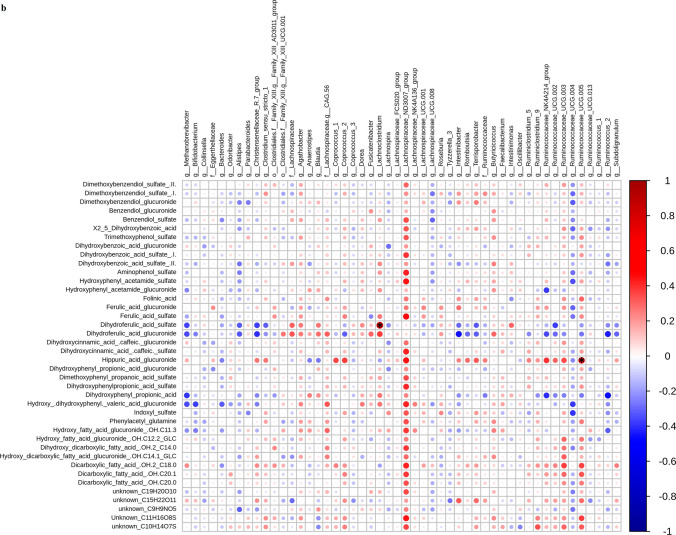
Results: No significant changes in plasma homocysteine or other clinical markers were observed with either treatment. Dietary fiber intake increased after AL and PL, animal protein intake increased after PL treatment. We observed a significant increase in fecal Bifidobacterium spp with AL and Lactobacillus spp with both AL and PL, but overall fecal microbiota community structure changed little according to 16S rRNA metataxonomics. Metabolomics implicated microbial metabolism of aleurone polyphenols and revealed distinctive biomarkers of AL treatment, including alkylresorcinol, cinnamic, benzoic and ferulic acids, folic acid, fatty acids, benzoxazinoid and roasted aroma related metabolites. Correlation analysis highlighted bacterial genera potentially linked to urinary compounds derived from aleurone metabolism and clinical parameters.
Conclusions: Aleurone has potential to modulate the gut microbial metabolic output and increase fecal bifidobacterial abundance. However, in this study, aleurone did not impact on plasma homocysteine or other CVD biomarkers.
Trial registration: The study was registered at ClinicalTrials.gov (NCT02067026) on the 17th February 2014.
Keywords: Aleurone; Biomarkers of intake; Gut microbiota; Homocysteine.
© 2022. The Author(s).
Conflict of interest statement
The authors declare no conflict of interest. However, two of our authors worked for Cargill R&D Centre Europe (Vilvoorde, Belgium) at the time of the study. Their contribution was restricted to the initial outlined plan of the trial, provision of the test foods (including oversight for the safe manufacture of the test foods), and critical reading of the final manuscript.
Figures


Similar articles
-
Effects of dietary fibers or probiotics on functional constipation symptoms and roles of gut microbiota: a double-blinded randomized placebo trial.Gut Microbes. 2023 Jan-Dec;15(1):2197837. doi: 10.1080/19490976.2023.2197837. Gut Microbes. 2023. PMID: 37078654 Free PMC article. Clinical Trial.
-
Whole-grain wheat consumption reduces inflammation in a randomized controlled trial on overweight and obese subjects with unhealthy dietary and lifestyle behaviors: role of polyphenols bound to cereal dietary fiber.Am J Clin Nutr. 2015 Feb;101(2):251-61. doi: 10.3945/ajcn.114.088120. Epub 2014 Dec 3. Am J Clin Nutr. 2015. PMID: 25646321 Clinical Trial.
-
Effects of Defatted Rice Bran-Fortified Bread on the Gut Microbiota Composition of Healthy Adults With Low Dietary Fiber Intake: Protocol for a Crossover Randomized Controlled Trial.JMIR Res Protoc. 2024 Aug 29;13:e59227. doi: 10.2196/59227. JMIR Res Protoc. 2024. PMID: 39207833 Free PMC article.
-
Cocoa seeds and chocolate products interaction with gut microbiota; mining microbial and functional biomarkers from mechanistic studies, clinical trials and 16S rRNA amplicon sequencing.Crit Rev Food Sci Nutr. 2024;64(10):3122-3138. doi: 10.1080/10408398.2022.2130159. Epub 2022 Oct 3. Crit Rev Food Sci Nutr. 2024. PMID: 36190306 Review.
-
Health-Improving Effects of Polyphenols on the Human Intestinal Microbiota: A Review.Int J Mol Sci. 2025 Feb 5;26(3):1335. doi: 10.3390/ijms26031335. Int J Mol Sci. 2025. PMID: 39941107 Free PMC article. Review.
Cited by
-
The Gut-Heart Axis: Effects of Intestinal Microbiome Modulation on Cardiovascular Disease-Ready for Therapeutic Interventions?Int J Mol Sci. 2024 Dec 17;25(24):13529. doi: 10.3390/ijms252413529. Int J Mol Sci. 2024. PMID: 39769292 Free PMC article.
-
The Wheat Aleurone Layer: Optimisation of Its Benefits and Application to Bakery Products.Foods. 2022 Nov 8;11(22):3552. doi: 10.3390/foods11223552. Foods. 2022. PMID: 36429143 Free PMC article. Review.
-
Nutrition at the Intersection between Gut Microbiota Eubiosis and Effective Management of Type 2 Diabetes.Nutrients. 2024 Jan 16;16(2):269. doi: 10.3390/nu16020269. Nutrients. 2024. PMID: 38257161 Free PMC article. Review.
-
Aleurone supplementation enhances the metabolic benefits of training in Standardbred mares: impacts on glucose-insulin dynamics and gut microbiome composition.Front Physiol. 2025 Apr 10;16:1565005. doi: 10.3389/fphys.2025.1565005. eCollection 2025. Front Physiol. 2025. PMID: 40276369 Free PMC article.
-
K-Clique Multiomics Framework: A Novel Protocol to Decipher the Role of Gut Microbiota Communities in Nutritional Intervention Trials.Metabolites. 2022 Aug 10;12(8):736. doi: 10.3390/metabo12080736. Metabolites. 2022. PMID: 36005608 Free PMC article.
References
-
- Marshall S, Petocz P, Duve E, et al. The effect of replacing refined grains with whole grains on cardiovascular risk factors: a systematic review and meta-analysis of randomized controlled trials with GRADE clinical recommendation. J Acad Nutr Diet. 2020;120:1859–1883.e31. doi: 10.1016/j.jand.2020.06.021. - DOI - PubMed
Publication types
MeSH terms
Substances
Associated data
Grants and funding
LinkOut - more resources
Full Text Sources
Medical
Research Materials
Miscellaneous
