. 2022 Aug;44(4):1941-1960.
doi: 10.1007/s11357-022-00536-0. Epub 2022 Mar 5.

Senescent macrophages in the human adipose tissue as a source of inflammaging

Affiliations

Senescent macrophages in the human adipose tissue as a source of inflammaging

Giulia Matacchione et al. Geroscience. 2022 Aug.

Abstract

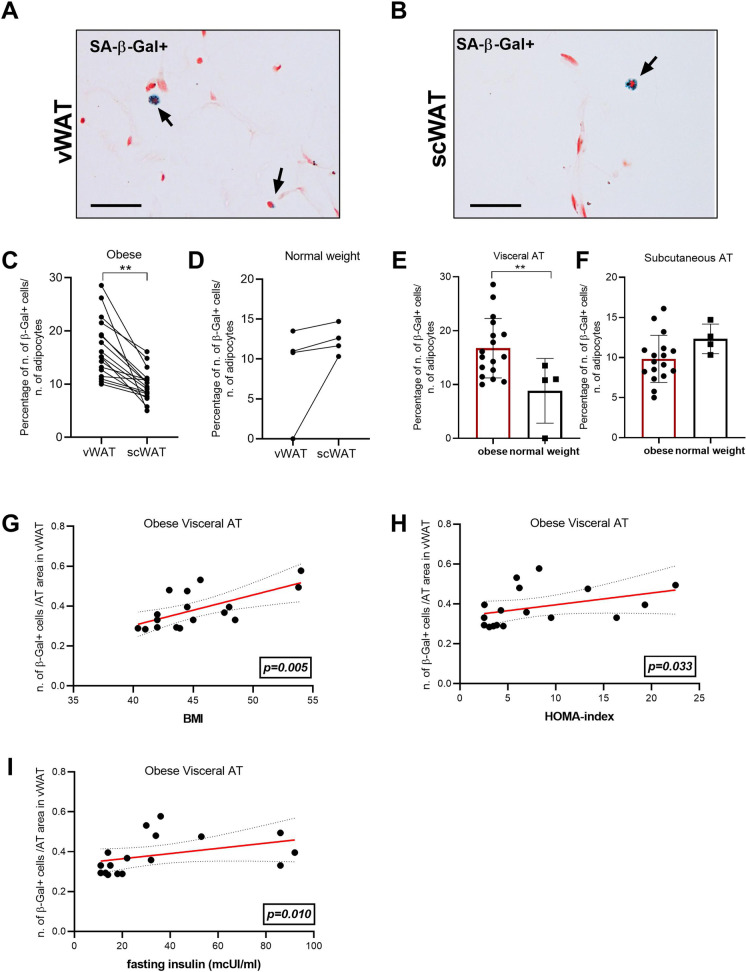
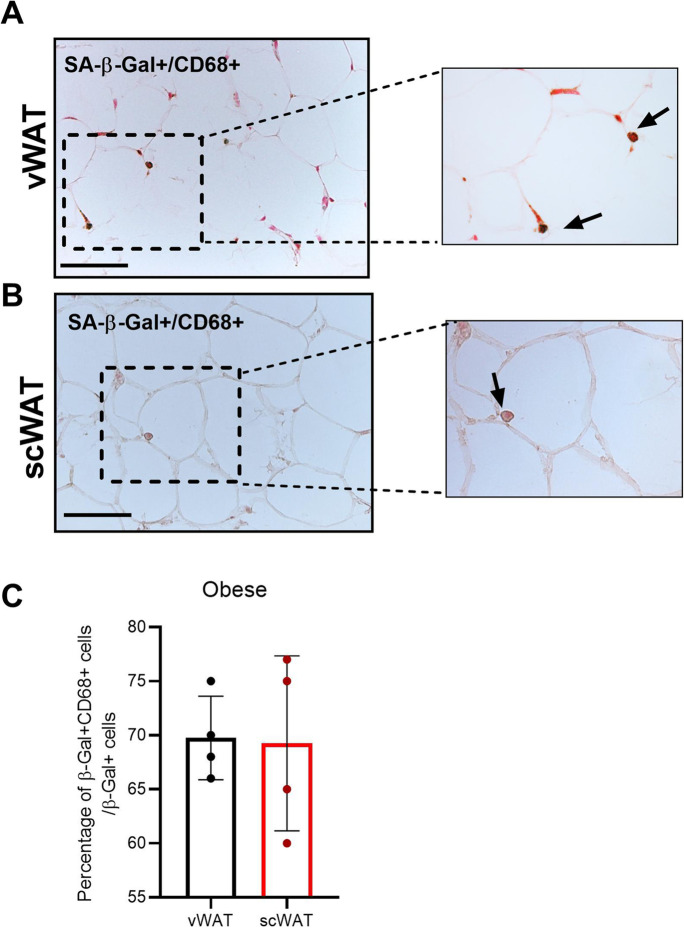
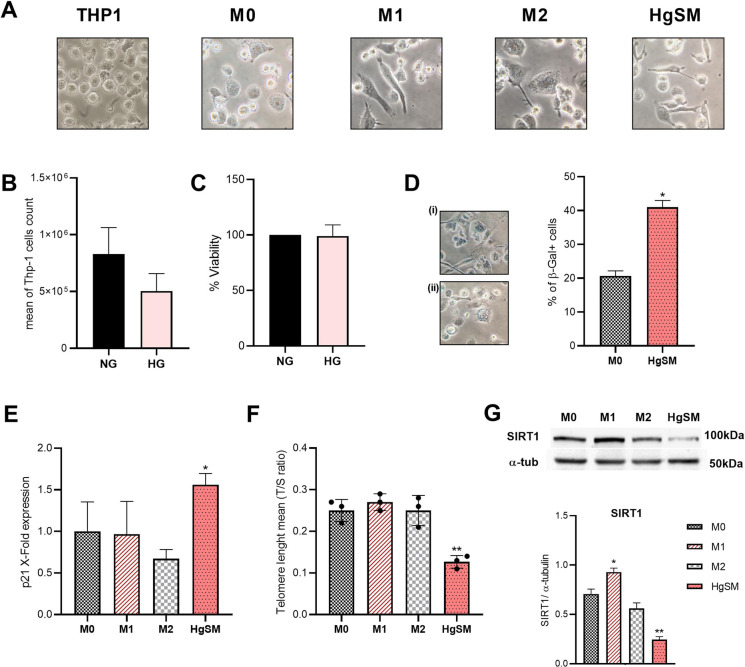
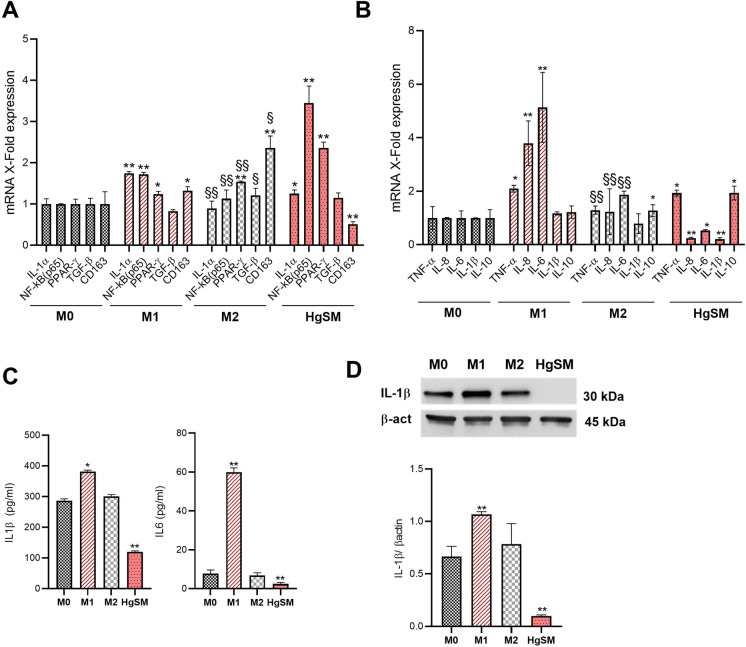
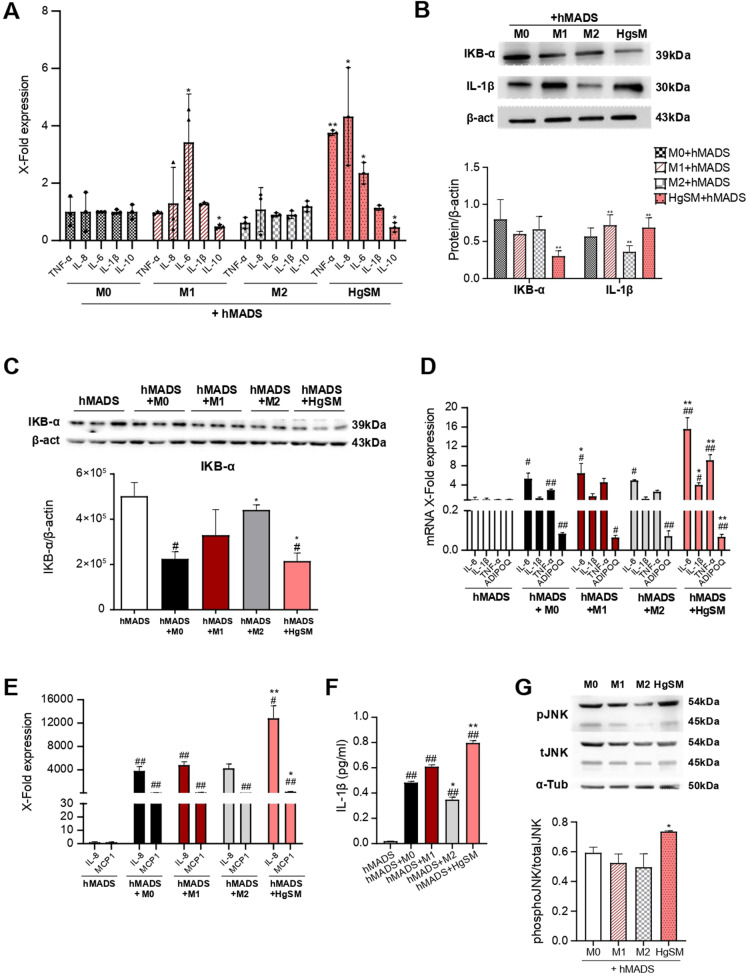
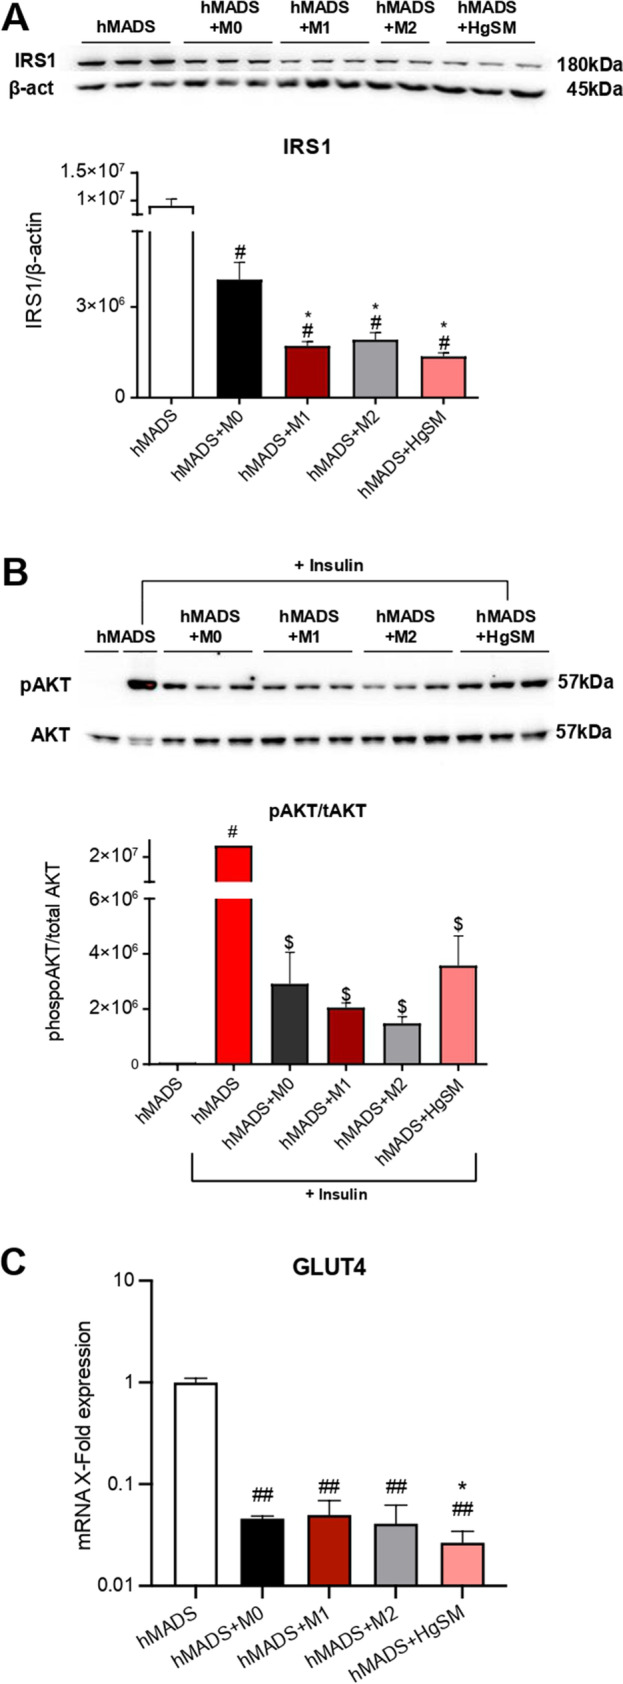
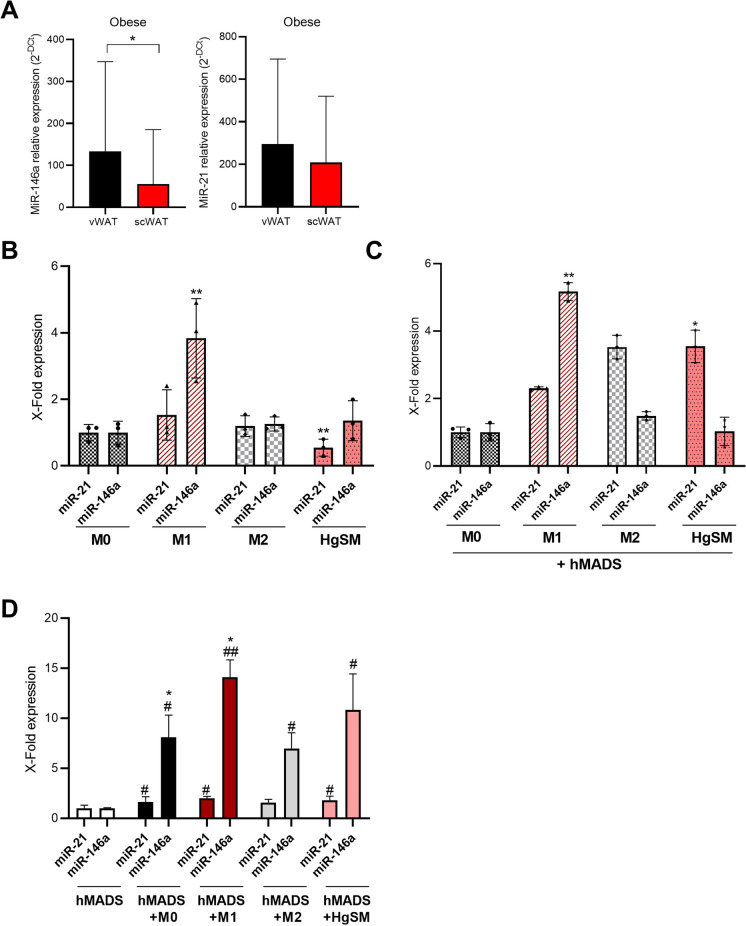
Obesity is a major risk factor for type 2 diabetes and a trigger of chronic and systemic inflammation. Recent evidence suggests that an increased burden of senescent cells (SCs) in the adipose tissue of obese/diabetic animal models might underlie such pro-inflammatory phenotype. However, the role of macrophages as candidate SCs, their phenotype, the distribution of SCs among fat depots, and clinical relevance are debated. The senescence marker β-galactosidase and the macrophage marker CD68 were scored in visceral (vWAT) and subcutaneous (scWAT) adipose tissue from obese patients (n=17) undergoing bariatric surgery and control patients (n=4) subjected to cholecystectomy. A correlation was made between the number of SCs and BMI, serum insulin, and the insulin resistance (IR) index HOMA. The monocyte cell line (THP-1) was cultured in vitro in high glucose milieu (60 mM D-glucose) and subsequently co-cultured with human adipocytes (hMADS) to investigate the reciprocal inflammatory activation. In obese patients, a significantly higher number of SCs was observed in vWAT compared to scWAT; about 70% of these cells expressed the macrophage marker CD68; and the number of SCs in vWAT, but not in scWAT, positively correlated with BMI, HOMA-IR, and insulin. THP-1 cultured in vitro in high glucose milieu acquired a senescent-like phenotype (HgSMs), characterized by a polarization toward a mixed M1/M2-like secretory phenotype. Co-culturing HgSMs with hMADS elicited pro-inflammatory cytokine expression in both cell types, and defective insulin signaling in hMADS. In morbid obesity, expansion of visceral adipose depots involves an increased burden of macrophages with senescent-like phenotype that may promote a pro-inflammatory profile and impair insulin signaling in adipocytes, supporting a framework where senescent macrophages fuel obesity-induced systemic inflammation and possibly contribute to the development of IR.

Keywords: Adipose tissue; Inflammaging; Insulin resistance; Macrophage; Obesity; Senescent cell.


Conflict of interest statement

The authors declare no competing interests.

Figures

Figure 1
Figure 1
SA-β-Gal + cells in adipose tissue. Histological analysis of visceral (vWAT) (A) and subcutaneous adipose tissue (scWAT) (B) of obese subjects (n=17). Percentage of SA-β-Gal + cells number in vWAT and scWAT in obese subjects (C) and in normal weight subjects (n=4) (D). Percentage of SA-β-Gal + cells number in vWAT between obese and normal weight subjects (E). Percentage of SA-β-Gal + cells number in scWAT between obese and normal weight subjects (F). Spearman correlation between number of SA-β-Gal + cells and G BMI (r=0.671; p=0.003), H HOMA index (r=0.519; p=0.033), and I insulin (r=0.607; p=0.010) in vWAT. Bar= 100mm. *p≤0.05; **p≤0.01; ***p≤0.001
Figure 2
Figure 2
Senescent macrophages in obese adipose tissue. Immunohistochemical analysis of SA-β-Gal+/CD68+ cells in vWAT (A) and scWAT (B) of obese individuals. C Percentage of the double positive (SA-β-Gal+/CD68 +) cells in vWAT and scWAT of obese subjects compared to the total amount of SA-β-Gal+ cells. Bar= 100mm. *p≤0.05; **p≤0.01; ***p≤0.001
Figure 3
Figure 3
Analysis of PMA-induced macrophage phenotypes and senescent features in HgSMs. A Representative pictures from THP-1 cells and M0, M1, M2, and HgSM macrophage polarization observed by light microscopy (40×). B THP-1 proliferative activity in hyperglycemia compared to normoglycemia. C THP-1 viability in hyperglycemia compared to normoglycemia performed by MTT assay. D SA-β-Gal activity of HgSMs (i) compared to M0 (ii). E p21 qRT-PCR analysis in M0, M1, M2, and HgSMs. F Measurements of telomere length (T/S ratio) in M0, M1, M2, and HgSM macrophages. G Representative immunoblot and quantification of SIRT1 expression in M0, M1, M2, and HgSM macrophages. Data are expressed as mean ± SD, *p≤0.05; **p≤0.01; ***p≤0.001
Figure 4
Figure 4
Phenotypic characterization of HgSM macrophages. A qRT-PCR analysis of NF-kB, Il-1a, TGF-b, PPAR-g, and CD163 expression in macrophages. B qRT-PCR analysis of TNF-α, IL-8, IL-6, IL-1β, and IL-10 expression in macrophages. C IL-1β and IL-6 concentration (pg/ml) measured by ELISA in the cell culture supernatants. D Representative immunoblot and quantification of IL-1β expression in M0, M1, M2, and HgSM macrophages. Data are expressed as mean ± SD, *p≤0.05; **p≤0.01; ***p≤0.001; §p≤0.05; §§p≤0.01; §§§p≤0.001. *vs M0, §vs M1
Figure 5
Figure 5
Phenotypic characterization of HgSM macrophage and hMADS adipocyte co-culture. A qRT-PCR analysis of TNF-α, IL-8, IL-6, IL-1β, and IL-10 expression in macrophages co-cultured with hMADS adipocytes. B Representative immunoblot and quantification of IKB-α and IL-1β in macrophages co-cultured with hMADS adipocytes. C Representative immunoblot and quantification of IKB-α in hMADS adipocytes co-cultured with macrophages. qRT-PCR analysis of IL-6, IL-1β, TN-Fα, ADIPOQ D, IL-8, and MCP1 E expression in hMADS adipocytes co-cultured with macrophages. F IL-1β concentration (pg/ml) measured by ELISA in cell co-culture supernatant. G Representative immunoblot and quantification of pJNK expression in macrophages co-cultured with hMADS adipocytes. Data are expressed as mean ± SEM or mean ± SD. *p≤0.05; **p≤0.01; ***p≤0.001; #p≤0.05; ##p≤0.01; ##p≤0.001. *vs M0; #vs hMADS
Figure 6
Figure 6
Effect of macrophages on insulin signaling in hMADS adipocytes. Representative immunoblot and quantification of IRS1 (A) and pAKT (B) in hMADS adipocytes co-cultured with macrophages. C qRT-PCR analysis of GLUT4 expression in hMADS adipocytes co-cultured with macrophages. Data are expressed as mean ± SEM, *p≤0.05; **p≤0.01; ***p≤0.001; #p≤0.05; ##p≤0.01; ###p≤0.001, $p≤0.05; $$p≤0.01; $$$p≤0.001. *vs M0; #vs hMADS; $vs hMADS+Insulin
Figure 7
Figure 7
Analysis of miRNA expression in adipose tissue, THP-1-induced macrophages, and hMADS adipocytes in co-cultured condition. A miRNA expression analysis by RT-PCR of miR-146a and miR-21 in vWAT and scWAT. B miRNA expression analysis by qRT-PCR of miR-21 and miR-146a in M0, M1, M2, and HgSM macrophages. C miRNA expression analysis by qRT-PCR of miR-21 and miR-146a in M0, M1, M2, and HgSM macrophages co-cultured with hMADS adypocytes. D miRNA expression analysis by qRT-PCR of miR-21 and miR-146a in hMADS adipocytes co-cultured with M0, M1, M2, and HgSM macrophages. Data are expressed as mean ± SD, *p≤0.05; **p≤0.01; ***p≤0.001; #p≤0.05; ##p≤0.01; ##p≤0.001. *vs M0; #vs hMADS

References

    1. Franceschi, C., et al., Inflamm-aging. An evolutionary perspective on immunosenescence. Ann N Y Acad Sci. 2000;908:244–254. - PubMed
    1. Fulop T, et al. The integration of inflammaging in age-related diseases. Semin Immunol. 2018;40:17–35. - PubMed
    1. Reilly SM, Saltiel AR. Adapting to obesity with adipose tissue inflammation. Nat Rev Endocrinol. 2017;13(11):633–643. - PubMed
    1. Wellen KE, Hotamisligil GS. Inflammation, stress, and diabetes. J Clin Invest. 2005;115(5):1111–9. - PMC - PubMed
    1. Frasca D, Blomberg BB, Paganelli R. Aging, obesity, and inflammatory age-related diseases. Front Immunol. 2017;8:1745. - PMC - PubMed

Publication types