

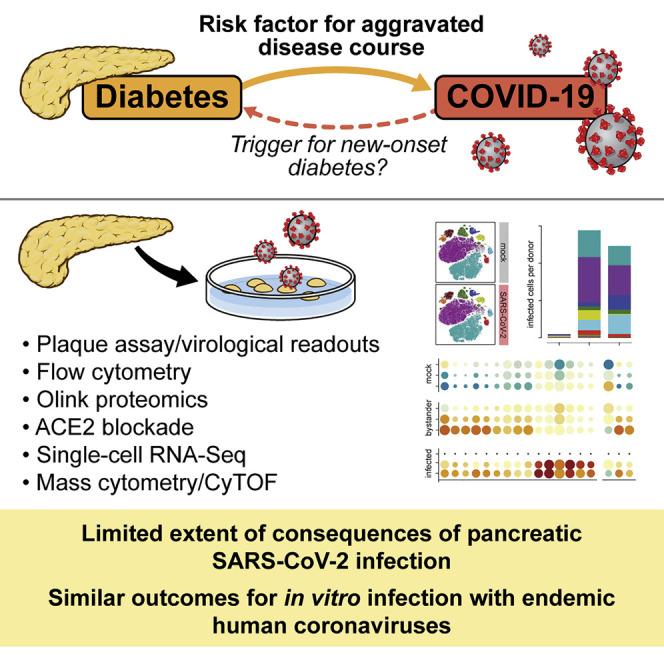
Limited extent and consequences of pancreatic SARS-CoV-2 infection
- PMID: 35247306
- PMCID: PMC8858708
- DOI: 10.1016/j.celrep.2022.110508
Limited extent and consequences of pancreatic SARS-CoV-2 infection
Abstract
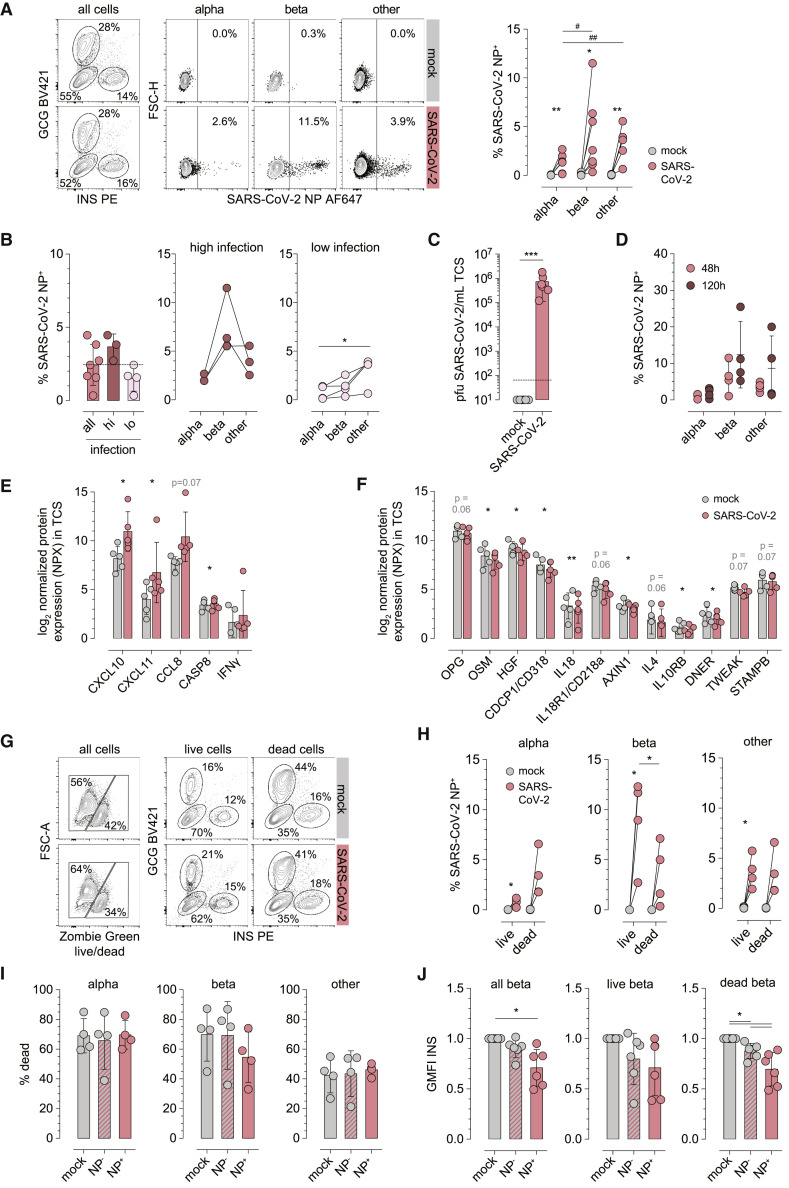
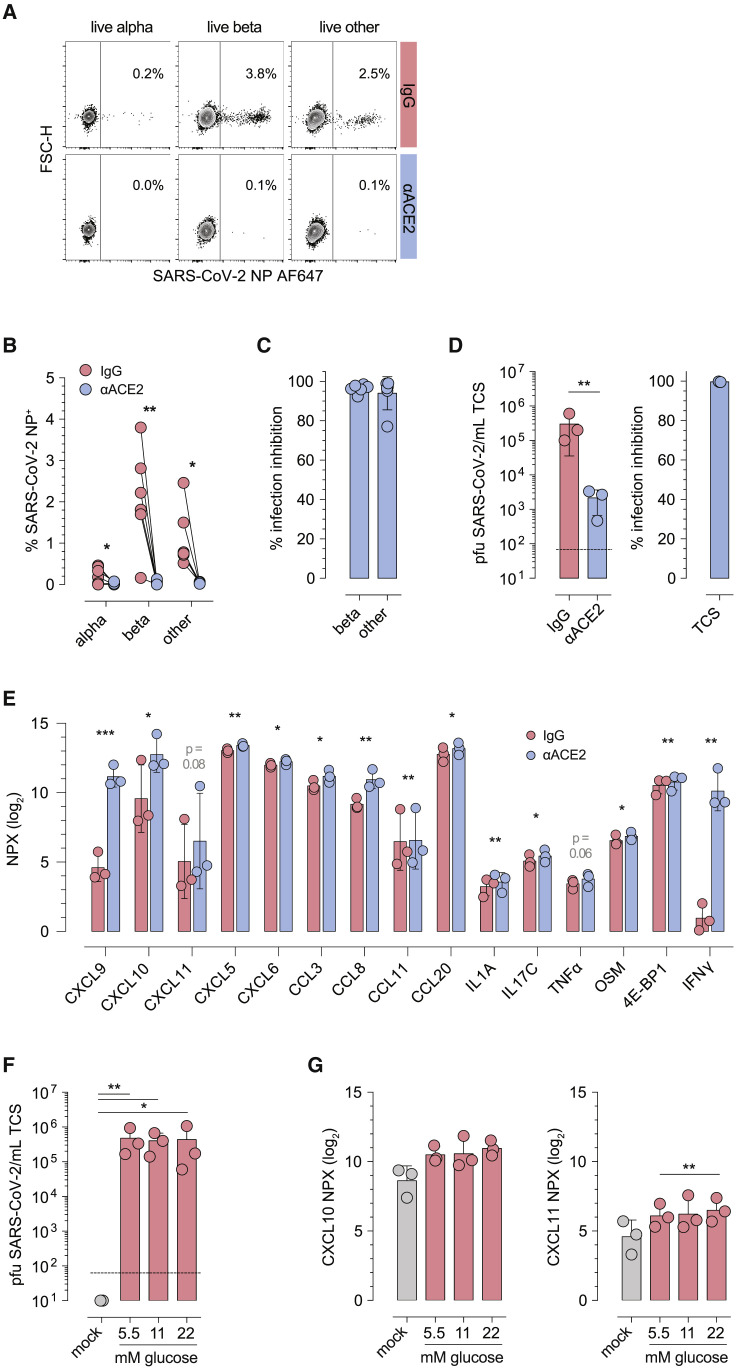
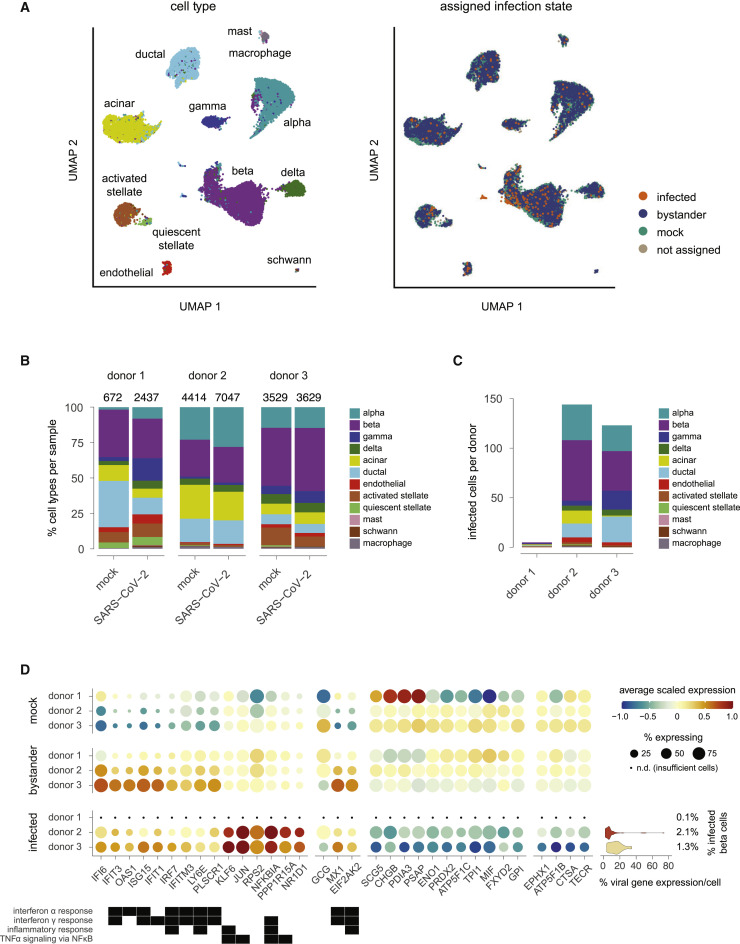
Concerns that infection with severe acute respiratory syndrome coronavirus 2 (SARS-CoV-2), the etiological agent of coronavirus disease 2019 (COVID-19), may cause new-onset diabetes persist in an evolving research landscape, and precise risk assessment is hampered by, at times, conflicting evidence. Here, leveraging comprehensive single-cell analyses of in vitro SARS-CoV-2-infected human pancreatic islets, we demonstrate that productive infection is strictly dependent on the SARS-CoV-2 entry receptor ACE2 and targets practically all pancreatic cell types. Importantly, the infection remains highly circumscribed and largely non-cytopathic and, despite a high viral burden in infected subsets, promotes only modest cellular perturbations and inflammatory responses. Similar experimental outcomes are also observed after islet infection with endemic coronaviruses. Thus, the limits of pancreatic SARS-CoV-2 infection, even under in vitro conditions of enhanced virus exposure, challenge the proposition that in vivo targeting of β cells by SARS-CoV-2 precipitates new-onset diabetes. Whether restricted pancreatic damage and immunological alterations accrued by COVID-19 increase cumulative diabetes risk, however, remains to be evaluated.
Keywords: COVID-19; SARS-CoV-2; human coronaviruses; human islets; pancreas; type 1 diabetes; type 2 diabetes; viral infection.
Copyright © 2022 The Author(s). Published by Elsevier Inc. All rights reserved.
Conflict of interest statement
Declaration of interests The A.G.-S. laboratory has received research support from Pfizer, Senhwa Biosciences, Kenall Manufacturing, Avimex, Johnson & Johnson, Dynavax, 7Hills Pharma, Pharmamar, ImmunityBio, Accurius, Nanocomposix, Hexamer, N-fold LLC, Model Medicines, and Merck outside of the reported work. A.G.-S. has consulting agreements outside of the reported work for the following companies, involving cash and/or stock: Vivaldi Biosciences, Contrafect, 7Hills Pharma, Avimex, Vaxalto, Pagoda, Accurius, Esperovax, Farmak, Applied Biological Laboratories, and Pfizer. A.G.-S. is an inventor on patents and patent applications on the use of antivirals and vaccines for the treatment and prevention of virus infections and cancer, owned by the Icahn School of Medicine at Mount Sinai, New York, outside of the reported work.
Figures
Similar articles
-
ACE2 function in the pancreatic islet: Implications for relationship between SARS-CoV-2 and diabetes.Acta Physiol (Oxf). 2021 Dec;233(4):e13733. doi: 10.1111/apha.13733. Epub 2021 Oct 2. Acta Physiol (Oxf). 2021. PMID: 34561952 Free PMC article. Review.
-
Going viral in the islet: mediators of SARS-CoV-2 entry beyond ACE2.J Mol Endocrinol. 2022 Jun 17;69(2):R63-R79. doi: 10.1530/JME-21-0282. J Mol Endocrinol. 2022. PMID: 35521990 Free PMC article. Review.
-
SARS-CoV-2 infection of the pancreas promotes thrombofibrosis and is associated with new-onset diabetes.JCI Insight. 2021 Aug 23;6(16):e151551. doi: 10.1172/jci.insight.151551. JCI Insight. 2021. PMID: 34241597 Free PMC article.
-
SARS-CoV-2 and pancreas: a potential pathological interaction?Trends Endocrinol Metab. 2021 Nov;32(11):842-845. doi: 10.1016/j.tem.2021.07.004. Epub 2021 Jul 24. Trends Endocrinol Metab. 2021. PMID: 34373155 Free PMC article. Review.
-
Deleterious Effects of SARS-CoV-2 Infection on Human Pancreatic Cells.Front Cell Infect Microbiol. 2021 Jun 23;11:678482. doi: 10.3389/fcimb.2021.678482. eCollection 2021. Front Cell Infect Microbiol. 2021. PMID: 34282405 Free PMC article.
Cited by
-
Increased Incidence of New-Onset Diabetic Retinopathy in Individuals with COVID-19 in an Underserved Urban Population in the Bronx.Diagnostics (Basel). 2025 Jul 22;15(15):1846. doi: 10.3390/diagnostics15151846. Diagnostics (Basel). 2025. PMID: 40804810 Free PMC article.
-
Bidirectional Relationship between Glycemic Control and COVID-19 and Perspectives of Islet Organoid Models of SARS-CoV-2 Infection.Biomedicines. 2023 Mar 11;11(3):856. doi: 10.3390/biomedicines11030856. Biomedicines. 2023. PMID: 36979836 Free PMC article. Review.
-
Infection with SARS-CoV-2 can cause pancreatic impairment.Signal Transduct Target Ther. 2024 Apr 12;9(1):98. doi: 10.1038/s41392-024-01796-2. Signal Transduct Target Ther. 2024. PMID: 38609366 Free PMC article.
-
Diabetes and SARS-CoV-2-Is There a Mutual Connection?Front Cell Dev Biol. 2022 Jun 13;10:913305. doi: 10.3389/fcell.2022.913305. eCollection 2022. Front Cell Dev Biol. 2022. PMID: 35769263 Free PMC article. Review.
-
Diabetes Mellitus, Energy Metabolism, and COVID-19.Endocr Rev. 2024 Mar 4;45(2):281-308. doi: 10.1210/endrev/bnad032. Endocr Rev. 2024. PMID: 37934800 Free PMC article. Review.
References
-
- Al-Aly Z., Xie Y., Bowe B. High-dimensional characterization of post-acute sequelae of COVID-19. Nature. 2021;594:259–264. - PubMed
-
- Augstein P., Naselli G., Loudovaris T., Hawthorne W.J., Campbell P., Bandala-Sanchez E., Rogers K., Heinke P., Thomas H.E., Kay T.W., et al. Localization of dipeptidyl peptidase-4 (CD26) to human pancreatic ducts and islet alpha cells. Diabetes Res. Clin. Pract. 2015;110:291–300. - PubMed
Publication types
MeSH terms
Grants and funding
- P01 AI042288/AI/NIAID NIH HHS/United States
- U54 AI142766/AI/NIAID NIH HHS/United States
- U01 AI150748/AI/NIAID NIH HHS/United States
- UC4 DK116284/DK/NIDDK NIH HHS/United States
- S10 OD026880/OD/NIH HHS/United States
- R01 AI134971/AI/NIAID NIH HHS/United States
- R01 DK130425/DK/NIDDK NIH HHS/United States
- S10 OD030463/OD/NIH HHS/United States
- U19 AI135972/AI/NIAID NIH HHS/United States
- R01 AI151029/AI/NIAID NIH HHS/United States
- U01 DK104162/DK/NIDDK NIH HHS/United States
- U01 DK123716/DK/NIDDK NIH HHS/United States
- P30 DK020541/DK/NIDDK NIH HHS/United States
- P30 DK020593/DK/NIDDK NIH HHS/United States
LinkOut - more resources
Full Text Sources
Medical
Molecular Biology Databases
Miscellaneous
