Review
. 2022 Jun 25;399(10344):2381-2397.
doi: 10.1016/S0140-6736(22)00008-3. Epub 2022 Mar 2.

Quantifying the effects of the COVID-19 pandemic on gender equality on health, social, and economic indicators: a comprehensive review of data from March, 2020, to September, 2021

Affiliations
Review

Quantifying the effects of the COVID-19 pandemic on gender equality on health, social, and economic indicators: a comprehensive review of data from March, 2020, to September, 2021

Luisa S Flor et al. Lancet. .

Abstract

Background: Gender is emerging as a significant factor in the social, economic, and health effects of COVID-19. However, most existing studies have focused on its direct impact on health. Here, we aimed to explore the indirect effects of COVID-19 on gender disparities globally.

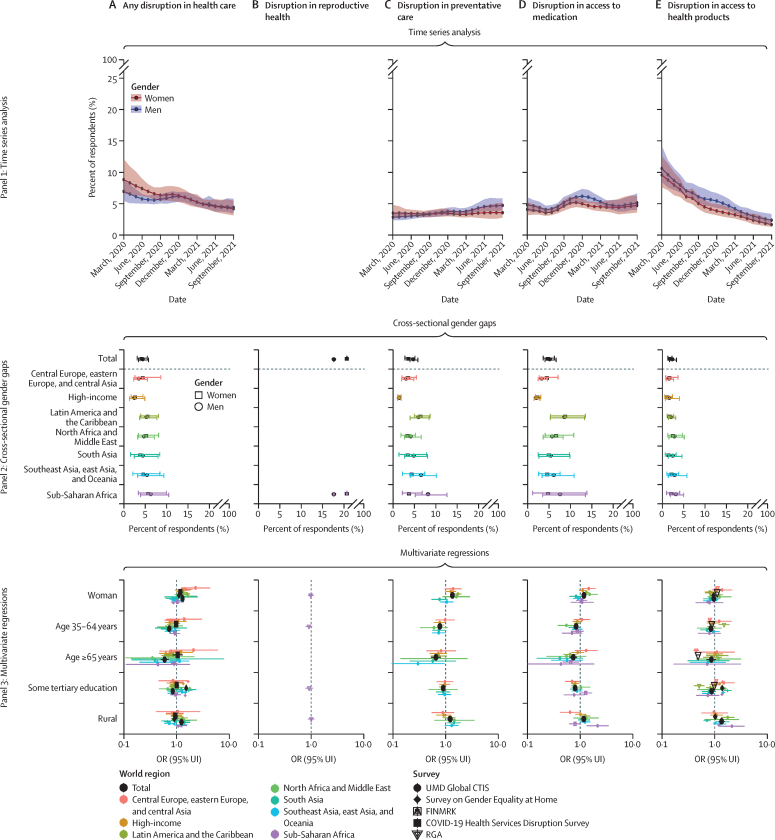
Methods: We reviewed publicly available datasets with information on indicators related to vaccine hesitancy and uptake, health care services, economic and work-related concerns, education, and safety at home and in the community. We used mixed effects regression, Gaussian process regression, and bootstrapping to synthesise all data sources. We accounted for uncertainty in the underlying data and modelling process. We then used mixed effects logistic regression to explore gender gaps globally and by region.

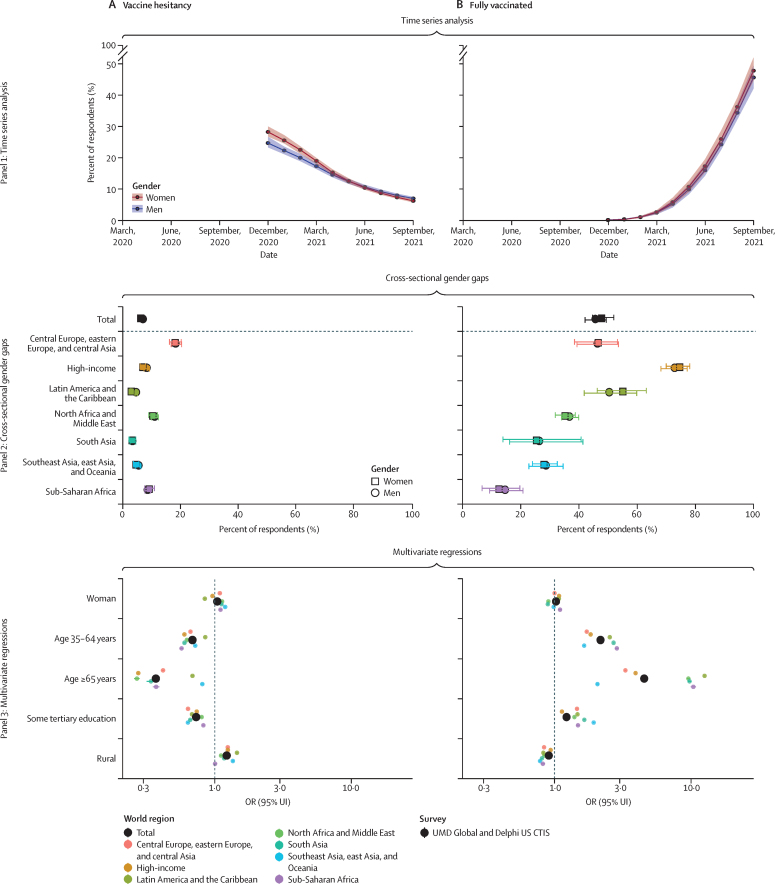
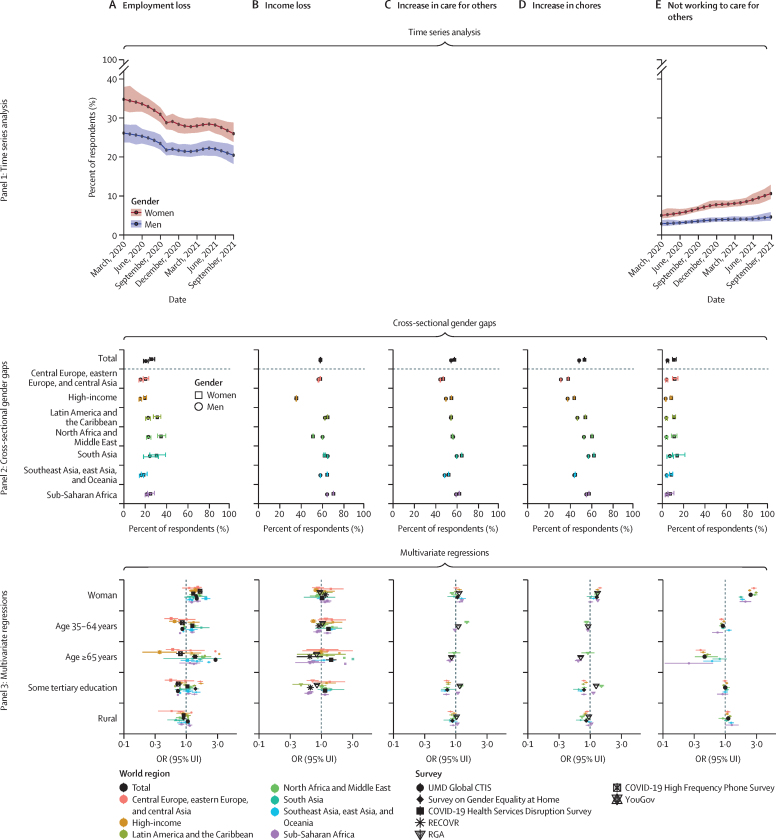
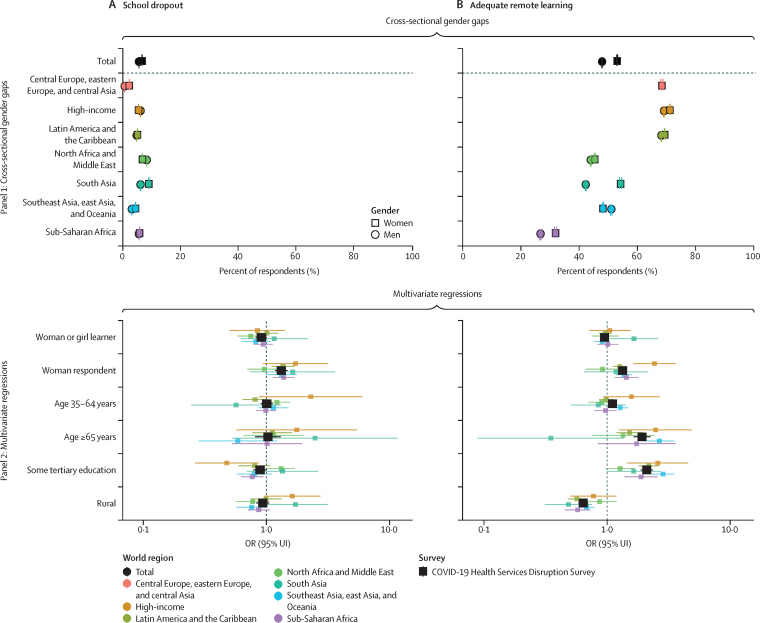
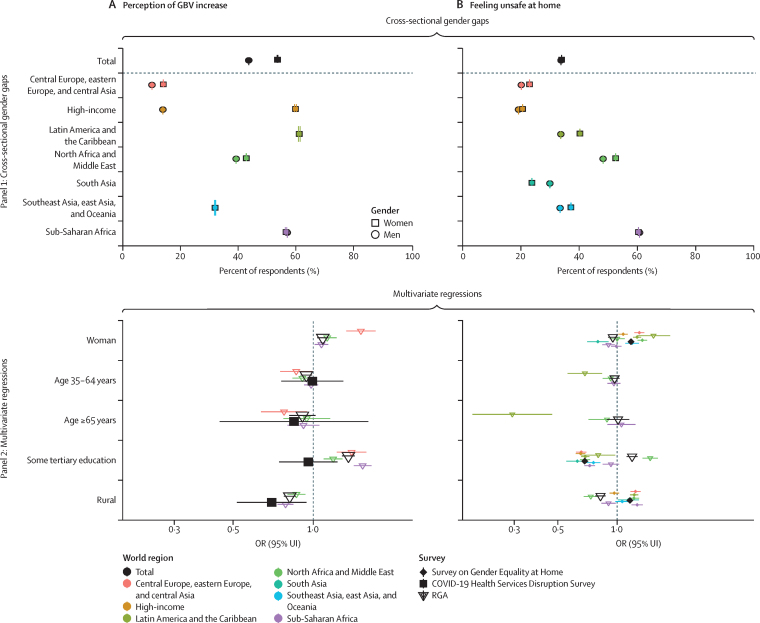
Findings: Between March, 2020, and September, 2021, women were more likely to report employment loss (26·0% [95% uncertainty interval 23·8-28·8, by September, 2021) than men (20·4% [18·2-22·9], by September, 2021), as well as forgoing work to care for others (ratio of women to men: 1·8 by March, 2020, and 2·4 by September, 2021). Women and girls were 1·21 times (1·20-1·21) more likely than men and boys to report dropping out of school for reasons other than school closures. Women were also 1·23 (1·22-1·23) times more likely than men to report that gender-based violence had increased during the pandemic. By September 2021, women and men did not differ significantly in vaccine hesitancy or uptake.

Interpretation: The most significant gender gaps identified in our study show intensified levels of pre-existing widespread inequalities between women and men during the COVID-19 pandemic. Political and social leaders should prioritise policies that enable and encourage women to participate in the labour force and continue their education, thereby equipping and enabling them with greater ability to overcome the barriers they face.

Funding: The Bill & Melinda Gates Foundation.


Conflict of interest statement

Declaration of Interests We declare no competing interests.

Figures

Figure 1
Figure 1
Time-series, cross-sectional, and multivariate logistic regression analyses for vaccination hesitancy and uptake indicators For vaccine hesitancy and uptake, input data were available for multiple time periods. Panel 1 (time-series analysis) shows the average estimated time trend across regions, with 95% prediction intervals. Panel 2 (cross-sectional gender gaps) shows cross-sectional estimates for indicators in September, 2021, summarised by gender and world region. Gender is indicated by point shape, and 95% uncertainty intervals (UIs) for each estimate are shown. Panel 3 (multivariate regressions) presents odds ratios (OR) and 95% UIs from mixed effects logistic regression models exploring the association between each indicator and gender, adjusting for geography, age, educational attainment, and urbanicity. We ran separate regressions for each data source that was available for each indicator to explore the sensitivity of our findings to the data source used. When possible, we additionally ran region-specific models to assess geographic variation in findings. Region is indicated by colour and data source is indicated by shape of the point. For each regression model covariate, the reference categories are listed in parentheses: woman (man); age 35–64 years (age <35 years); age ≥65 years (age <35); some tertiary education (less than tertiary education); and rural (urban). Delphi US CTIS=The Delphi Group at Carnegie Mellon University US COVID-19 Trends and Impact Survey, in partnership with Facebook. UMD Global CTIS=The University of Maryland Social Data Science Center Global COVID-19 Trends and Impact Survey, in partnership with Facebook.
Figure 2
Figure 2
Time-series, cross-sectional, and multivariate logistic regression analyses for health-care access indicators For any disruption in health care, preventative care, access to medication, and access to health products, input data were available for multiple time periods. Panel 1 (time-series analysis) shows the average estimated time trend across regions for these indicators, with 95% prediction intervals. Panel 2 (cross-sectional gender gaps) shows cross-sectional estimates for these indicators in September, 2021, summarised by gender and world region. For disruption in reproductive health, input data were only available cross-sectionally, and results are summarised by gender and world region in panel 2. Gender is indicated by point shape, and 95% uncertainty intervals (UIs) for each estimate are shown. For all health-care access indicators, panel 3 (multivariate regressions) presents odds ratios (OR) and 95% UIs from mixed effects logistic regression models exploring the association between each indicator and gender, adjusting for geography, age, educational attainment, and urbanicity. We ran separate regressions for each data source that was available for each indicator to explore the sensitivity of our findings to the data source used. We additionally ran region-specific models to assess geographic variation in findings. Region is indicated by colour and data source is indicated by shape of the point. For each regression model covariate, the reference categories are listed in parentheses: woman (man); age 35–64 (age <35 years); age ≥65 years (age <35 years); some tertiary education (less than tertiary education); and rural (urban). Because of differences in how age was recorded by source, for FINMRK, COVID-19 Health Services Disruption Survey, and COVID-19 Rapid Gender Assessment Survey (RGA), the age covariates listed as ages 35–64 years represent age group 25–44 years and the age covariates listed as age ≥65 years represent age group ≥45 years (reference category: age<25 years). Disruption in reproductive health was only investigated among reproductive age categories (up to age 45 years). Age information was not available from the Survey on Gender Equality at Home. FINMRK=Measuring COVID-19 Impacts, Mitigation and Awareness Survey. UMD Global CTIS=The University of Maryland Social Data Science Center Global COVID-19 Trends and Impact Survey, in partnership with Facebook. RGA=COVID-19 Rapid Gender Assessment survey.
Figure 3
Figure 3
Time-series, cross-sectional, and multivariate logistic regression analyses for economic and work-related concerns indicators For employment loss indicator and not working to care for others indicator, input data were available for multiple time periods. Panel 1 (time-series analysis) shows the average estimated time trend across regions for these indicators, with 95% prediction intervals. Panel 2 (cross-sectional gender gaps) shows cross-sectional estimates for these indicators in September, 2021, summarised by gender and world region. For income loss, increase in care for others, and increase in chores, input data were only available cross-sectionally, and results are summarised by gender and world region in panel 2. Gender is indicated by point shape, and 95% uncertainty intervals (UIs) for each estimate are shown. For all economic and work-related concerns indicators, panel 3 (multivariate regressions) presents odds ratios (OR) and 95% uncertainty intervals from mixed effects logistic regression models exploring the association between each indicator and gender, adjusting for geography, age, educational attainment, and urbanicity. We ran separate regressions for each data source available for each indicator to explore the sensitivity of our findings to the data source used. When possible, we additionally ran region-specific models to assess geographic variation in findings. Region is indicated by colour and data source is indicated by shape of the point. For each regression model covariate, the reference categories are listed in parentheses: woman (man); age 35–64 years (age <35 years); age ≥65 years (age <35); some tertiary education (less than tertiary education); and rural (urban). Because of differences in how age was recorded by source, for the Measuring COVID-19 Impacts, Mitigation and Awareness Survey (FINMRK), COVID-19 Health Services Disruption Survey, and COVID-19 Rapid Gender Assessment survey (RGA), the age covariates listed as age 35–64 years represent age group 25–44 years and the age covariates listed as age ≥65 years represent age group ≥45 years (reference category: age <25 years). Age information was not available from the Survey on Gender Equality at Home. Delphi US CTIS=The Delphi Group at Carnegie Mellon University US COVID-19 Trends and Impact Survey, in partnership with Facebook. FINMRK=Measuring COVID-19 Impacts, Mitigation and Awareness Survey. UMD Global CTIS=The University of Maryland Social Data Science Center Global COVID-19 Trends and Impact Survey, in partnership with Facebook. RECOVR=Research for Effective Covid-19 Response Panel Survey. RGA=COVID-19 Rapid Gender Assessment survey.
Figure 4
Figure 4
Cross-sectional and multivariate logistic regression analyses for education indicators For school dropout and adequate remote learning, input data were available cross-sectionally and are summarised by gender and world region in panel 1 (cross-sectional gender gaps). Gender is indicated by point shape, and 95% uncertainty intervals (UIs) for each estimate are shown. Panel 2 (multivariate regressions) presents odds ratios (OR) and 95% UIs from mixed effects logistic regression models exploring the association between each indicator and gender of the learner, adjusting for gender of respondent, geography, age, educational attainment, and urbanicity. We additionally ran region-specific models to assess geographic variation in findings. Region is indicated by colour and data source is indicated by shape of the point. For each regression model covariate, the reference categories are listed in parentheses: woman or girl learner (man or boy learner); woman respondent (man respondent); age 35–64 years (age <35 years); aged ≥65 years (age <35 years); some tertiary education (less than tertiary education); and rural (urban).
Figure 5
Figure 5
Cross-sectional and multivariate logistic regression analyses for safety at home and in the community indicators For perception of gender-based violence (GBV) increase and feeling unsafe at home, input data were available cross-sectionally and are summarised by gender and world region in panel 1 (cross-sectional gender gaps). Gender is indicated by point shape, and 95% uncertainty intervals (UIs) for each estimate are shown. Panel 2 (multivariate regressions) presents odds ratios (OR) and 95% UIs from mixed effects logistic regression models exploring the association between each indicator and gender, adjusting for geography, age, educational attainment, and urbanicity. When possible, we additionally ran region-specific models to assess geographic variation in findings. The geography of the finding is indicated by colour and the data source is indicated by the shape of the point. For each regression model covariate, the reference categories are listed in parentheses: woman (man); age 35–64 years (age <35 years); age ≥65 years (age <35 years); some tertiary education (less than tertiary education); and rural (urban). Because of differences in how age was recorded by source, for COVID-19 Health Services Disruption Survey, the age covariates listed as age 35–64 years represent age group 25–44 years and the age covariates listed as age ≥65 years represent age group ≥45 years (reference category: age <25 years). Age information was not available from the Survey on Gender Equality at Home. RGA=COVID-19 Rapid Gender Assessment survey.

Comment in

References

    1. UN Women . United Nations Women; New York: 2021. Progress on the Sustainable Development Goals: the gender snapshot.https://www.unwomen.org/en/digital-library/publications/2021/09/progress...
    1. Institute for Health Metrics and Evaluation COVID-19 resources. March 24, 2020. https://www.healthdata.org/covid
    1. Global Health 50/50 Men, sex, gender and COVID-19. 2021. https://globalhealth5050.org/the-sex-gender-and-covid-19-project/men-sex...
    1. Bill & Melinda Gates Foundation Gates gender equality toolbox. 2021. https://www.gatesgenderequalitytoolbox.org/definitions-concepts/gender-e...
    1. UNDESA Integrating a gender perspective into statistics. 2017. https://unstats.un.org/unsd/demographic-social/Standards-and-Methods/fil...

Uncited References

    1. Seguino S. The global economic crisis, its gender and ethnic implications, and policy responses. Gend Dev. 2010;18:179–199.