. 2022 Mar 14;57(5):654-669.e9.
doi: 10.1016/j.devcel.2022.02.010. Epub 2022 Mar 4.

The evolutionarily conserved arginyltransferase 1 mediates a pVHL-independent oxygen-sensing pathway in mammalian cells

Affiliations

The evolutionarily conserved arginyltransferase 1 mediates a pVHL-independent oxygen-sensing pathway in mammalian cells

Balaji T Moorthy et al. Dev Cell. .

Abstract

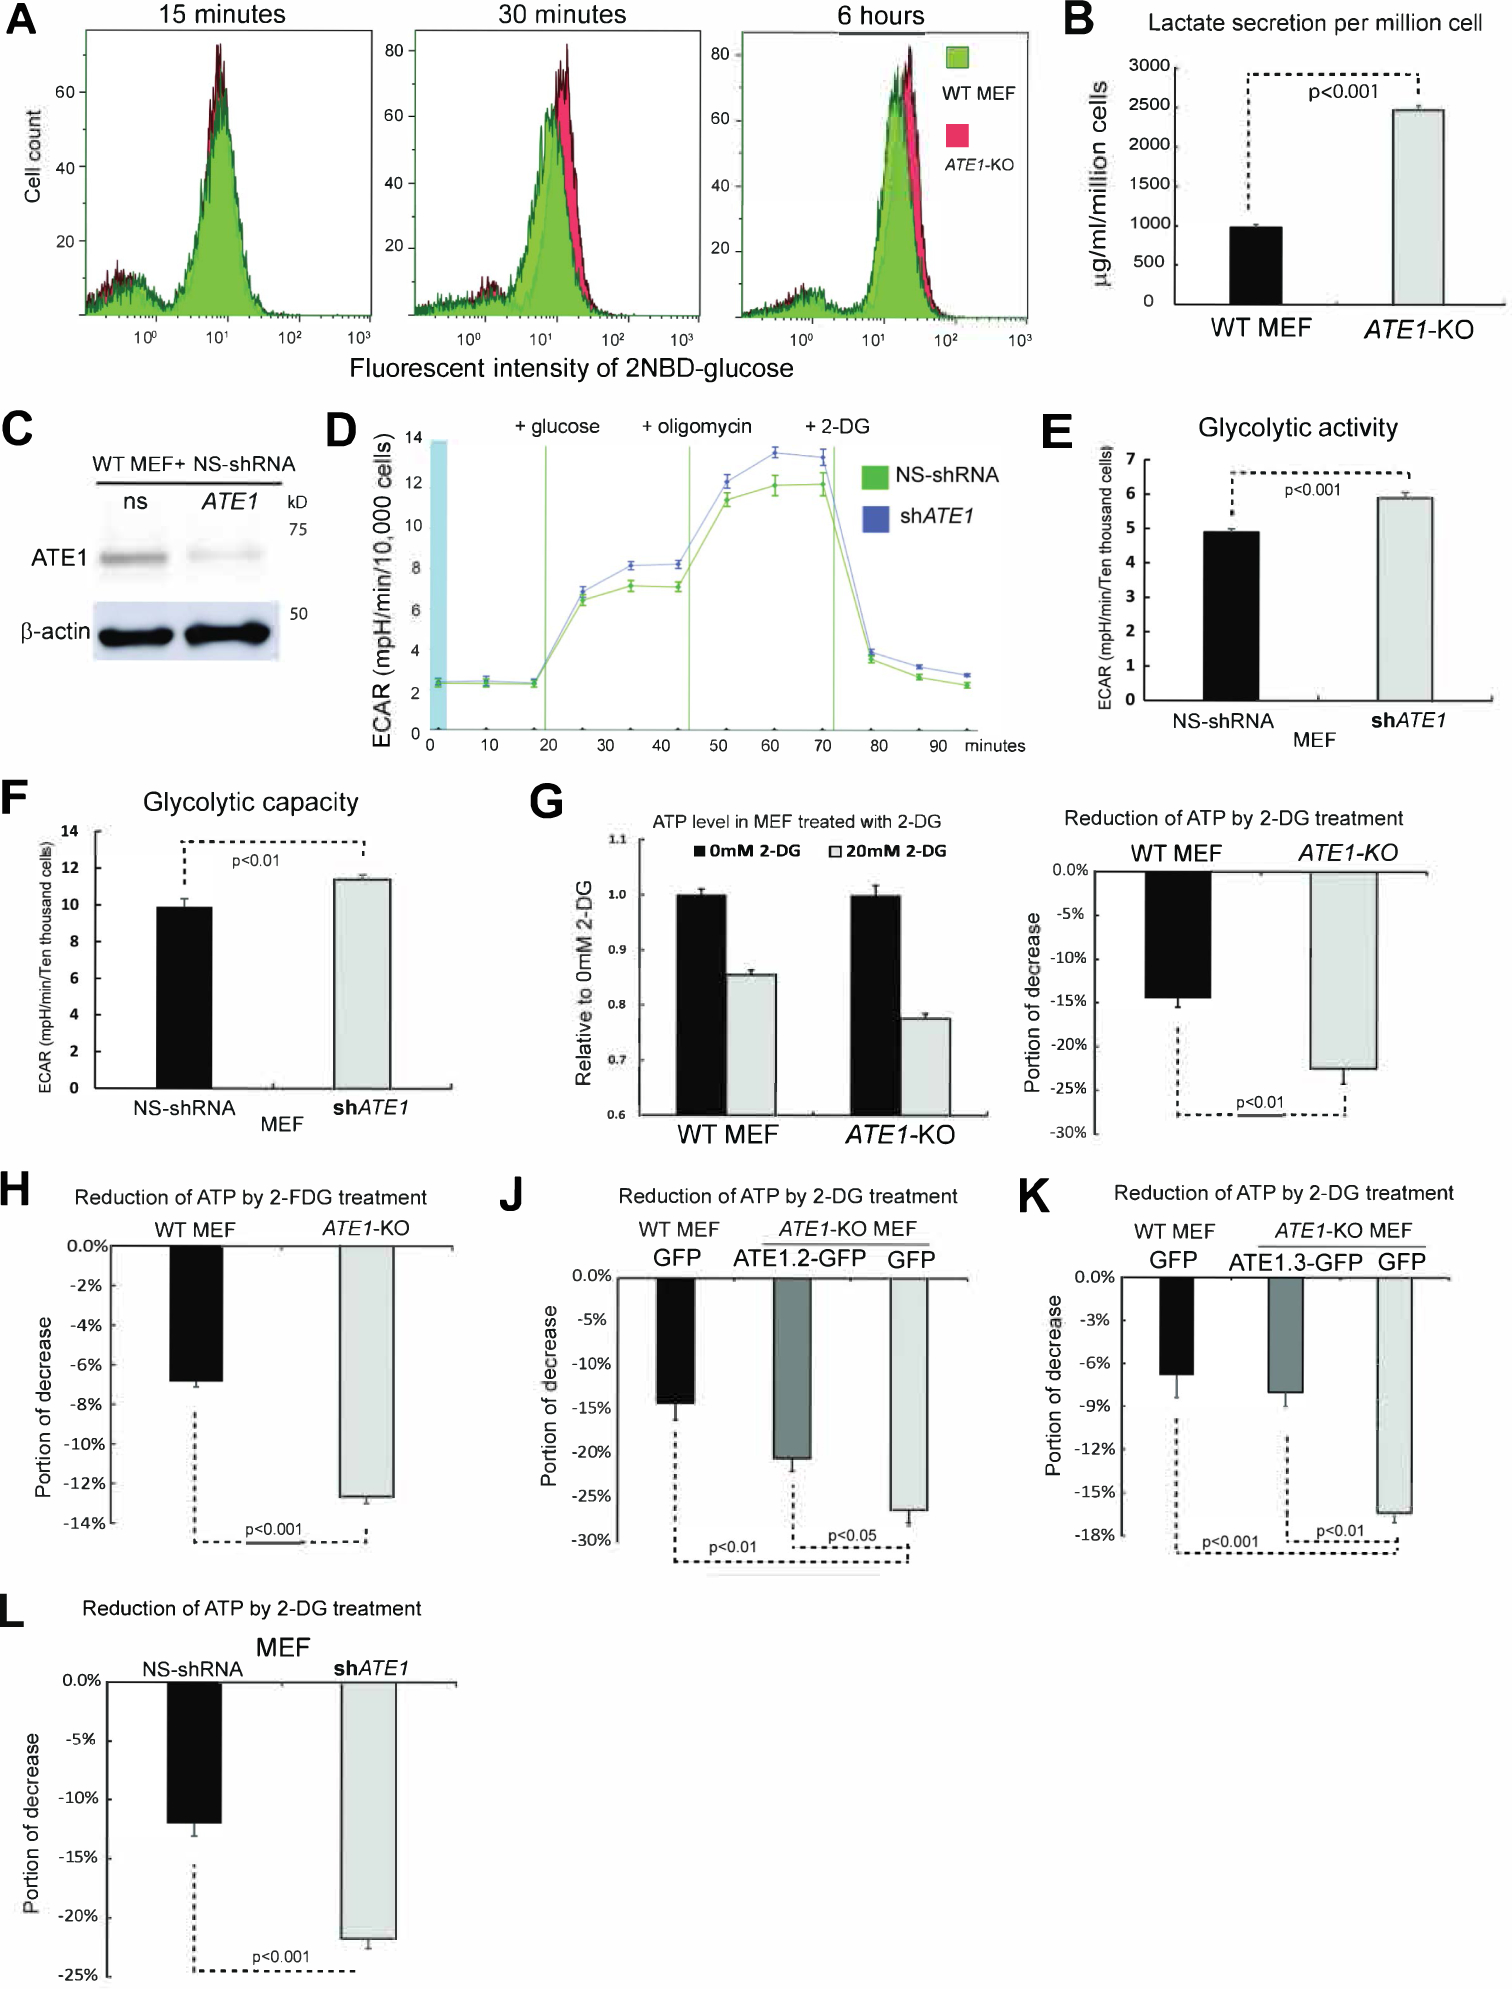
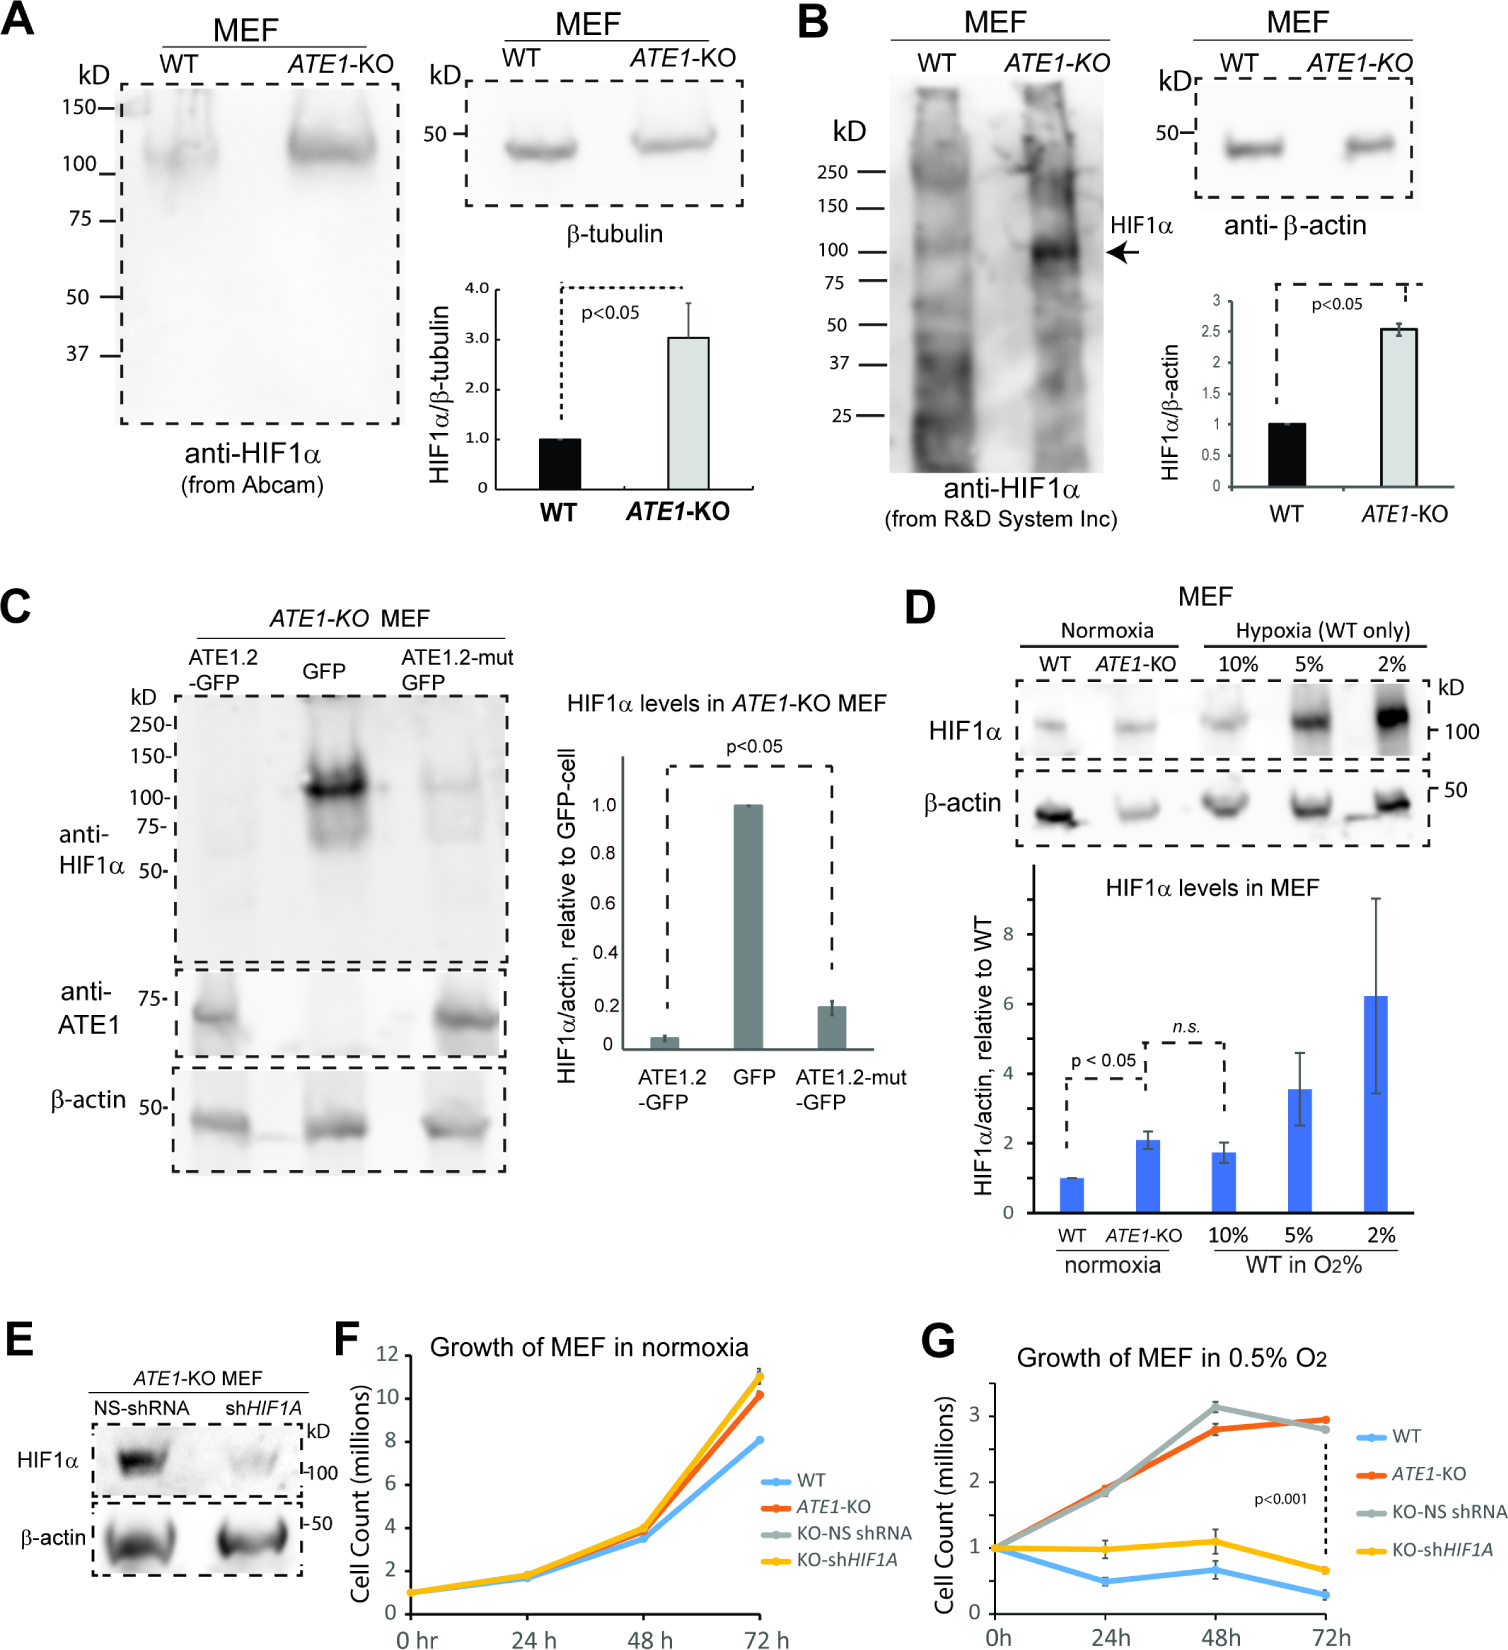
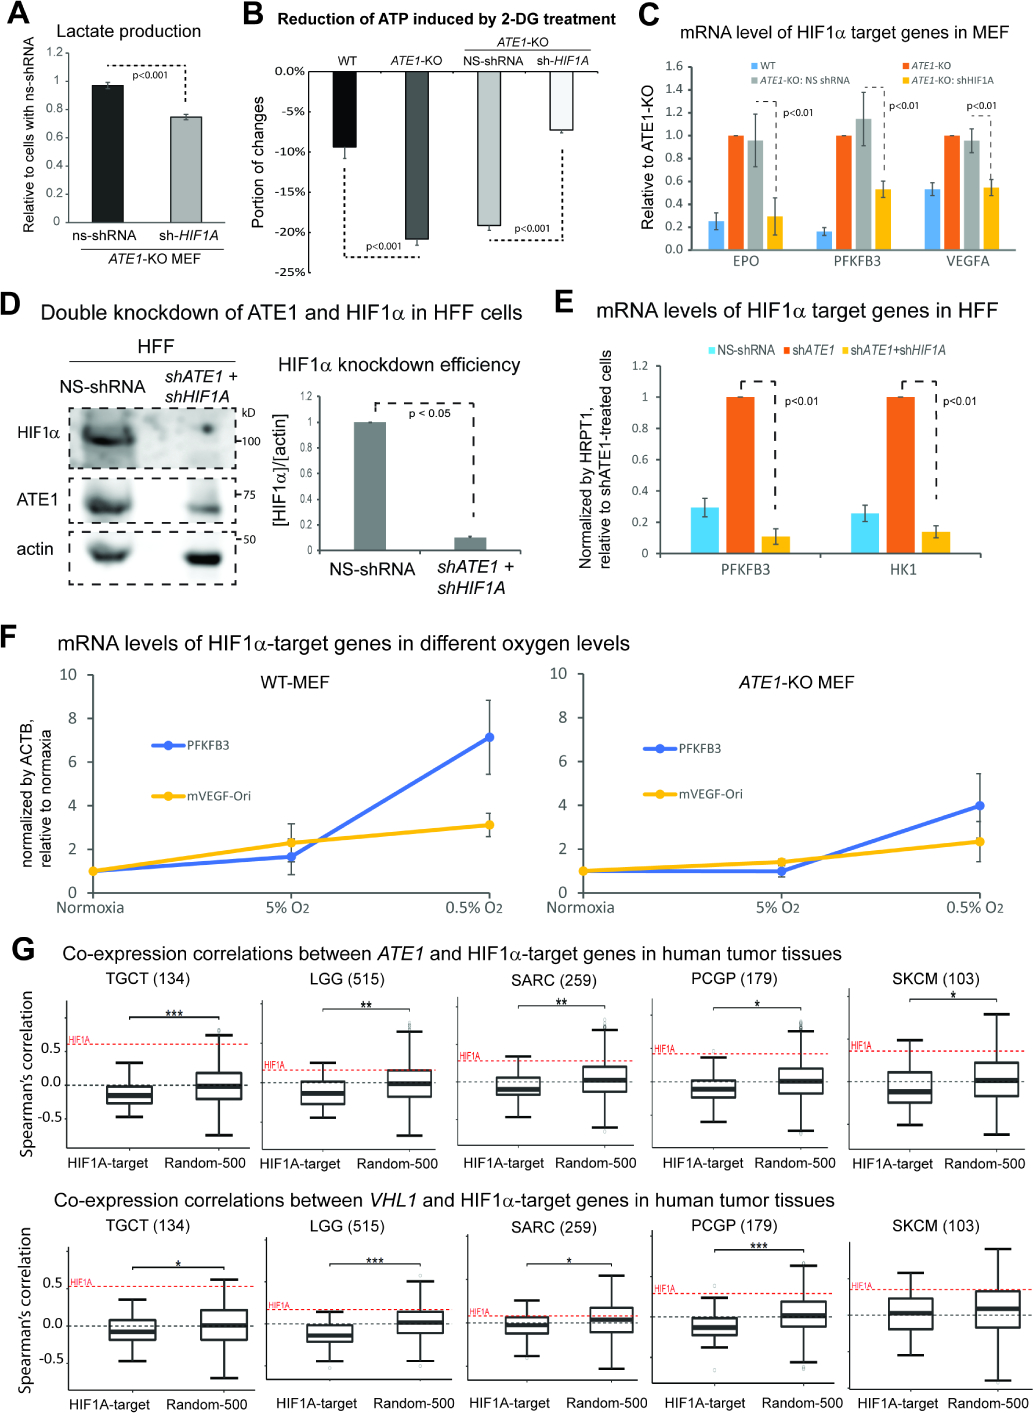
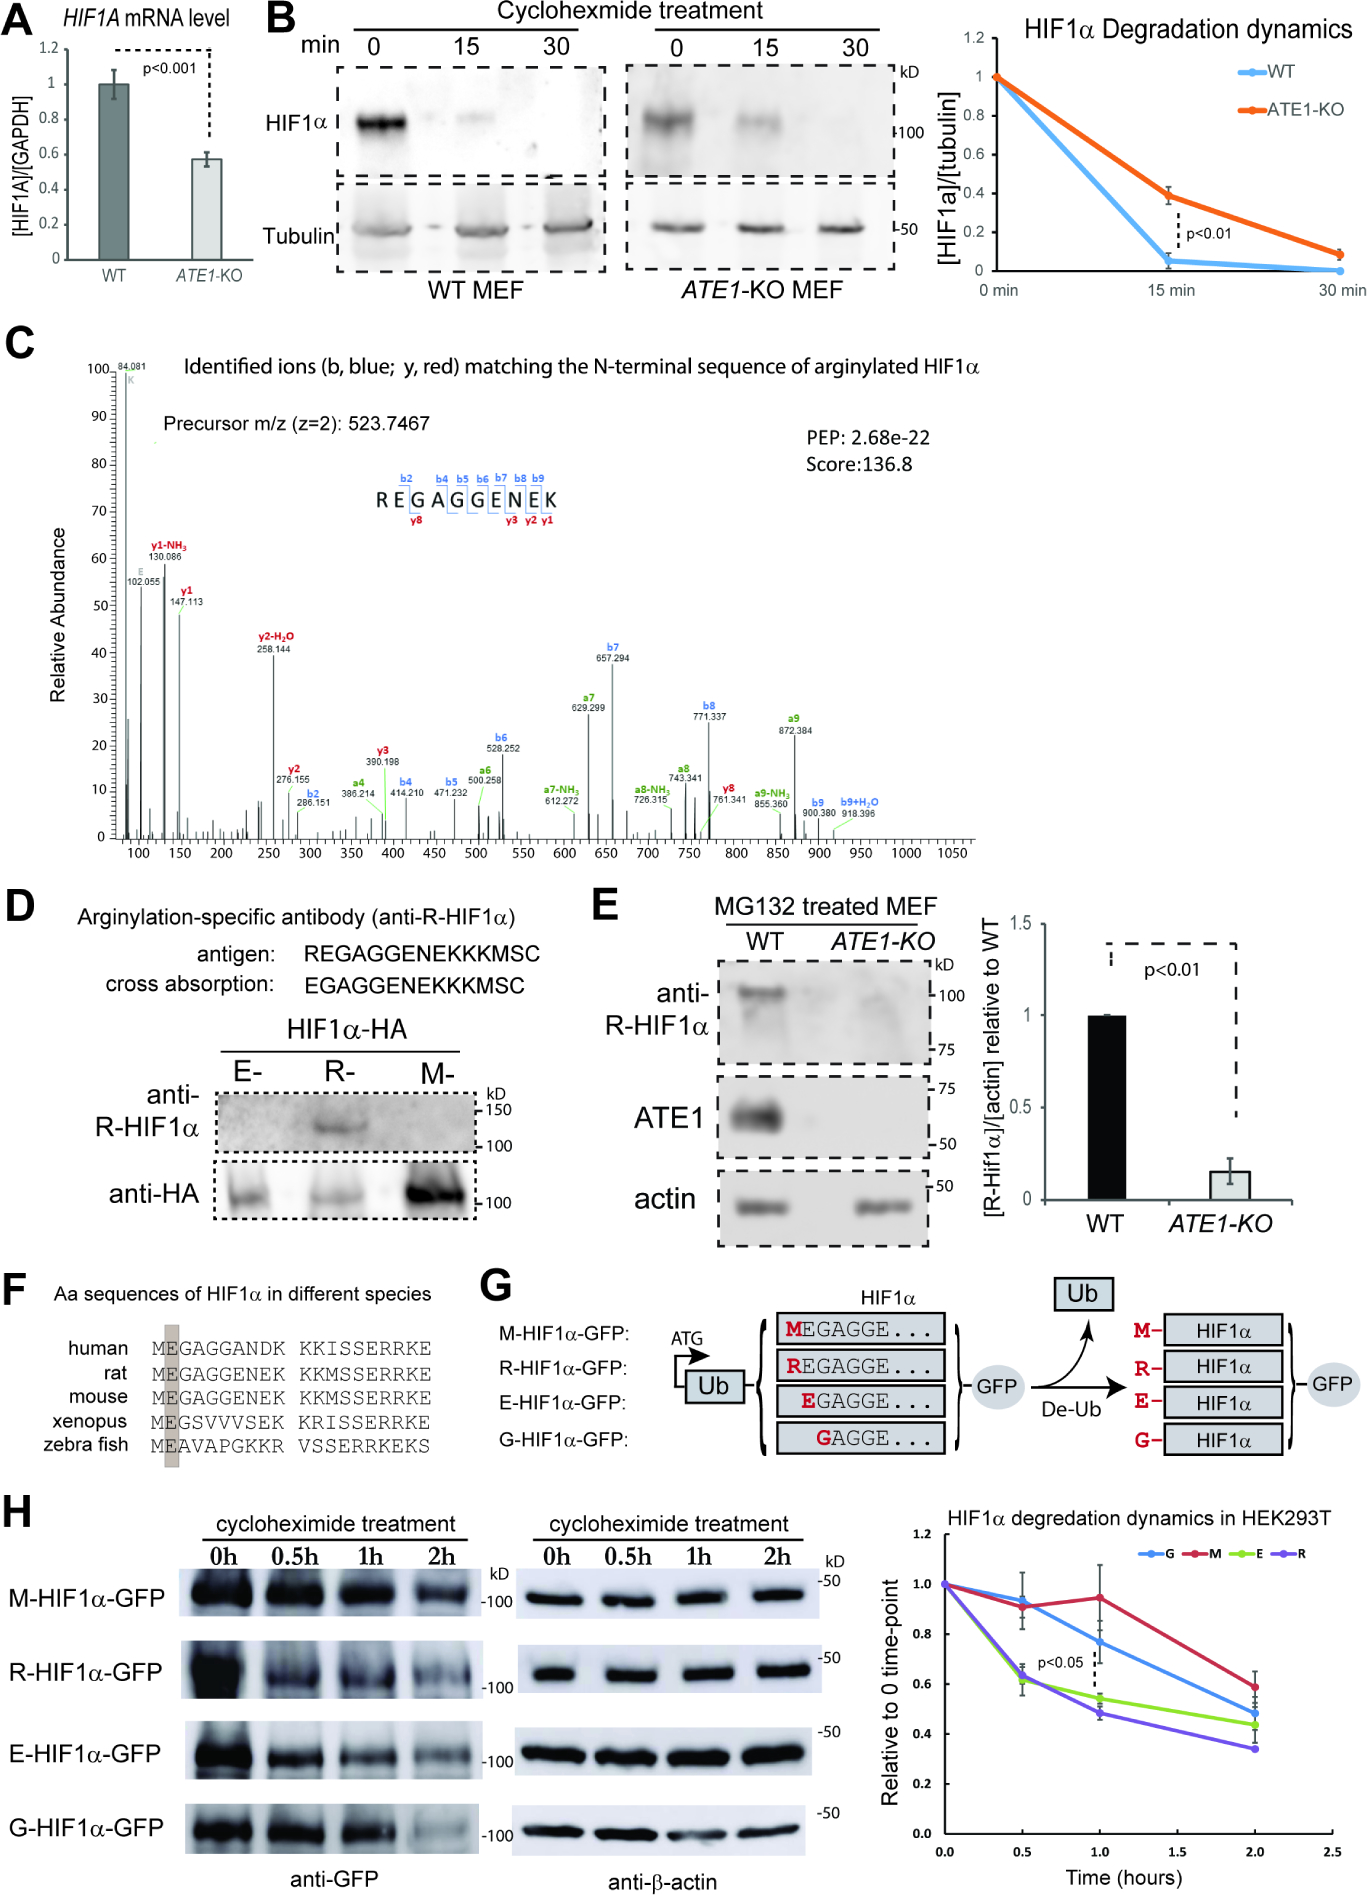
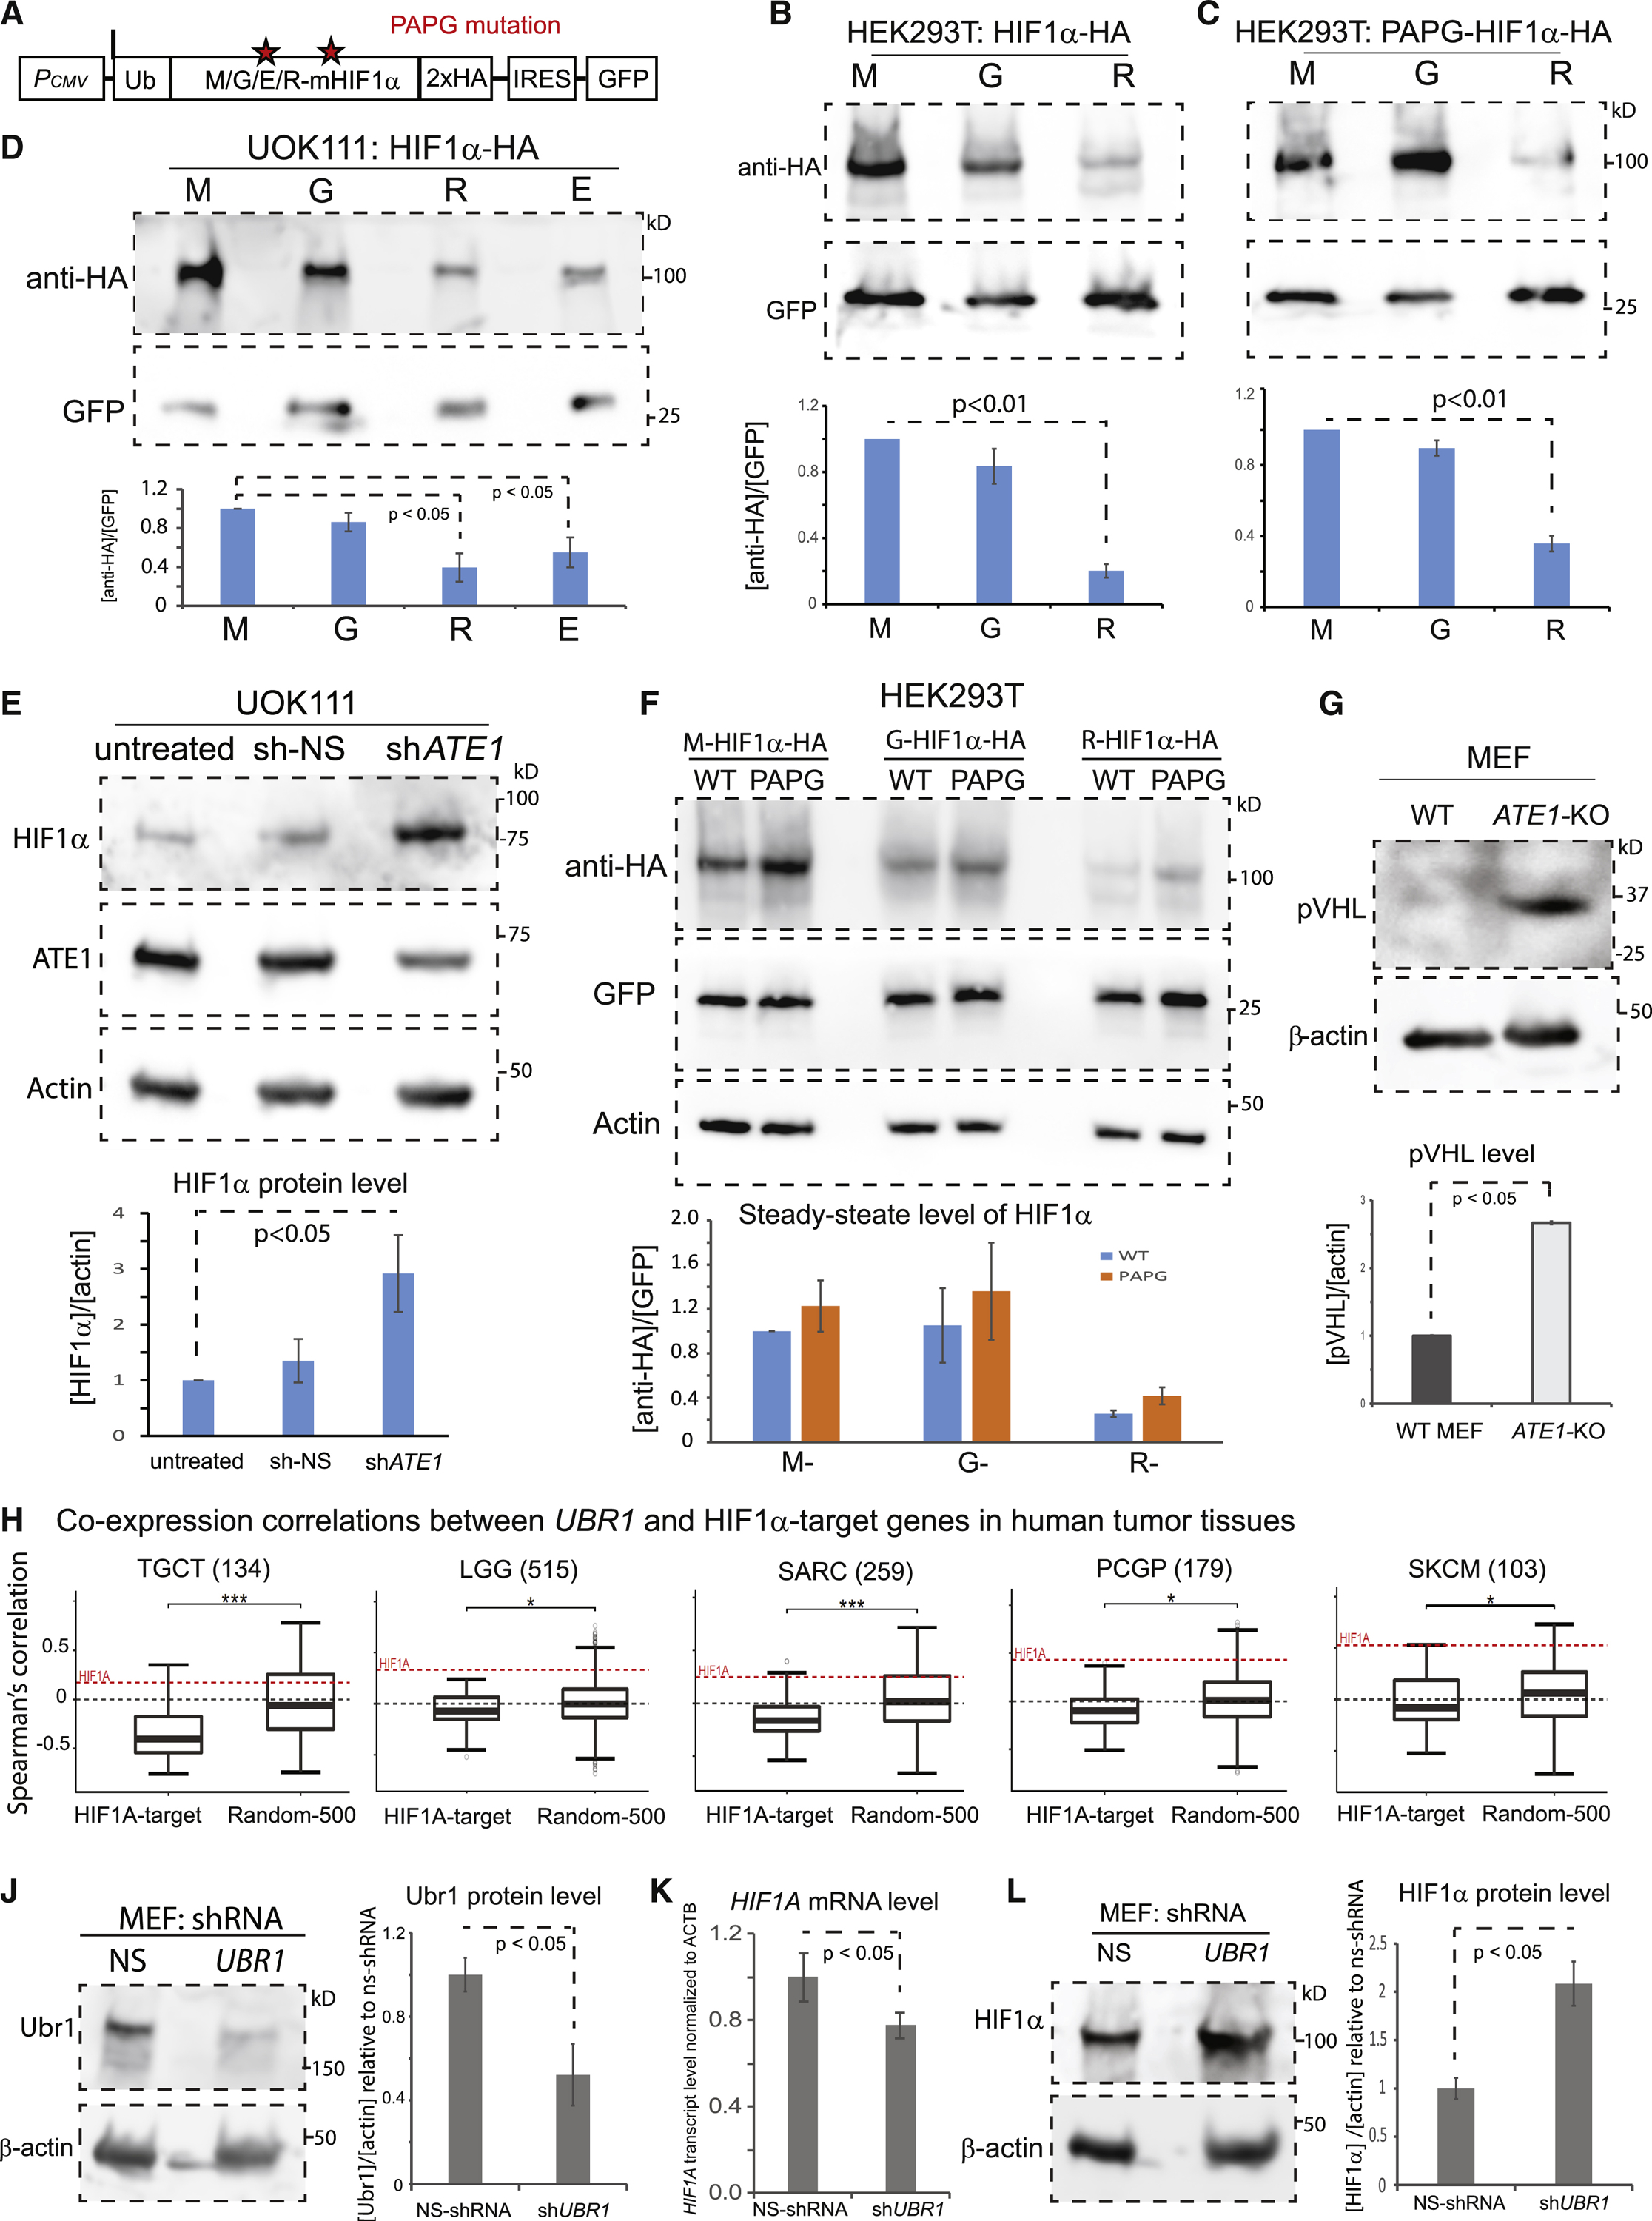
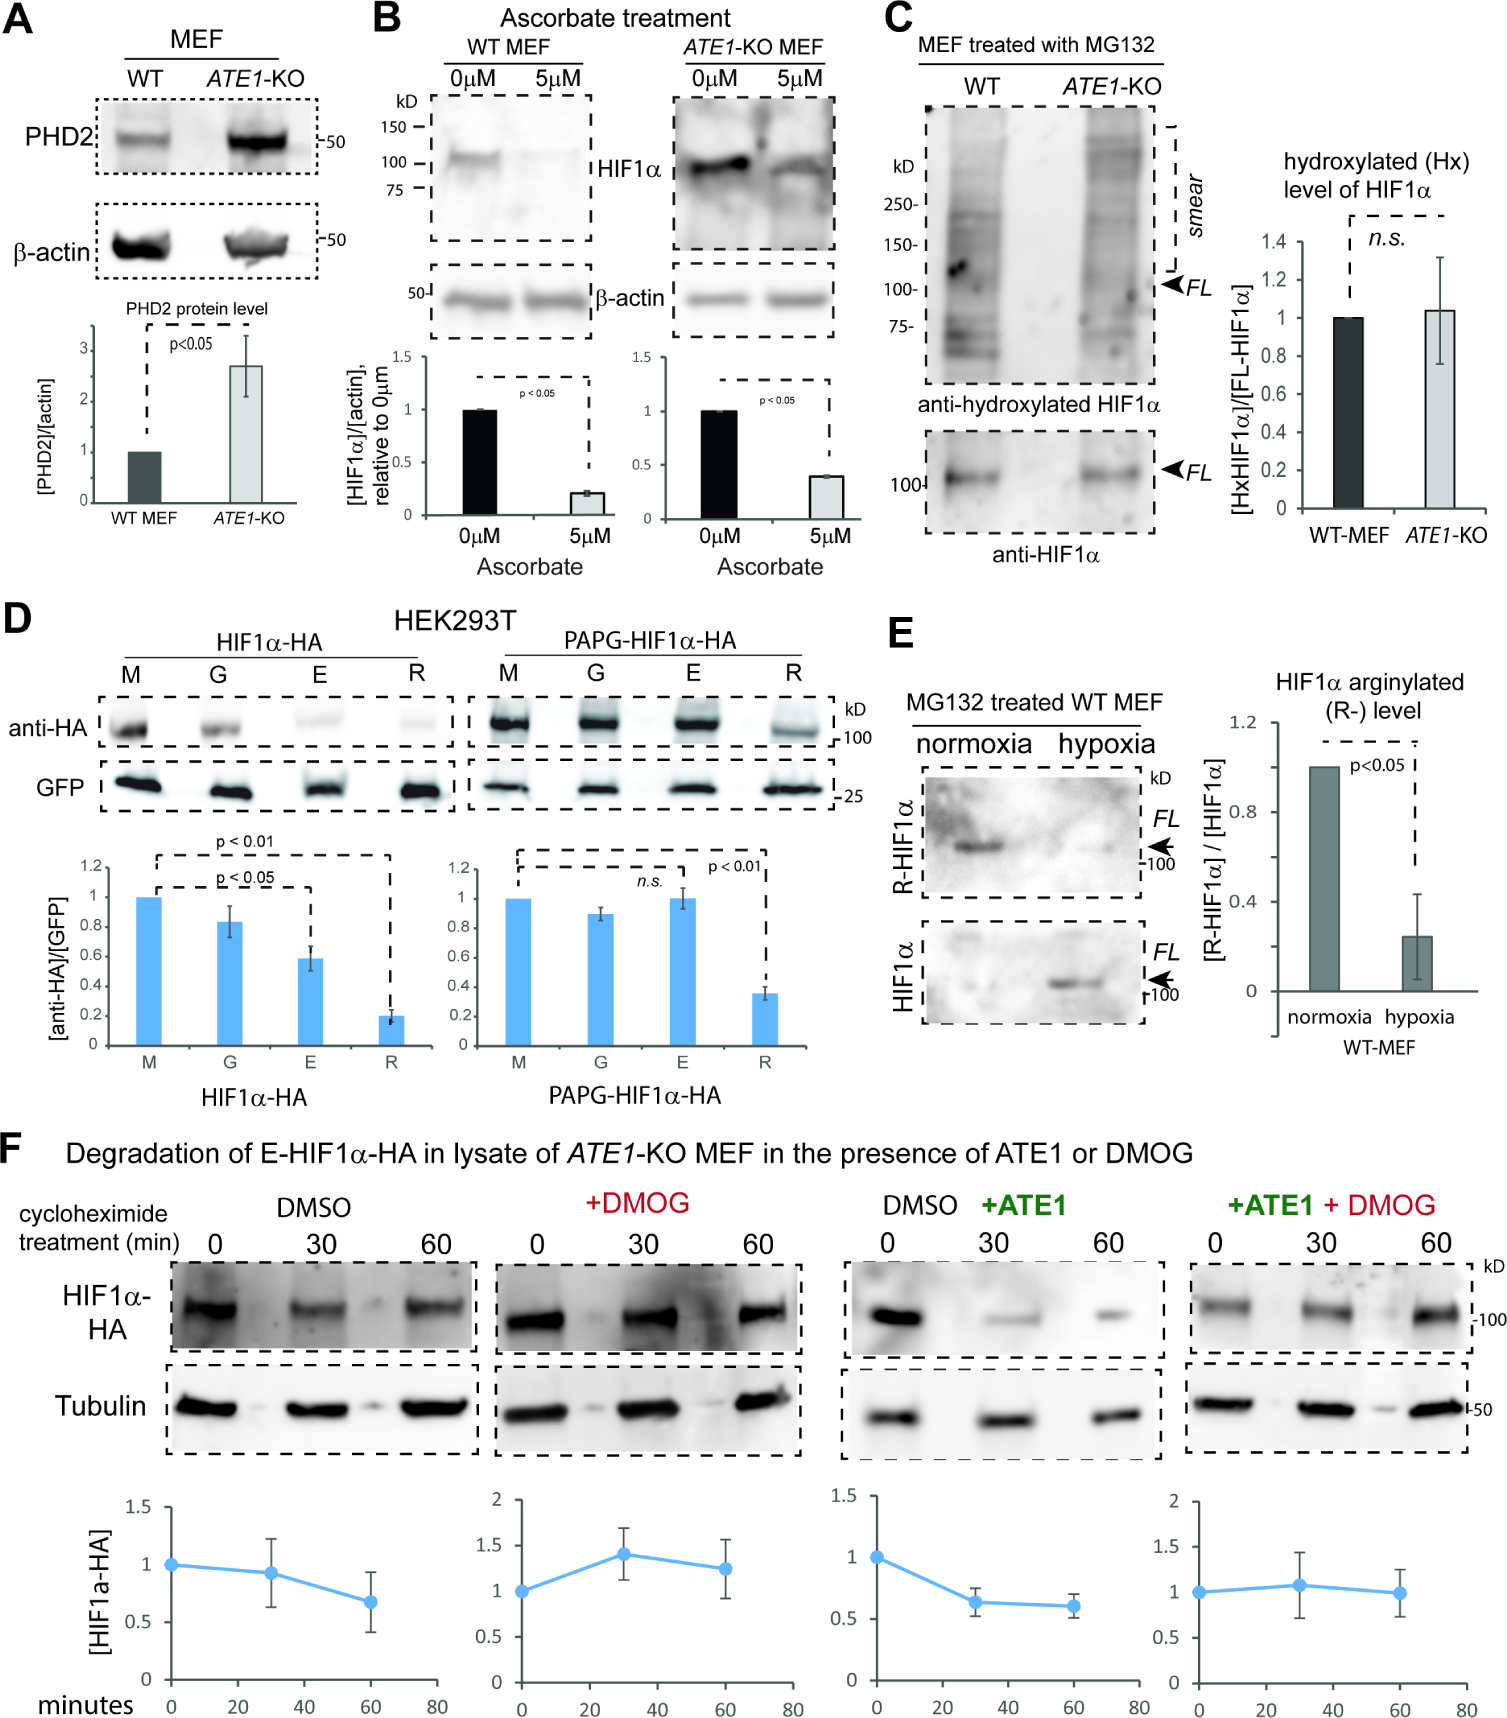
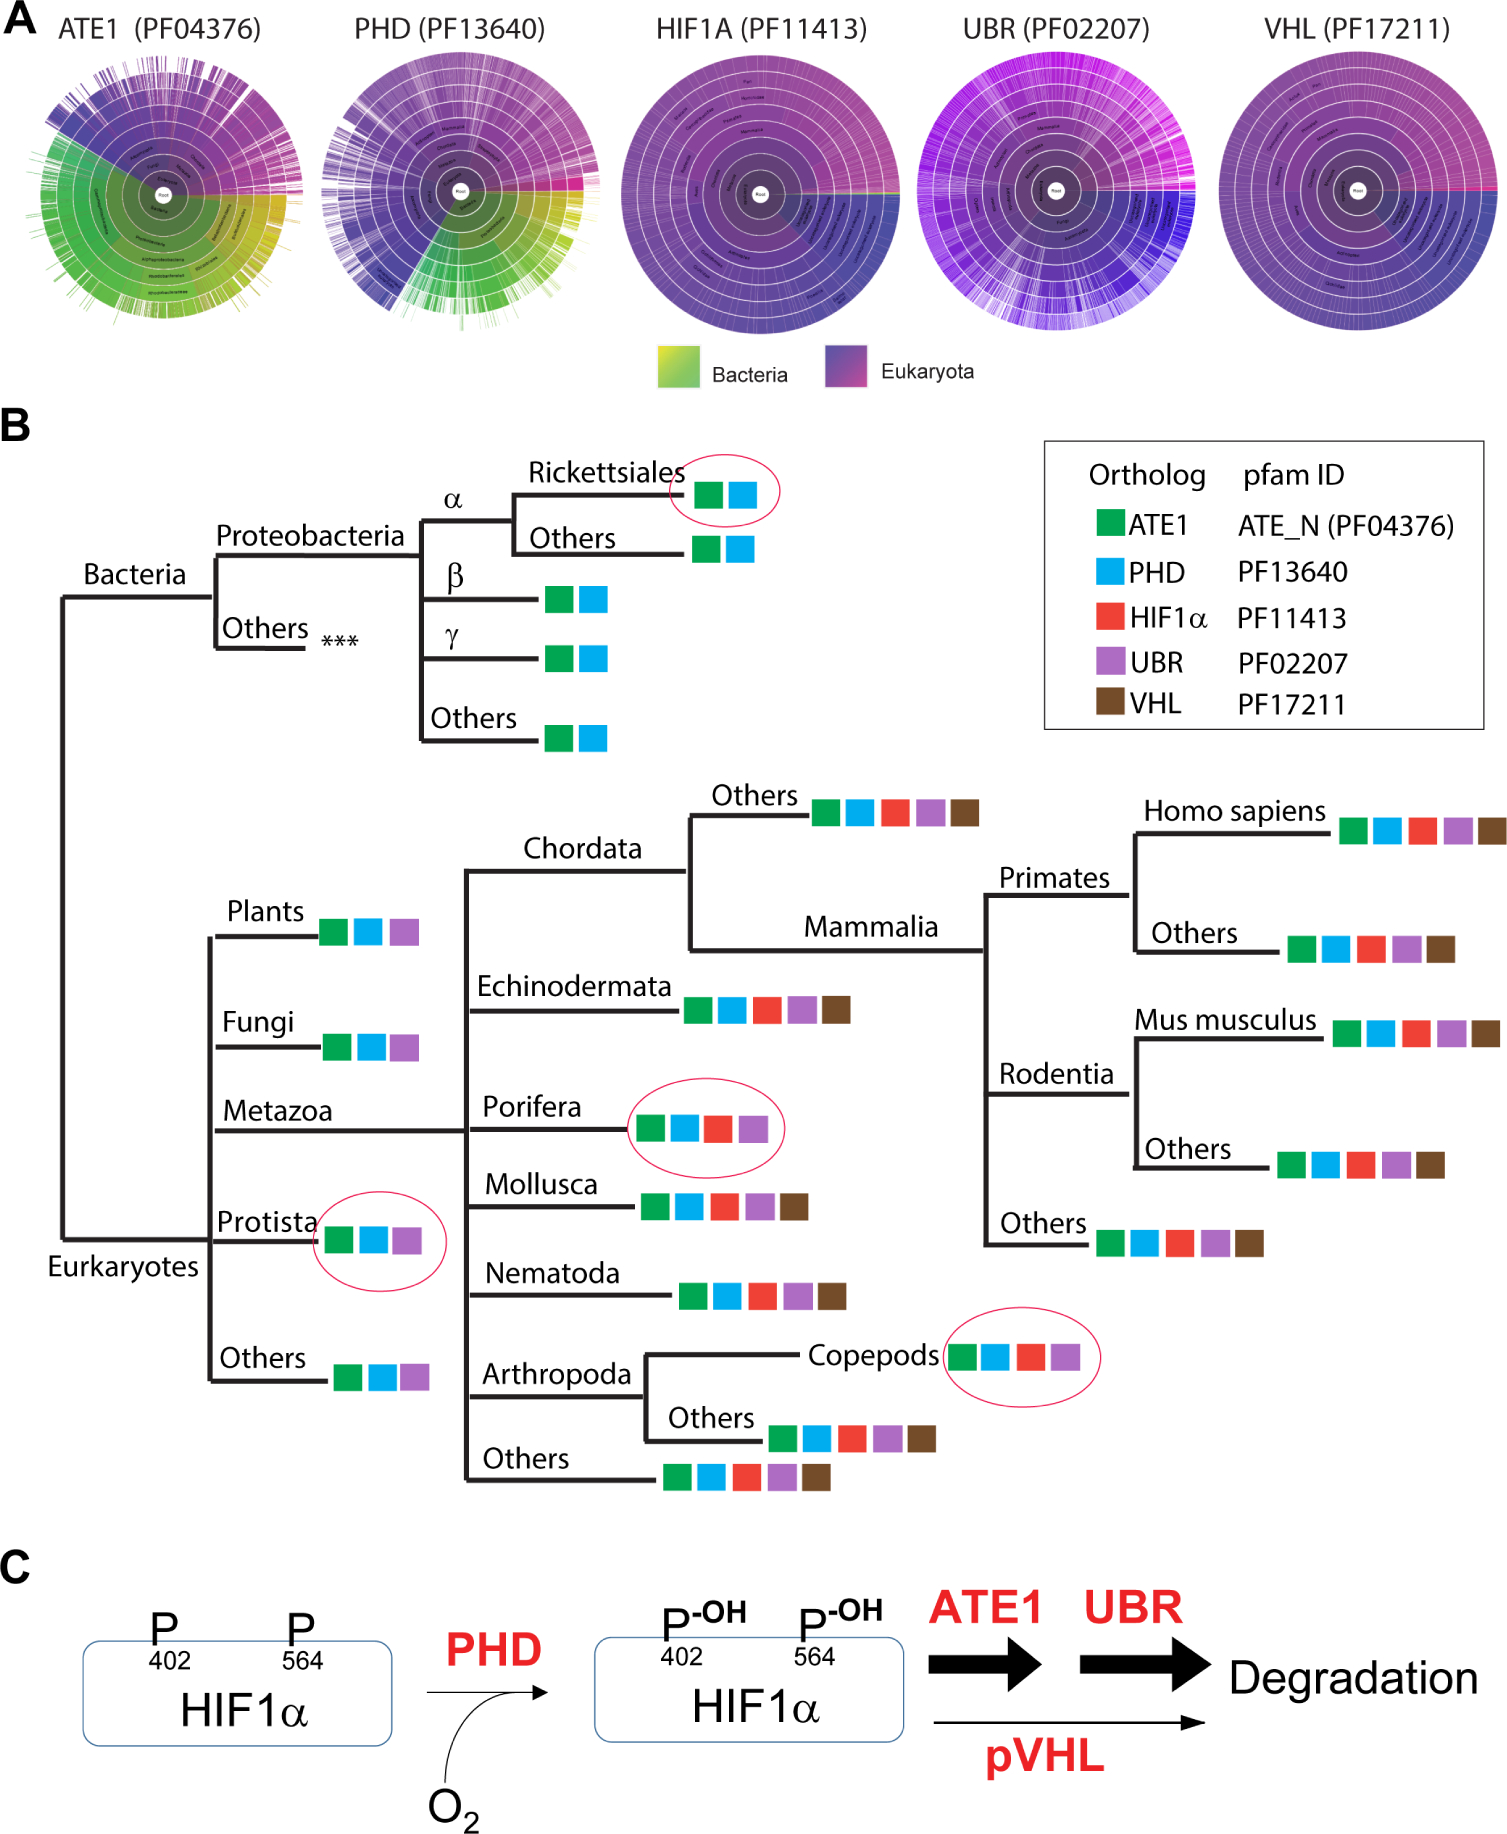
The response to oxygen availability is a fundamental process concerning metabolism and survival/death in all mitochondria-containing eukaryotes. However, the known oxygen-sensing mechanism in mammalian cells depends on pVHL, which is only found among metazoans but not in other species. Here, we present an alternative oxygen-sensing pathway regulated by ATE1, an enzyme ubiquitously conserved in eukaryotes that influences protein degradation by posttranslational arginylation. We report that ATE1 centrally controls the hypoxic response and glycolysis in mammalian cells by preferentially arginylating HIF1α that is hydroxylated by PHD in the presence of oxygen. Furthermore, the degradation of arginylated HIF1α is independent of pVHL E3 ubiquitin ligase but dependent on the UBR family proteins. Bioinformatic analysis of human tumor data reveals that the ATE1/UBR and pVHL pathways jointly regulate oxygen sensing in a transcription-independent manner with different tissue specificities. Phylogenetic analysis suggests that eukaryotic ATE1 likely evolved during mitochondrial domestication, much earlier than pVHL.

Keywords: ATE1; Arginylation; HIF1α; Warburg effect; arginyltransferase; degradation; glycolysis; hypoxic signaling; oxygen sensing; posttranslational protein modification.


Conflict of interest statement

Declaration of interests The authors declare no conflict of interest.

Figures

Figure 1.
Figure 1.. Depletion of ATE1 increases glycolysis
A) Glucose intake in WT and ATE1-KO MEF at increasing time points measured by flow cytometry using the green-fluorescent glucose analog, 2-(N-(7-Nitrobenz-2-oxa-1,3-diazol-4-yl)Amino)-2 (2-NBDG). B) Concentration of lactate secreted in the medium in 24 hrs by WT and ATE1-KO MEF (n=7). See also Suppl Figure S1A for the color of culture media. Throughout this study, error bars represent standard error of mean (SEM) and p-values were calculated by Student’s t-test. A p-value >0.05 was considered non-significant (n.s). C) Knockdown of ATE1 by specific shRNA compared to non-silencing (NS) control. D) The curve of extracellular acidification rate (ECAR) measured with a Seahorse flux analyzer in MEF with ATE1-knockdown or NS control (n=10). E) Glycolytic activity and (F) maximum glycolytic capacity of MEF with ATE1-knockdown or NS control measured in Seahorse flux analyzer (n= 10). G) Left panel: ATP concentrations in WT and ATE1-KO MEF with or without 20mM 2-DG (n=5), individually and internally normalized to a random group without 2-DG. Right panel: 2-DG-induced ATP reduction (n=5). See also Suppl Fig. S1B for the direct comparison of ATP levels in WT and ATE1-KO cells. H) Similar as (G), except with 15 mM 2-FDG (n=5). J) 2-DG induced ATP reduction in WT or ATE1-KO MEF expressing GFP alone or GFP conjugated ATE1 isoform-2 (an enzymatic potent and ubiquitously expressed splice variant(Rai and Kashina, 2005, Wang et al., 2011)) (n=5). K) similar to (J), except that Ate1 isoform-3 (which is also expressed in MEF(Rai and Kashina, 2005)) was used (n=5). L) 2-DG induced ATP reduction in MEF treated with NS- or ATE1-specific shRNA (n=5).
Figure 2.
Figure 2.. ATE1 regulates hypoxia response.
See also Suppl Fig. S1C and 1D for the identification of potential ATE1 substrates with antibody arrays. A) HIF1α in WT and ATE1-KO MEF probed with monoclonal rabbit anti HIF1α (Abcam, Cambridge, MA, Cat# ab179483, used as elsewhere in this study unless otherwise indicated). The β-actin was used as a loading control. The graph at the bottom right shows the quantification (n=6). (B) Similar as (A), except with mouse anti-Hif1α (R&D systems, Cat# MAB1536) (n=3). C) Left panel: the level of HIF1α in ATE1-KO MEF stably expressing either ATE1.2-GFP, mutant ATE1.2-C23–25S (labeled as ATE1.2-mut) with a reduced enzymatic activity(Kumar et al., 2016, Berleth et al., 1992, Li and Pickart, 1995a, Li and Pickart, 1995b), or the GFP alone. The level of recombinant ATE1 was probed with anti-ATE1. β-actin is used as loading control. Graph on the right shows quantification (n=3) of HIF1α in relative to GFP-expressing cells. The levels of ATE1-GFP (probed by anti-ATE1 on a different gel with the same cell samples) were also shown. D) The levels of HIF1α in WT and ATE1-KO MEF maintained under normoxia (18% O2 for typical culture conditions), in comparison to WT MEF exposed to different O2 concentrations for 6 hours. β-actin was used as loading control. Graph on the bottom shows quantification (n=6). E) Representative immunoblot showing the efficiency of shRNA knockdown of HIF1A in ATE1-KO MEF. F) Time-dependent viable cell counts (with trypan blue) under normoxia (18% O2) for WT MEF and ATE1-KO MEF (non-treated, treated with NS- or HIF1A- shRNA) (n=4). Please note that the curves for non-treated and NS-shRNA ATE1-KO nearly overlap. (G) Similar to (F) except under hypoxia (0.5% O2) condition.
Figure 3:
Figure 3:. Ate1 regulates glycolysis and HIF1α signaling
A) Lactate secretion in the media over 24 hours for ATE1-KO MEF with HIF1α-specific or NS shRNA (n=4). B) The 2-DG-induced ATP reduction in MEF WT, ATE1-KO, ATE1-KO with NS- or HIF1α-specific shRNA (n=5). C) The mRNA levels of HIF1α-target genes EPO, PFKFB3 and VEGFA in MEFs of WT, ATE1-KO, ATE1-KO with NS- or HIF1A-shRNA. Quantified by quantitative RT-PCR using 18S rRNA as a loading control (n=3). D) Representative immunoblot and quantification (n=3) showing the efficiency of a double knockdown of HIF1A and ATE1, in HFF. E) The mRNA levels of HIF1α-target genes, PFKFB3 and hexokinase-1 (HK1), in HFF treated with either: NS-shRNA, ATE1-shRNA, or ATE1- + HIF1A-shRNAs. Human hypoxanthine phosphoribosyltransferase 1 (HPRT1) was used as a loading control in quantitative PCR (n=3). F) Graphs showing for mRNA levels measured by qPCR (n=3) of HIF1α-target genes PFKFB3 and VEGFA in WT and ATE1-KO MEF: challenged with different O2 concentrations for 6 hours. ACTB was used as a loading control. The levels of these genes in normoxia (18% in cultured cells) were used as normalization points for individual series of data. G) Box whisker plots showing the Spearman’s correlations of mRNA expressions of ATE1 (or VHL) with 50 validated HIF1α-activating target genes (see Suppl Table S1 for the list) in tumor tissues in The Cancer Genome Atlas (TCGA). A random set of 500 genes (Random-500)(Li et al., 2012, Soler-Oliva et al., 2017, Zhao and Liu, 2019) was used as control for HIF1α-targets. The examined tissues include testicular germ cell tumors (TGCT), low grade glioma (LGG), sarcoma (SARC), Pheochromocytoma and Paraganglioma (PCPG), and skin cutaneous melanoma (SKCM); their sample sizes are indicated in parentheses. The co-expression correlation between ATE1 (or VHL) and HIF1A in each sample set are also illustrated as a red dotted line on the plot. The significance (p-value) was calculated by Mann−Whitney U test. The symbols *, **, and *** indicate p-values of <0.05, <0.005, and <0.0005, respectively.
Figure 4.
Figure 4.. ATE1 promotes HIF1α degradation by direct N-terminal arginylation
A) The levels of HIF1α mRNA in WT and ATE1-KO MEF, with GAPDH as loading controls (n=4). B) The degradation dynamics of endogenous HIF1α in WT and ATE1-KO MEF measured in the presence of translation inhibitor cycloheximide. Tubulin was used as loading control. The graph on the right shows the quantification (n=4). See Suppl Fig S2B for the effects of DMSO as a reagent control, and Suppl Fig. S2C for the differential effects of a brief treatment of MG132 on HIF1α accumulation. C) Mass Spec analysis of recombinant mouse HIF1α expressed in (and purified from) WT MEF harvested from SDS-PAGE (See Suppl Fig. S2D for an example of the protein bands). The shown spectrum, obtained from the proteomic core of the University of South Florida (USF), is consistent with the sequence of REGAGGENEK anticipated from an N-terminally arginylated mouse HIF1α. The detected b (blue color) and y (red color) ions were indicated on the spectrum. The posterior error probability (PEP) values and the Andromeda score, which reflect the quality of the peptide assignment in the spectrum(Cox et al., 2011, Cox and Mann, 2008), were also shown. See also Suppl Fig. S2E and S2F for additional examples of spectra from different facilities showing arginylated HIF1α from WT MEF. None of these peptide signals were detected when the protein was expressed and purified from the arginylation-deficient ATE1-KO MEF (Suppl Fig. S3). D) Production and validation of an arginylation-specific antibody for HIF1α. The peptides representing the N-terminal sequence of arginylated HIF1α were used as antigen, while the pre-arginylated peptide was used for cross-absorption. The immunoblot on the bottom shows the reactivity of the resulting antibody on the constitutively arginylated (-R), non-arginylated (M-), and pre-arginylated (E-) forms of recombinant HIF1α expressed in ATE1-KO MEF cells. C-terminal HA fusion tag was used as a loading control (see Fig. 4G and 5A for further details of these constructs). E) The levels of arginylated, endogenous HIF1α in WT and ATE1-KO cells treated with MG132 for 9 hrs. The graph on the right side shows the quantification (n=3). F) N-terminal amino acid (Aa) sequences of HIF1α in different species. The position for the 2nd residue is highlighted in a grey box to show the identity. G) Construction of recombinant mouse HIF1α with N-terminal residue M, R, E or G. Protein translation is initiated from the start codon of the Ub-coding region. After expression, the Ub will be cleaved by endogenous de-Ub machineries, leaving the penultimate amino acid as the new N-terminal end. The protein starting with an N-terminal methionine (M) is to represent the constitutively, non-arginylated form or an arginine (R), for the arginylated form. Also, the HIF1α starting with glutamic acid (E) mimics the naïve form immediately after the first M is removed, which is potentially eligible for arginylation. The one starting with glycine (G) is expected to reduce the frequency of arginylation(Varshavsky, 2011, Wong et al., 2007, Wang et al., 2018). The C-terminal tag (in this case, GFP) is used to facilitate detections. H) Degradation dynamics of the M-, R-, E-, and G- forms of HIF1α-GFP in the cells (**unsure of which cells) in the presence of translation inhibitor cycloheximide, as shown in representative Western blot images, and quantified in the chart on the right (n=3 for M, R, E; n=6 for G).
Figure 5.
Figure 5.. Arginylation-mediated degradation of HIF1α is independent of the pVHL pathway.
A) A diagram showing recombinant HIF1α with different eligibilities for arginylation or proline-hydroxylation. Asterisks indicate the positions of the two critical proline (P) residues, 402 and 577, on mouse HIF1α (corresponding to 402 and 564 in human HIF1α). Mutations of P402 to Alanine (A) and P577 to Glycine (G) (referred to as the PAPG mutation) are expected to block both the PHD-mediated hydroxylation and the downstream recognition by pVHL necessary for ubiquitination(Jaakkola et al., 2001b). The C-terminal 2xHA tag is to facilitate the detection. An internal ribosome-entry site (IRES) and the coding sequence of GFP were placed behind HIF1α for the normalization of transfection and translation efficiencies. B) Steady-state levels of HIF1α (with M, G, or R on the N-terminus), transiently expressed in HEK293T cells, detected by antibody against HA tag. The level of GFP is used as a loading control to normalize differences in the expression efficiencies of the vector. On the bottom is the quantification (n=8). C) Similar to (B), except with the PAPG mutation on HIF1α (n=8). D) Steady-state levels of the M-, G-, R-, or E- HIF1α transiently expressed in the pVHL-deficient human renal carcinoma cell line UOK111 and quantified similar as in (B) (n=3). See also Suppl Fig. S4A for the effects of the treatment of MG132, a proteasome inhibitor, on these proteins in UOK111 cells. E) Steady-state levels of HIF1α and ATE1 in UOK111 cells (untreated, treated with NS- or ATE1- specific shRNA) with β-actin as loading controls. The graph on the bottom shows the quantification of HIF1α levels (n=3). F) Similar to (B), except that all different forms of HIF1α were loaded in the same gel and grouped by their states/eligibilities of arginylation. The graph on bottom shows the quantification (n=3). G) The pVHL levels in WT and ATE1-KO MEF with β-actin as loading controls. The graph on the bottom shows the quantification (n=3). H) Similar to Fig.3G, except showing UBR1 with HIF1α-activating target genes. See also Suppl Fig. S4B for the data of other UBR family members (UBR2–5). J) The Ubr1 levels in MEF cells treated with NS- or UBR1-specific shRNA, with β-actin as loading controls. The quantification is shown on the right side (n=4). K) The mRNA levels of HIF1A in MEF cells stably expressing NS- or UBR1- specific shRNA measured by quantitative PCR. The β-actin gene (ACTB) was used as a loading control (n=5). L) The steady-state HIF1α levels in MEF cells with NS or UBR1- specific shRNA, with β-actin as loading control. The graph on the right side shows quantification (n=4). As another control, see Suppl Fig. S4C for the effects of UBR1-knockdown in ATE1-KO MEF. See also Suppl Fig. S4D-4F for UBR1-knockdown in HFF and the consequential effects on the mRNA/protein levels of HIF1α.
Figure 6.
Figure 6.. Arginylation of HIF1α is sensitive to the oxygen-dependent hydroxylation on this protein.
A) Immunoblots of PHD2 protein and quantification (n=3) in WT and ATE1-KO MEF with β-actin as loading controls. B) The level of HIF1α (and β-actin) in WT and ATE1-KO MEF treated with either 5μM L-Ascorbic acid 2-phosphate (a co-factor and co-activator for PHD) or DMSO (as reagent control) for 24 hours. Under each set of immunoblots is the graph showing the fold changes of HIF1a in ascorbate-treated group (5μM), relative to the control group (0μM) (n=3). C) Immunoblots on the left shows the P564-hydroxylated (Hx-) HIF1α, probed with rabbit anti hydroxyl-HIF1α (Cell Signaling, Danvers, MA, Cat# 3434), in WT and ATE1-KO MEF treated with MG132 for 6 hrs. The positions of full-length (FL) HIF1α and the ubiquitinylated-smear are indicated. The loading amounts were pre-adjusted to reach equivalent levels of FL HIF1α in each lane; these were determined by loading on a different gel to avoid signal bleed-through, because both the anti-HIF1α and the anti hydroxyl-HIF1α were rabbit antibodies. The graph on the right shows the level of P564-hydroxylated HIF1α in proportion to FL-HIF1α (n=4). See Suppl Fig. 5A for the validation of the specificity of the antibody for hydroxyl-HIF1α. See also Suppl Fig. S5B for the detection of hydroxyl-HIF1α with a different antibody. D) Steady-state levels of M-, G-, E-, or R- HIF1α with or without PAPG mutations transiently expressed in HEK293T cells. Graph shows quantification with GFP as controls for loading and transfection efficiency (n=8). E) Endogenous arginylated (R-) HIF1α in WT MEF, under different O2 levels, probed by the custom-made arginylation-specific antibody as described in Fig.3D. The cells were pre-cultured in normoxia (18% O2) or hypoxia (0.5% O2) for at least 2 hrs followed by MG132 addition and allowed to culture for 9 hrs. Arrows point to the expected size of the full-length (FL) HIF1α. The level of total HIF1α, probed by anti-HIF1α, was used to calculate the ratio of arginylation signal. The graph on the right side shows quantifications (n=3). F) Cycloheximide time-chase for E-HIF1α–HA in the lysate of ATE1-KO MEF, with the addition of recombinant mouse ATE1 isoform 1 (or buffer) and 1mM DMOG (an inhibitor of PHD) or DMSO, as a vehicle control. Tubulin serves as a loading control. Graphs on bottom show quantification (n>=3). See also Supp Fig. S5C for the validation of the effectiveness of DMOG on endogenous HIF1α. See also Suppl Fig. S5D for the lack of effect of DMOG on the recombinant HIF1α bearing the PAPG mutation that blocks proline hydroxylation. See also Suppl Fig. S6 for the mutation burdens in ATE1, UBRs and VHL genes in tumor samples.
Figure 7.
Figure 7.. Phylogenetic analysis of the amino acid sequences of ATE1, PHD, HIF1α, pVHL, and Ubr among different species.
A) Sunburst graph showing the distribution of essential domains of ATE1, PHD, HIF1α, Ubr, and pVHL among eukaryotes and/or bacteria (indicated by color keys). For ATE1, the ATE-N domain (Pfam ID: 04376), which was known to be essential for its arginylation function(Kumar et al., 2016), was used as the representative. For PHD, the 2OG-Fe(II) oxygenase superfamily domain (Pfam ID: 13640), essential for catalyzing oxidation, was used. For HIF1α, Pfam ID 11413 was used. For VHL, the VHL box domain (VHL-C, Pfam ID: 17211) – required for the binding of cullin 2 protein, and thus for the ubiquitination of HIF1α – was used. For UBR, the zf-UBR domain (Pfam ID: PF02207), which is conserved among Ubr family, was used. B) The presence of key Pfam domains of ATE1, PHD, HIF1α, pVHL, and Ubr (as indicated in the box) among different species are shown in a simplified evolution tree. Pink circles highlight several important spots. Among these, the Rickettsiales order of the alphaproteobacterial class – considered to be an extant relative to the ancestor of mitochondria – contains orthologs of ATE1 and PHD (e.g., GenBank: MBO88368.1 and GenBank: MBB20576.1, respectively, in https://www.ncbi.nlm.nih.gov/protein). Protista – considered a close relative to the ancestor of eukaryotes – contains ATE1, PHD and UBR. Further evidence can also be seen in Naegleria gruberi (Amoeba/Protista), where ATE1 (UniprotKB D2V1S2), PHD (UniprotKB D2V646), and Ubr (UniProtKB - D2V5N7) are found. Porifera is considered a close to the ancestor of metazoans, but it appears to lack pVHL. As an example, in Amphimedon queenslandica (sponge/Porifera), ATE1 (UniprotKB- A0A1X7UG82), PHD (UniprotKB- A0A1X7V6W1), HIF1α-like [NCBI accession no. XP_011403284.1], and Ubr (UniProtKB - A0A1X7UYL9) are found, but not for pVHL. A lateral loss of pVHL was also observed in Copepods (a branch of Arthropoda). As an example, in Eurytemora affinis (Copepods), we found ATE1 (NCBI accession no. XP_023347556.1), PHD (NCBI accession no. XP_023332905.1), HIF1A-like (NCBI accession no. XP_023346906.1), and Ubr (NCBI accession no: XP_023321273.1) but not pVHL. See Suppl Fig. S7A and S7B for sequences of the HIF1α-like proteins in Porifera and Copepods with putative arginylation-eligible residues. See also the figure legend of Suppl Fig. S7A and S7B for further details of the lack of VHL proteins in Protista, Porifera and Copepods. C) The data in this study suggest that ATE1 acts downstream of PHD and parallel to pVHL for the degradation of HIF1α during oxygen sensing in mammalian cells.

Similar articles

Cited by

References

    1. AL TAMEEMI W, DALE TP, AL-JUMAILY RMK & FORSYTH NR 2019. Hypoxia-Modified Cancer Cell Metabolism. Front Cell Dev Biol, 7, 4. - PMC - PubMed
    1. ANGLARD P, TRAHAN E, LIU S, LATIF F, MERINO MJ, LERMAN MI, ZBAR B & LINEHAN WM 1992. Molecular and Cellular Characterization of Human Renal-Cell Carcinoma Cell-Lines. Cancer Res, 52, 348–356. - PubMed
    1. BACHMAIR A, FINLEY D & VARSHAVSKY A 1986. In vivo half-life of a protein is a function of its amino-terminal residue. Science, 234, 179–86. - PubMed
    1. BALZI E, CHODER M, CHEN WN, VARSHAVSKY A & GOFFEAU A 1990. Cloning and functional analysis of the arginyl-tRNA-protein transferase gene ATE1 of Saccharomyces cerevisiae. J Biol Chem, 265, 7464–71. - PubMed
    1. BENITA Y, KIKUCHI H, SMITH AD, ZHANG MQ, CHUNG DC & XAVIER RJ 2009. An integrative genomics approach identifies Hypoxia Inducible Factor-1 (HIF-1)-target genes that form the core response to hypoxia. Nucleic Acids Res, 37, 4587–4602. - PMC - PubMed

Publication types