

Measuring the effects of COVID-19-related disruption on dengue transmission in southeast Asia and Latin America: a statistical modelling study
- PMID: 35247320
- PMCID: PMC8890758
- DOI: 10.1016/S1473-3099(22)00025-1
Measuring the effects of COVID-19-related disruption on dengue transmission in southeast Asia and Latin America: a statistical modelling study
Abstract
Background: The COVID-19 pandemic has resulted in unprecedented disruption to society, which indirectly affects infectious disease dynamics. We aimed to assess the effects of COVID-19-related disruption on dengue, a major expanding acute public health threat, in southeast Asia and Latin America.
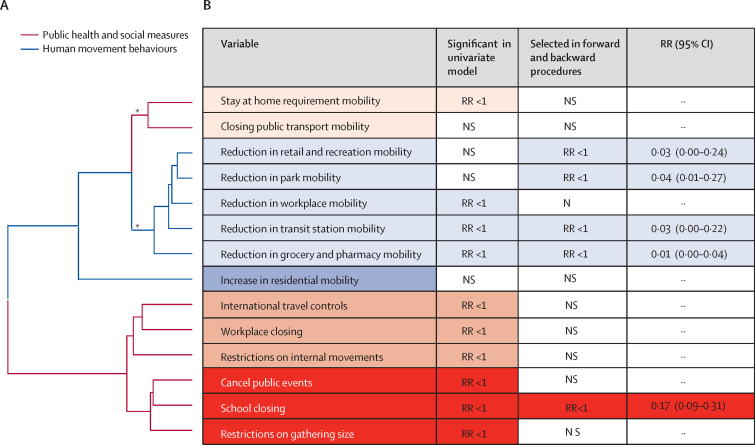
Methods: We assembled data on monthly dengue incidence from WHO weekly reports, climatic data from ERA5, and population variables from WorldPop for 23 countries between January, 2014 and December, 2019 and fit a Bayesian regression model to explain and predict seasonal and multi-year dengue cycles. We compared model predictions with reported dengue data January to December, 2020, and assessed if deviations from projected incidence since March, 2020 are associated with specific public health and social measures (from the Oxford Coronavirus Government Response Tracer database) or human movement behaviours (as measured by Google mobility reports).
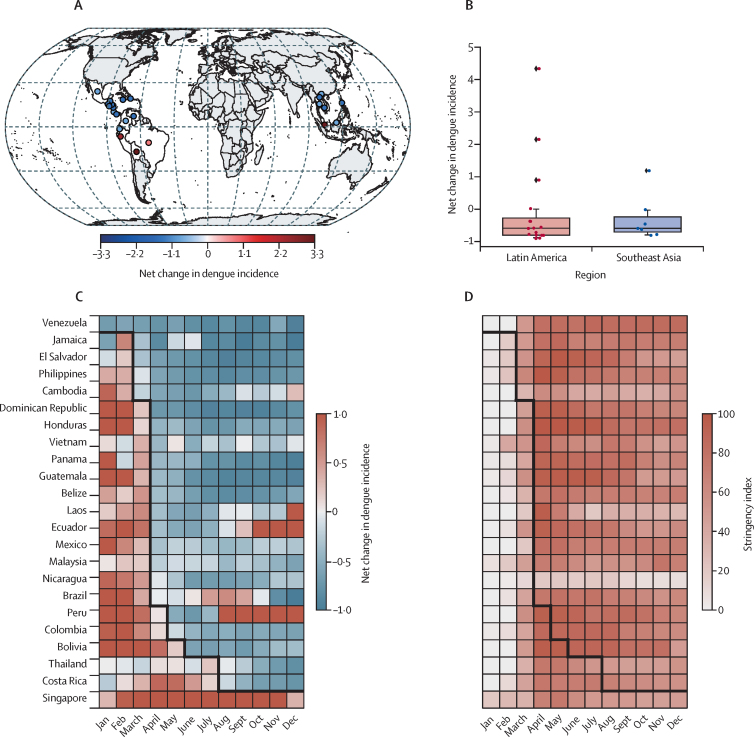
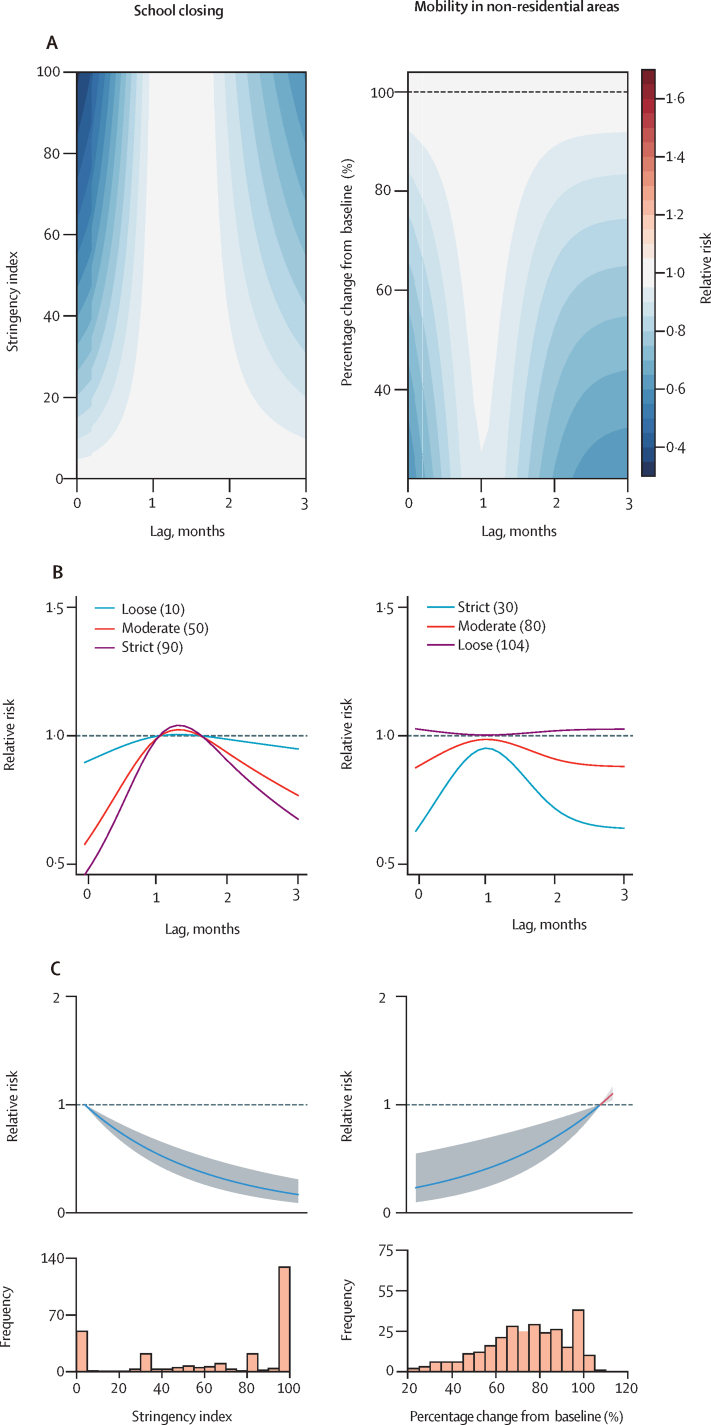
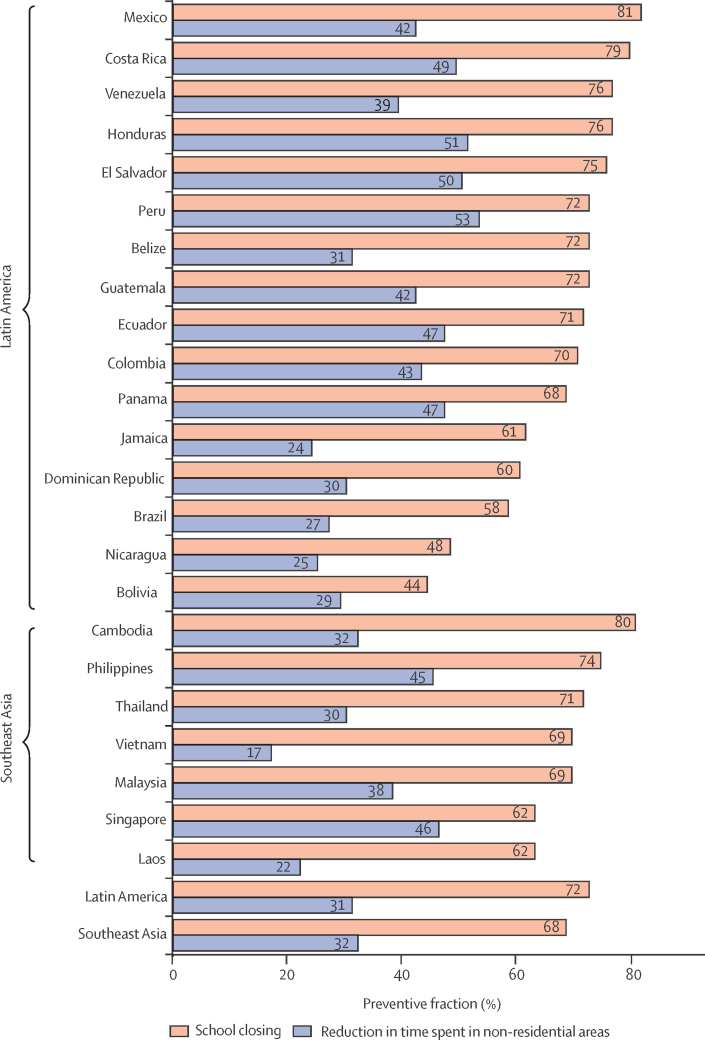
Findings: We found a consistent, prolonged decline in dengue incidence across many dengue-endemic regions that began in March, 2020 (2·28 million cases in 2020 vs 4·08 million cases in 2019; a 44·1% decrease). We found a strong association between COVID-19-related disruption (as measured independently by public health and social measures and human movement behaviours) and reduced dengue risk, even after taking into account other drivers of dengue cycles including climatic and host immunity (relative risk 0·01-0·17, p<0·01). Measures related to the closure of schools and reduced time spent in non-residential areas had the strongest evidence of association with reduced dengue risk, but high collinearity between covariates made specific attribution challenging. Overall, we estimate that 0·72 million (95% CI 0·12-1·47) fewer dengue cases occurred in 2020 potentially attributable to COVID-19-related disruption.
Interpretation: In most countries, COVID-19-related disruption led to historically low dengue incidence in 2020. Continuous monitoring of dengue incidence as COVID-19-related restrictions are relaxed will be important and could give new insights into transmission processes and intervention options.
Funding: National Key Research and Development Program of China and the Medical Research Council.
Copyright © 2022 The Author(s). Published by Elsevier Ltd. This is an Open Access article under the CC BY 4.0 license. Published by Elsevier Ltd.. All rights reserved.
Conflict of interest statement
Declaration of interests AWS works as a consultant to WHO. All other authors declare no competing interests.
Figures
Comment in
-
Movement dynamics: reduced dengue cases during the COVID-19 pandemic.Lancet Infect Dis. 2022 May;22(5):570-571. doi: 10.1016/S1473-3099(22)00062-7. Epub 2022 Mar 2. Lancet Infect Dis. 2022. PMID: 35247322 Free PMC article. No abstract available.
-
Additional considerations for assessing COVID-19 impact on dengue transmission.Lancet Infect Dis. 2022 Jun;22(6):762-763. doi: 10.1016/S1473-3099(22)00293-6. Lancet Infect Dis. 2022. PMID: 35643097 Free PMC article. No abstract available.
-
Additional considerations for assessing COVID-19 impact on dengue transmission - Authors' reply.Lancet Infect Dis. 2022 Jun;22(6):763. doi: 10.1016/S1473-3099(22)00289-4. Lancet Infect Dis. 2022. PMID: 35643098 Free PMC article. No abstract available.
References
-
- WHO Dengue and severe dengue: WHO newsroom. Jan 10, 2022. https://www.who.int/news-room/fact-sheets/detail/dengue-and-severe-dengue
-
- Regional WHO . WHO Regional Office for the Western Pacific; Manila: 2020. Office for the Western Pacific. Dengue situation updates 2020.
-
- WHO Dengue weekly report. https://www3.paho.org/data/index.php/en/mnu-topics/indicadores-dengue-en
Publication types
MeSH terms
Grants and funding
LinkOut - more resources
Full Text Sources
Other Literature Sources
Medical
