. 2022 May 15:645:114633.
doi: 10.1016/j.ab.2022.114633. Epub 2022 Mar 2.

DNA aptamer selection for SARS-CoV-2 spike glycoprotein detection

Affiliations

DNA aptamer selection for SARS-CoV-2 spike glycoprotein detection

Mateo Alejandro Martínez-Roque et al. Anal Biochem. .

Abstract

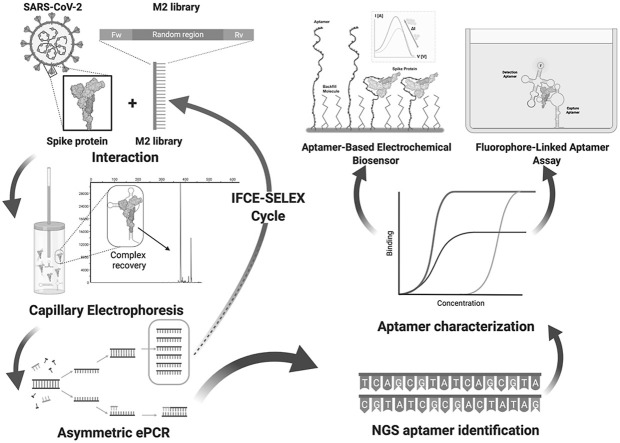
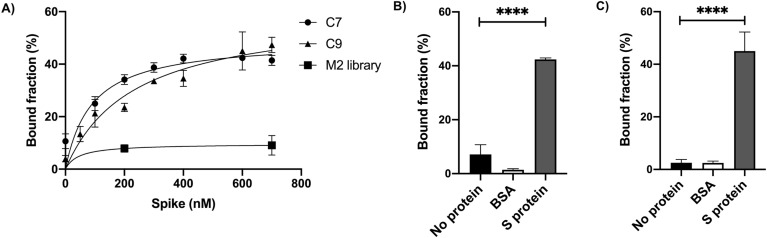
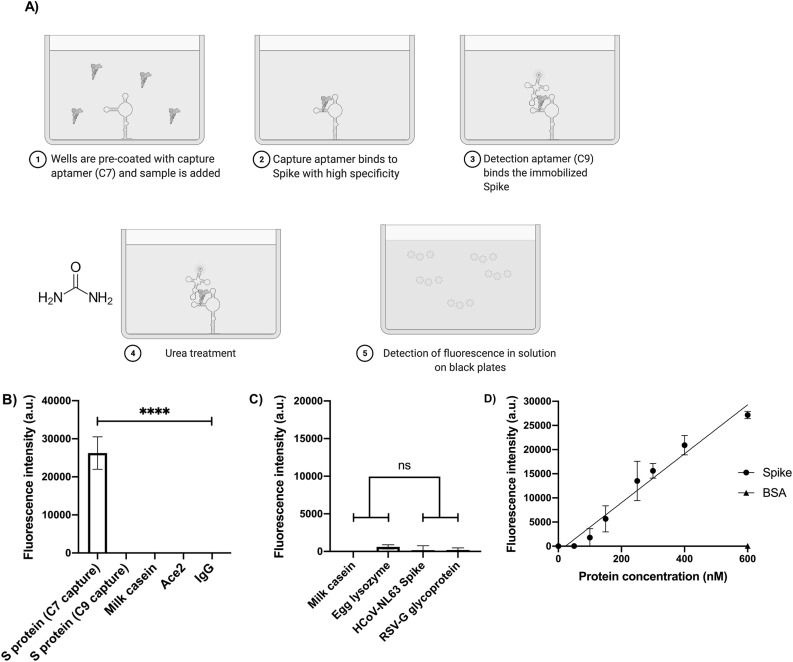
The rapid spread of SARS-CoV-2 infection throughout the world led to a global public health and economic crisis triggering an urgent need for the development of low-cost vaccines, therapies and high-throughput detection assays. In this work, we used a combination of Ideal-Filter Capillary Electrophoresis SELEX (IFCE-SELEX), Next Generation Sequencing (NGS) and binding assays to isolate and validate single-stranded DNA aptamers that can specifically recognize the SARS-CoV-2 Spike glycoprotein. Two selected non-competing DNA aptamers, C7 and C9 were successfully used as sensitive and specific biological recognition elements for the development of electrochemical and fluorescent aptasensors for the SARS-CoV-2 Spike glycoprotein with detection limits of 0.07 fM and 41.87 nM, respectively.

Keywords: Aptamers; Aptasensor; COVID-19; Capillary electrophoresis; SARS-CoV-2; SELEX.


Figures

Image 1
Graphical abstract
Fig. 1
Fig. 1
Schematics representation of DNA aptamers selection against SARS-CoV-2 Spike (S) protein through IFCE-SELEX. Purified recombinant SARS-CoV-2 S protein was incubated with the M2 ssDNA combinatorial pool containing 40 randomized positions (M2 library). The ssDNA-S protein complexes were partitioned using Ideal-Filter Capillary Electrophoresis (IFCE). The dsDNA generated from the recovered aptamer pools was used as template for asymmetric ePCR in ssDNA production. Each partitioned aptamer pool was allowed to enter in increasingly stringent selection cycles by decreasing the protein concentration by half until 25 nM. Figure created with BioRender.com.
Fig. 2
Fig. 2
IFCE SELEX analysis. A) Binding affinity and specificity of the different aptamer pools partitioned by IFCE-SELEX. Slot blot binding assays were made by incubating purified recombinant SARS-CoV-2 S protein (200 nM) with 10 pM of either the radiolabeled M2 randomized pool or the partitioned pools 2R and 3R. Bovine serum albumin (BSA) (200 nM) was used as negative binding control. The residual radioactivity on the nitrocellulose (NC) and nylon (NY) membranes was used to determine the aptamer fraction bound to the proteins. Error bars represent one standard deviation from triplicate analyses. The results were analyzed using one-way ANOVA with post hoc Tukey's multiple comparisons test (99.9% CI). Asterisks indicate statistical significance (n = 3, p < 0.0001). B) NGS variability analysis. The percentage of unique sequences in each dataset was calculated after sequencing each IFCE-SELEX cycle. The number of unique sequences decreased through the IFCE partition. C) NGS enrichment analysis. R1 data set was matched against 2R. Each black dot represents one sequence obtained from the NGS data. Sequence frequency was plotted as a function of its enrichment-fold from R1 to R2. It was observed that some of the most enriched sequences were also frequent. FASTAptamer toolkit was used for the variability and enrichment analysis. D) Unrooted radial phylogenetic tree of the most enriched sequences in R2 containing the ten selected aptamer sequences. E) Unrooted radial phylogenetic tree of the most enriched sequences against NC membrane. The trees were constructed using the 100 most enriched sequences and analyzed by Molecular Phylogenetic Analysis by Maximum Likelihood method based on the Kimura 2-parameter model conducted in MEGA7. Scale bar indicates 0.5 substitution per site.
Fig. 3
Fig. 3
Binding Affinity and Specificity of aptamer sequences. A) KD determination. The dissociation constants for aptamers C7 (KD = 89.41 ± 18 nM) (black dots) and C9 (KD = 231.9 ± 15 nM) (black triangles) were calculated fitting the bound fraction curves from slot blot assays to a one binding site non-linear regression model (C7 R2 = 0.83; C9 R2 = 0.92). B) Binding specificity of C7 (left panel) and C9 (right panel) aptamers. Radiolabeled aptamer DNA (15 pM) was incubated with 600 nM of purified S protein. BSA (600 nM) and no protein negative controls were included. The data was analyzed using one-way ANOVA with post hoc Tukey's multiple comparisons test (99% CI). Asterisks indicate statistical significance (n = 3, p < 0.0001). For both aptamers no statistically significant differences were found between BSA and without protein (C7: p > 0.039; C9: p > 0.99).
Fig. 4
Fig. 4
FLAA specificity and detection parameters. A) Schematics of the FLAA procedure. Step 1: 5′-amino-C6-modified C7 aptamer was immobilized on the surface of maleic anhydride-activated multiwell plates as capture agent. Step 2: The purified recombinant SARS-CoV-2 S or negative binding control protein were added to the C7-containing plates. Step 3: Fluorescein-labeled C9 was added as detection agent. Step 4: After step 3 the multiwells are washed with TNa buffer. The multiwell plates are incubated with 7 M urea and volume is transferred to black plates. B) FLAA test based on the C7 and C9 aptamers. Purified recombinant S protein (250 nM) was added and incubated before addition of FAM-C9. Milk casein, human ACE2 and mouse IgG, were used as non-related controls to evaluate the FLAA specificity in 10-fold diluted human saliva. The graphs represent the mean and standard deviation from three independent experiments analyzed by one-way ANOVA with post hoc Tukey's multiple comparisons test (95% CI). Asterisks indicate statistical significance (n = 3, p < 0.0001). C) The FLAA test does not detect unrelated proteins and other common cold recombinant surface virus proteins. Milk casein, egg lysozyme, Human Respiratory Syncytial virus (RSV) glycoprotein G and Human Coronavirus (HCoV-NL63) S protein (250 nM) were added and incubated before addition of FAM-C9. The graphs represent the mean and standard deviation from three independent experiments analyzed by one-way ANOVA with post hoc Tukey's multiple comparisons test (95% CI). Asterisks indicate statistical significance (n = 3, p < 0.0001). D) FLAA signal is concentration-dependent of S protein. A FLAA test based was developed in 96-microwell plate format using aptamer C7 as capturing agent and FAM-labeled C9 as detection agent. . The FLAA concentration curve (0 nM–600 nM) of S protein (Black circles) showed a simple linear regression (R2 = 0.94). Background fluorescence from the well without S protein was subtracted from the measurements. BSA (600 nM) was used as negative control (Black triangle). Plotted data represents the mean and standard deviation of three independent experiments (n = 3).
Fig. 5
Fig. 5
Electrochemical detection. A) Schematic representation of the surface of a gold electrode functionalized with C7 aptamer by a sulfur-gold binding through thiol groups at the 5′-end (5′-thio-C7). The formation of the aptamer-S protein complex changes the aptamer conformation resulting in modification of the electrochemical signal, shortening the charge transfer distance of the redox molecules and thereby increasing the current as the concentration of the protein increases (inlet). B) Current signal I(Ipeak-I0)/I0I (%) of the differential potential voltammetry response versus increasing analyte concentration (1 fg/mL – 100 ng/mL). Inlet: same relation but in a semi-log representation. A linear fit was calculated over the linear dynamic detection range (Data points) by excluding the data points in saturation region (Excluded). The selectivity is demonstrated by the sensor signals obtained for Glycoprotein G of the RSV, the Hemagglutinin protein of the influenza (H1N1) virus, and the S protein of the MERS-CoV virus.
Supplementary Fig. S1A
Supplementary Fig. S1B
Supplementary Fig. S1C
Supplementary Fig. S2A
Supplementary Fig. S2B
Supplementary Fig. S3
Supplementary Fig. S4
Supplementary Fig. S5A
Supplementary Fig. S5B
Supplementary Fig. S6
Supplementary Fig. S7A
Supplementary Fig. S7B

Similar articles

Cited by

References

    1. Hui D.S., I Azhar E., Madani T.A., Ntoumi F., Kock R., Dar O., Ippolito G., Mchugh T.D., Memish Z.A., Drosten C., Zumla A., Petersen E. The continuing 2019-nCoV epidemic threat of novel coronaviruses to global health - the latest 2019 novel coronavirus outbreak in Wuhan, China. Int. J. Infect. Dis. 2020;91:264–266. doi: 10.1016/j.ijid.2020.01.009. - DOI - PMC - PubMed
    1. Dong E., Du H., Gardner L. An interactive web-based dashboard to track COVID-19 in real time. Lancet Infect. Dis. 2020;20:533–534. doi: 10.1016/S1473-3099(20)30120-1. - DOI - PMC - PubMed
    1. WHO . 1–23. World Heal. Organ; 2021. https://www.who.int/publications/m/item/covid-19-weekly-epidemiological-... (COVID-19 Weekly Epidemiological Update).
    1. Abduljalil J.M., Abduljalil B.M. Epidemiology, genome, and clinical features of the pandemic SARS-CoV-2: a recent view. New Microbes New Infect. 2020;35:100672. doi: 10.1016/j.nmni.2020.100672. - DOI - PMC - PubMed
    1. Chen Y., Liu Q., Guo D. Emerging coronaviruses: genome structure, replication, and pathogenesis. J. Med. Virol. 2020;92:418–423. doi: 10.1002/jmv.25681. - DOI - PMC - PubMed

Publication types

MeSH terms

Substances