. 2022 Jul:353:114030.
doi: 10.1016/j.expneurol.2022.114030. Epub 2022 Mar 2.

Cervical spinal hemisection alters phrenic motor neuron glutamatergic mRNA receptor expression

Affiliations

Cervical spinal hemisection alters phrenic motor neuron glutamatergic mRNA receptor expression

Sabhya Rana et al. Exp Neurol. 2022 Jul.

Abstract

Upper cervical spinal cord injuries (SCI) disrupt descending inputs to phrenic motor neurons (PhMNs), impairing respiratory function. Unilateral spinal hemisection at C2 (C2SH) results in loss of ipsilateral rhythmic diaphragm muscle (DIAm) EMG activity associated with lower force behaviors accomplished by recruitment of smaller PhMNs in rats. Activity during higher force, non-ventilatory behaviors that recruit larger PhMNs is minimally impaired following C2SH. We previously showed neuroplasticity in glutamatergic receptor expression in PhMN post-C2SH with changes in NMDA receptor expression reflecting functional recovery over time. We hypothesize that C2SH-induced changes in glutamatergic receptor (AMPA and NMDA) mRNA expression in PhMNs vary with motor neuron size, with more pronounced changes in smaller PhMNs. Retrogradely-labelled PhMNs were classified in tertiles according to somal surface area and mRNA expression was measured using single-cell, multiplex fluorescence in situ hybridization. Ipsilateral to C2SH, a pronounced reduction in NMDA mRNA expression in PhMNs was evident at 3 days post-injury with similar impact on PhMNs in the lower size tertile (~68% reduction) and upper tertile (~60%); by 21 days, there was near complete restoration of NMDA receptor mRNA expression across all PhMNs. There were no changes in NMDA mRNA expression contralateral to C2SH. There were no changes in AMPA mRNA expression at PhMNs on either side of the spinal cord or at any time-point post-C2SH. In summary, following C2SH there is ipsilateral reduction in PhMN NMDA mRNA expression at 3 days that is not limited to smaller PhMN recruited in the generation of lower force ventilatory behaviors. The recovery of NMDA mRNA expression by 21 days post-C2SH is consistent with evidence of spontaneous recovery of ipsilateral DIAm activity at this timepoint. These findings suggest a possible role for NMDA receptor mediated glutamatergic signaling in mechanisms supporting postsynaptic neuroplasticity at the PhMN pool and recovery of DIAm activity after cervical SCI.

Keywords: Glutamate; Motor unit recruitment; Neuromotor control; Neurotransmitter; Phrenic motor neurons; Respiration.


Conflict of interest statement

Conflict of interest: The authors declare no competing financial interests.

Figures

Figure 1.
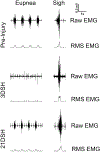
Figure 1.. Representative EMG recordings following C2 Hemisection
Representative ipsilateral DIAm EMG recordings and corresponding root-mean-square (RMS) calculations during eupnea and spontaneous deep breaths (sigh) at pre-injury, 3days post hemisection (3DSH) and 21 days post hemisection (21DSH) using chronic in-dwelling electrodes. Ipsilateral DIAm EMG is abolished during eupneic breathing at 3DSH, and some activity re-appears by 21DSH. Contrastingly, EMG activity during sigh behavior is unimpacted at either time point post-injury.
Figure 2.
Figure 2.. Retrograde labelling of phrenic motor neurons and size distribution across tertiles
a. Representative maximum intensity projection image shows phrenic motor neurons (PhMNs) that were identified by retrograde labelling using intrapleural delivery of Alexa 488-conjugated cholera toxin B (CTB-488). CTB signal is pseudo-colored to magenta for clarity. Soma of three labelled PhMNs with a distinctly visible mid-nuclear section and nucleolus is shown with a DAPI counterstain. PhMNs are outlined with a white dotted line for clarity and a short and long axis is represented with white double-arrow line. Scale bar: 20µm. b. The somal surface areas of retrogradely labelled PhMNs were classified into tertiles for each animal (labeled by the different symbols; n=6 animals in each group). AMPA and NMDA mRNA expression was subsequently quantified in PhMNs grouped in the lower (control, n=197; 3DSH, n=198; 21DSH, n=202), middle (control, n=192; 3DSH, n=196; 21DSH, n=199) and upper (control, n=197; 3DSH, n=199; 21DSH, n=196) tertiles. Box plots of PhMN somal surface area represent variability in motor neuron size across motor neurons and animals.
Figure 3.
Figure 3.. Multiplex fluorescence in situ hybridization (RNAscope) for AMPA and NMDA mRNA expression in ipsilateral phrenic motor neurons following C2 Hemisection injury
Representative single cell multiplex fluorescent in situ hybridization for AMPA (Gria2 - Red) and NMDA (Grin1 - Green) mRNA transcripts in control (a-c), 3 days post-C2 Hemisection (3DSH; d-e) and 21 days post-C2 Hemisection (21DSH; g-h) groups. Quantitative fluorescence measurements were conducted in retrogradely labelled PhMNs on the Fiji platform to compute the number of mRNA transcripts per motor neuron. AMPA and NMDA mRNA channels are merged with DAPI stain in c, f and i. Retrogradely labelled PhMNs are outlined in white for clarity. Scale bar: 20 µm
Figure 4.
Figure 4.. Total number of NMDA mRNA transcripts per PhMN according to motor neuron somal surface area
Total number of NMDA mRNA transcripts per PhMN ipsilateral (a,b) and contralateral (c,d) to injury in control (ipsilateral, n = 309, contralateral, n = 277 PhMNs from 6 rats), 3DSH (ipsilateral, n = 309, contralateral, n = 284 PhMNs from 6 rats), and 21DSH (ipsilateral, n = 327, contralateral, n = 270 PhMNs from 6 rats) groups. Different animals are depicted with different symbols a. Total number of Ipsilateral NMDA (Grin1) mRNA transcripts showed a strong positive correlation with motor neuron somal surface area in the control group (r2 = 0.55), moderate correlation in the 3DSH group (r2 = 0.33) and very strong correlation in the 21DSH group (r2 = 0.70). b. Mean (± 95% CI) total number of ipsilateral NMDA mRNA transcripts per PhMN grouped by somal surface area tertile. Animals in 3DSH group displayed a ~64–69% reduction in mRNA transcript but no significant change in mRNA transcript number at 21DSH across lower, middle and upper tertiles as compared to respective tertiles in the control group. c. Total number of contralateral NMDA mRNA transcripts showed a very strong positive correlation with PhMN somal surface area in the control group (r2 = 0.69) and strong correlation in the 3DSH (r2 = 0.39) and 21DSH (r2 = 0.62) groups. d. Mean (± 95% CI) total number of contralateral NMDA mRNA transcripts per PhMN grouped by somal surface area tertile. mRNA transcript number at 3DSH in the upper tertile was reduced by 36% as compared to the respective tertile in control animals but no significant change in lower and middle tertile. (*, significantly different from the control group, †, significantly different from the 21DSH group,; post hoc Tukey-Kramer HSD, p<0.05).
Figure 5.
Figure 5.. Total number of AMPA mRNA transcripts per PhMN according to motor neuron somal surface area
Total number of AMPA mRNA transcripts per PhMN ipsilateral (a,b) and contralateral (c,d) to injury in control (ipsilateral, n = 309, contralateral, n = 277 PhMNs from 6 rats), 3DSH (ipsilateral, n = 309, contralateral, n = 284 PhMNs from 6 rats), and 21DSH (ipsilateral, n = 327, contralateral, n = 270 PhMNs from 6 rats) groups. Different animals are depicted with different symbols a. Total number of Ipsilateral AMPA (Gria2) mRNA transcripts showed a strong positive correlation with motor neuron somal surface area in the control group (r2 = 0.58), 3DSH (r2 = 0.51) and very strong correlation in 21DSH (r2 = 0.73) group. b. Mean (± 95% CI) total number of ipsilateral AMPA mRNA transcripts per PhMN grouped by somal surface area tertile. There was no effect of group on ipsilateral mRNA transcripts. c. Total number of contralateral AMPA mRNA transcripts showed a very strong positive correlation with motor neuron somal surface area in the control group (r2 = 0.71) and 21DSH group (r2 = 0.73) and strong correlation in the 3DSH (r2 = 0.57). d. Mean (± 95% CI) total number of contralateral AMPA mRNA transcripts per PhMN grouped by somal surface area tertile. There was no effect of group on contralateral mRNA transcripts.
Figure 6.
Figure 6.. NMDA mRNA transcript density per PhMN according to motor neuron somal surface area across groups
NMDA mRNA transcript density per PhMN (transcripts/µm3) ipsilateral (a,b) and contralateral (c,d) to injury in control (ipsilateral, n = 309, contralateral, n = 277 PhMNs from 6 rats), 3DSH (ipsilateral, n = 309, contralateral, n = 284 PhMNs from 6 rats), and 21DSH (ipsilateral, n = 327, contralateral, n = 270 PhMNs from 6 rats) groups. a. NMDA mRNA transcript density showed a strong negative correlation with motor neuron somal surface area in control group (r2 = 0.40) and very strong negative correlation in the 21DSH group (r2 = 0.69) but a weak correlation in 3DSH group (r2 = 16). b. Mean (± 95% CI) of ipsilateral NMDA mRNA transcript density per PhMN grouped by somal surface area tertile. There was a ~60–68% reduction in mRNA transcript density at 3DSH and no significant change in mRNA transcript density at 21DSH across lower, middle and upper tertiles as compared to respective tertiles in the control group. c. Contralateral NMDA mRNA transcript density showed a strong negative correlation with motor neuron somal surface area in control group (r2 = 0.51) and 21DSH (r2 = 0.50) group but moderate correlation in the 3DSH group (r2 = 0.24). d. Mean (± 95% CI) of contralateral NMDA mRNA transcript density per PhMN grouped by somal surface area tertile. There was no significant difference in NMDA mRNA density across tertiles in the 3DSH or 21DSH group compared to respective control groups. (*, significantly different from the control group, †, significantly different from the 21DSH group,; post hoc Tukey-Kramer HSD, p<0.05).
Figure 7.
Figure 7.. AMPA mRNA transcript density per PhMN according to motor neuron somal surface area across groups
AMPA mRNA transcript density per PhMN (transcripts/µm3) in control (ipsilateral, n = 309, contralateral, n = 277 PhMNs from 6 rats), 3DSH (ipsilateral, n = 309, contralateral, n = 284 PhMNs from 6 rats), and 21DSH (ipsilateral, n = 327, contralateral, n = 270 PhMNs from 6 rats) groups. a. AMPA mRNA transcript density showed a moderate negative correlation with motor neuron somal surface area in control group (r2 = 0.23) and 3DSH group (r2 = 23) but strong negative correlation in the 21DSH group (r2 = 0.53). b. Mean (± 95% CI) of ipsilateral AMPA mRNA transcript density per PhMN grouped by somal surface area tertile. c. Contralateral AMPA mRNA transcript density showed a strong negative correlation with motor neuron somal surface area in control group (r2 = 0.44) and 21DSH group (r2 = 0.55) but moderate correlation in the 3DSH group (r2 = 0.33). b. Mean (± 95% CI) of contralateral AMPA mRNA transcript density per PhMN grouped by somal surface area tertile.
Figure 8.
Figure 8.. Z-Score Difference between Ipsilateral and Contralateral for AMPA vs. NMDA mRNA Transcript Density in PhMNs
Z-scores (difference between ipsilateral and contralateral) for AMPA vs. NMDA mRNA transcript density per PhMN by tertile (n = from 6 rats in each group). Z-scores were determined for each target probe within each animal. Z scores were then averaged within the animal and each point depicts average of difference in AMPA and NMDA mRNA density z-score by animal across ipsilateral and contralateral side. 3DSH animals are concentrated in the lower quadrant, depicting a decrease in both AMPA and NMDA mRNA. Control and 21DSH animals are evenly distributed.

Similar articles

Cited by

References

    1. Alilain WJ, Goshgarian HG, 2008. Glutamate receptor plasticity and activity-regulated cytoskeletal associated protein regulation in the phrenic motor nucleus may mediate spontaneous recovery of the hemidiaphragm following chronic cervical spinal cord injury. Exp Neurol 212, 348–357. - PMC - PubMed
    1. Brown R, DiMarco AF, Hoit JD, Garshick E, 2006. Respiratory dysfunction and management in spinal cord injury. Respir Care 51, 853–868;discussion 869–870. - PMC - PubMed
    1. Chitravanshi VC, Sapru HN, 1996. NMDA as well as non-NMDA receptors mediate the neurotransmission of inspiratory drive to phrenic motoneurons in the adult rat. Brain Res 715, 104–112. - PubMed
    1. Devivo MJ, 2012. Epidemiology of traumatic spinal cord injury: trends and future implications. Spinal Cord 50, 365–372. - PubMed
    1. Dureuil B, Viires N, Cantineau JP, Aubier M, Desmonts JM, 1986. Diaphragmatic contractility after upper abdominal surgery. J Appl Physiol (1985) 61, 1775–1780. - PubMed

Publication types

MeSH terms

Substances