. 2022;13(6):1805-1827.
doi: 10.1016/j.jcmgh.2022.02.019. Epub 2022 Mar 2.

The Critical and Diverse Roles of CD4-CD8- Double Negative T Cells in Nonalcoholic Fatty Liver Disease

Affiliations

The Critical and Diverse Roles of CD4-CD8- Double Negative T Cells in Nonalcoholic Fatty Liver Disease

Changying Li et al. Cell Mol Gastroenterol Hepatol. 2022.

Abstract

Background & aims: Hepatic inflammation is a hallmark of nonalcoholic fatty liver disease (NAFLD). Double negative T (DNT) cells are a unique subset of T lymphocytes that do not express CD4, CD8, or natural killer cell markers, and studies have suggested that DNT cells play critical and diverse roles in the immune system. However, the role of intrahepatic DNT cells in NAFLD is largely unknown.

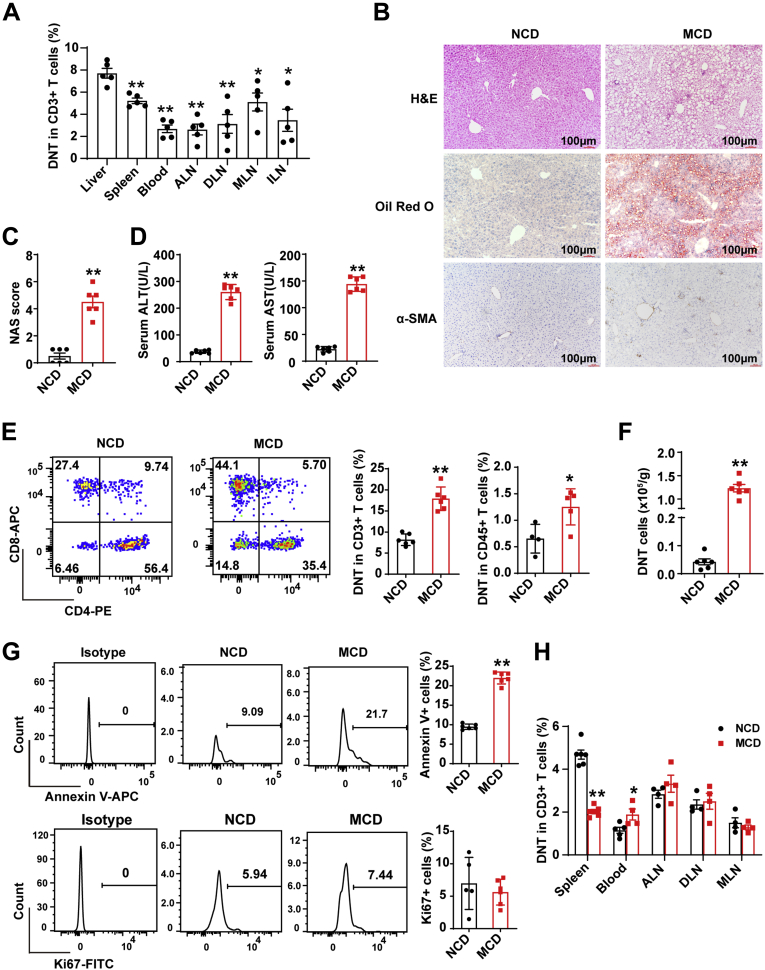
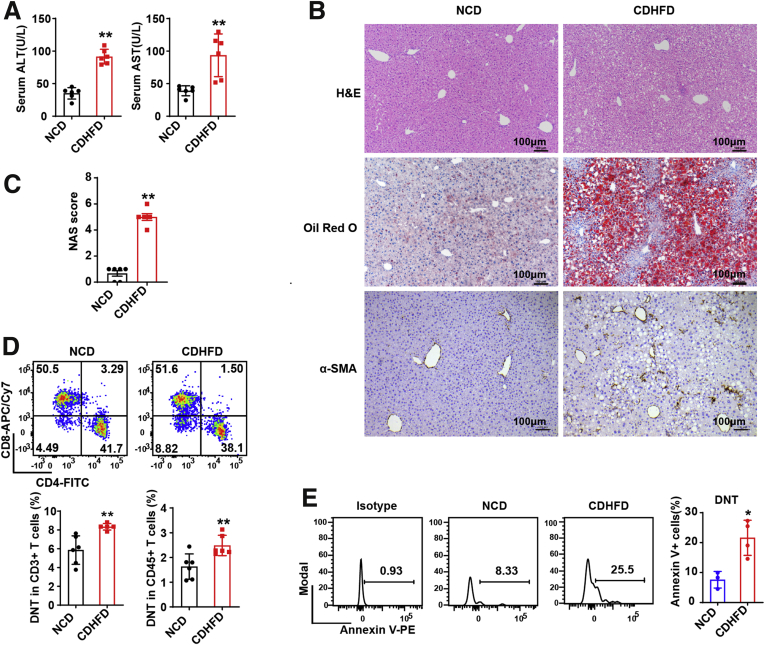
Methods: The proportions and RNA transcription profiling of intrahepatic DNT cells were compared between C57BL/6 mice fed with control diet or methionine-choline-deficient diet for 5 weeks. The functions of DNT cells were tested in vitro and in vivo.

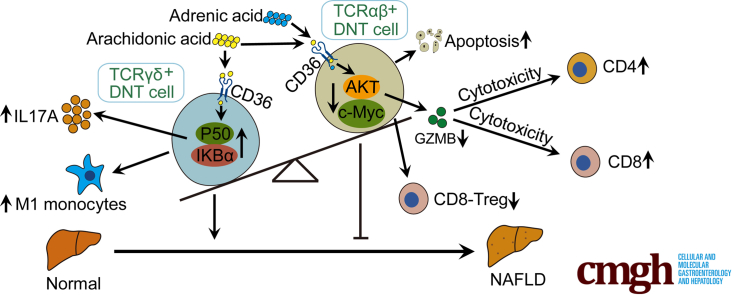
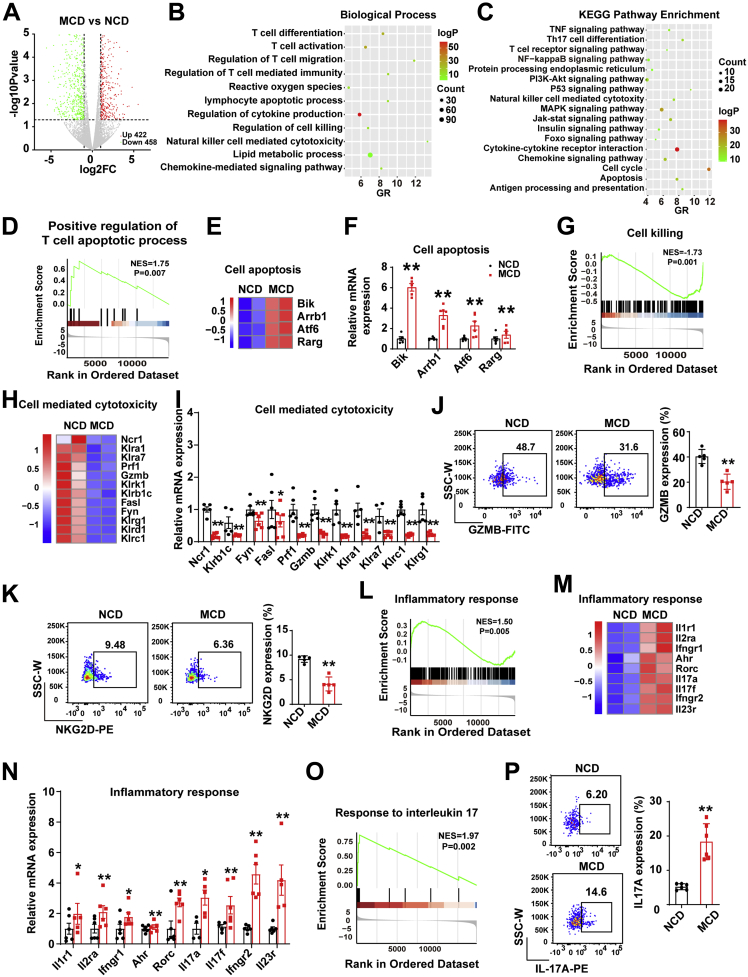
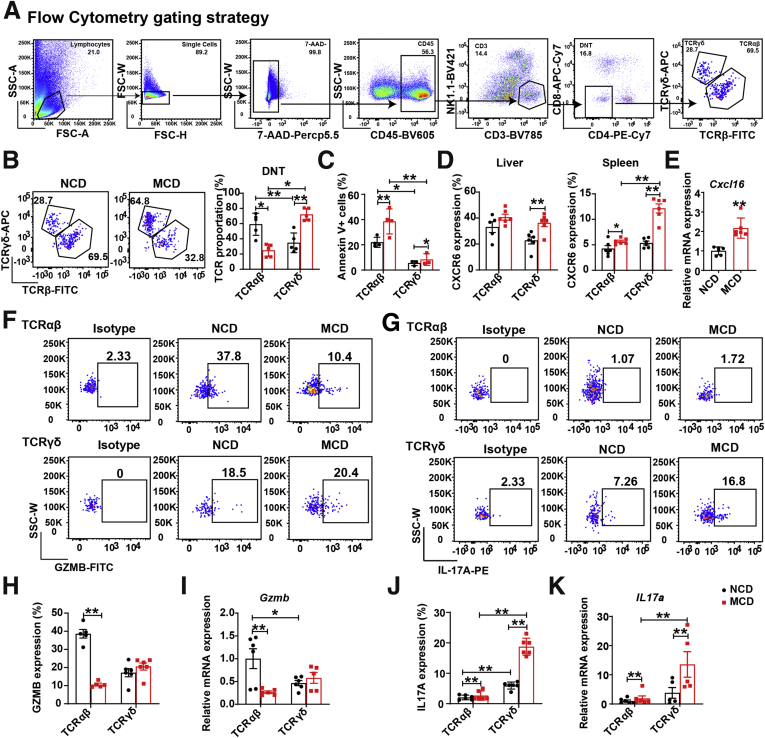
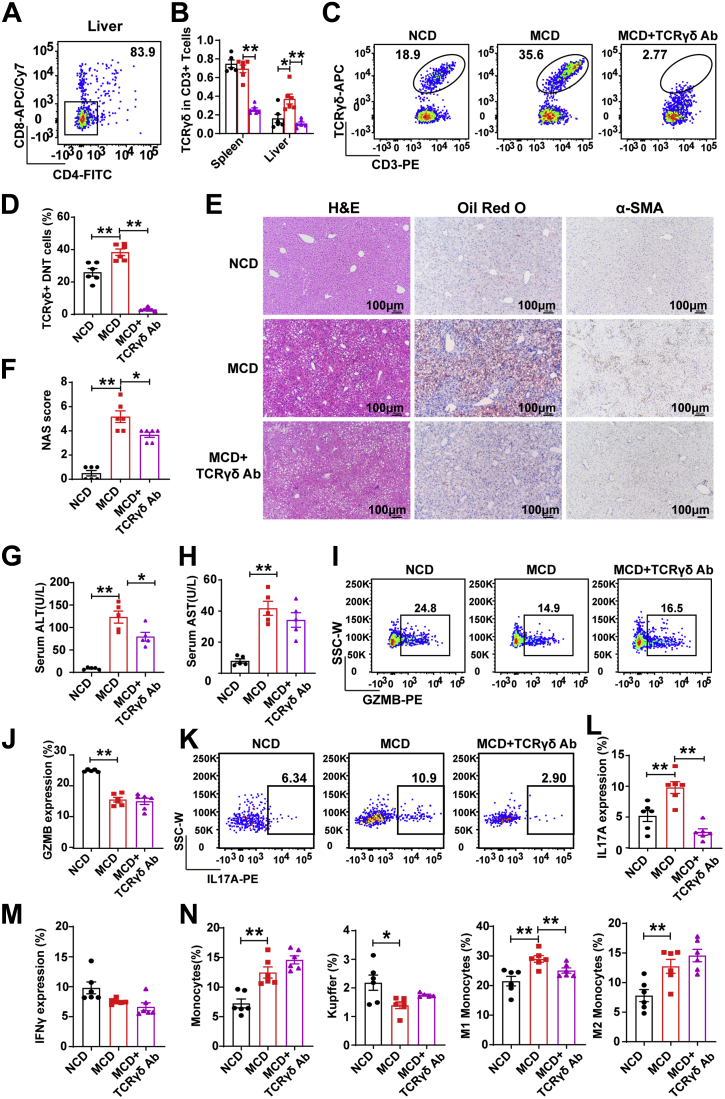
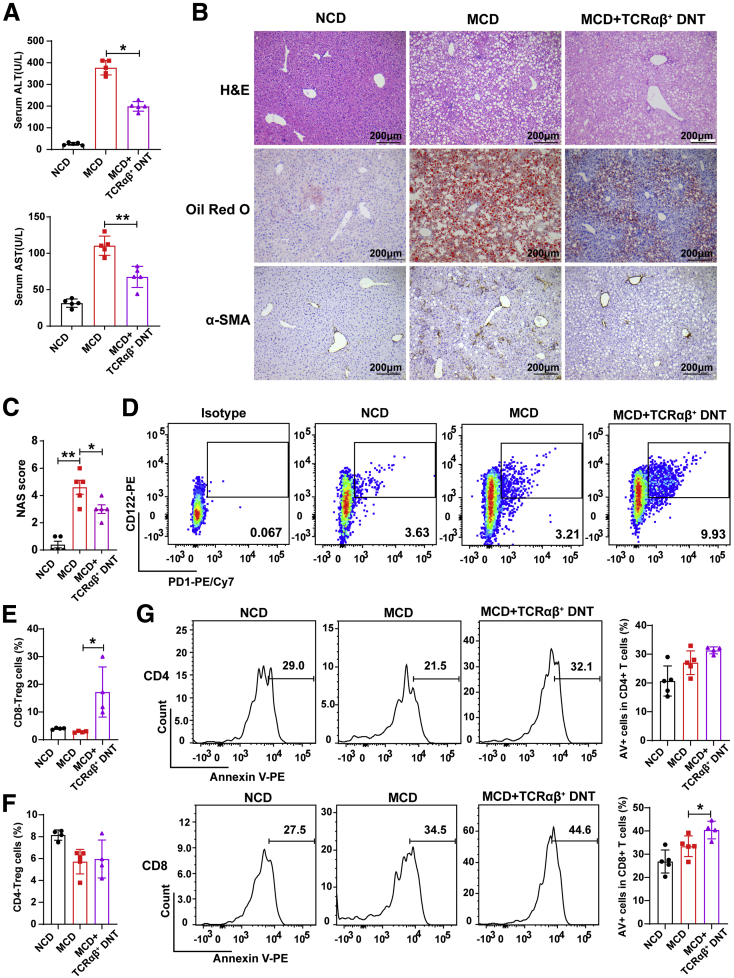
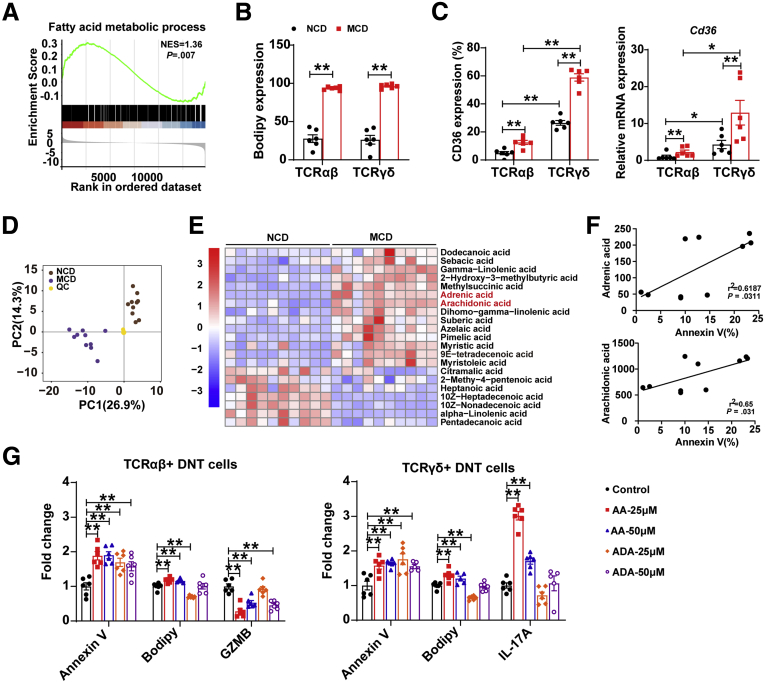
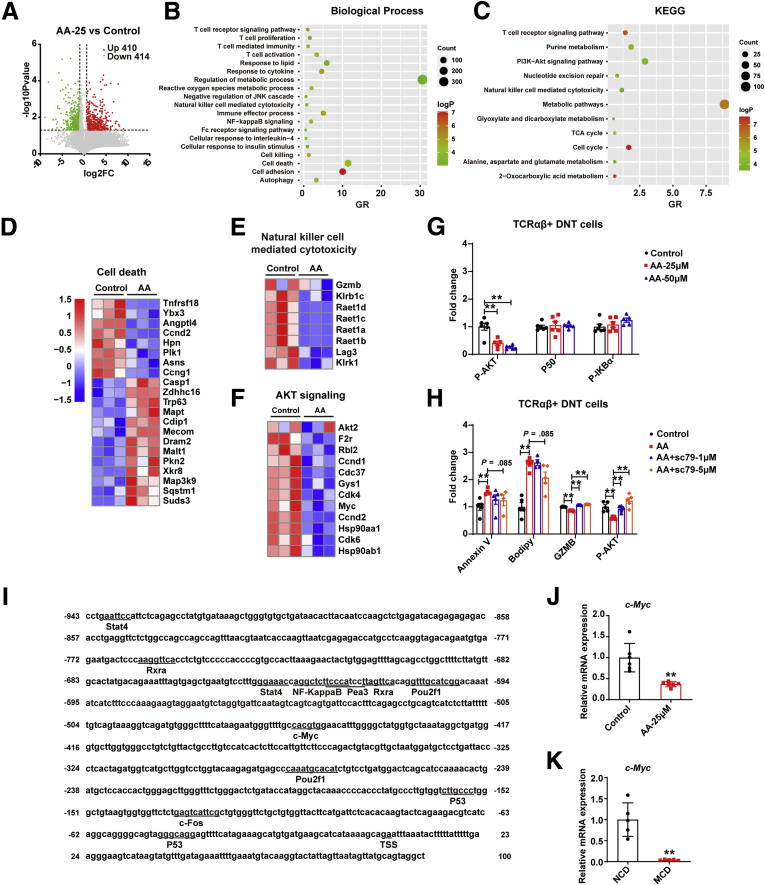
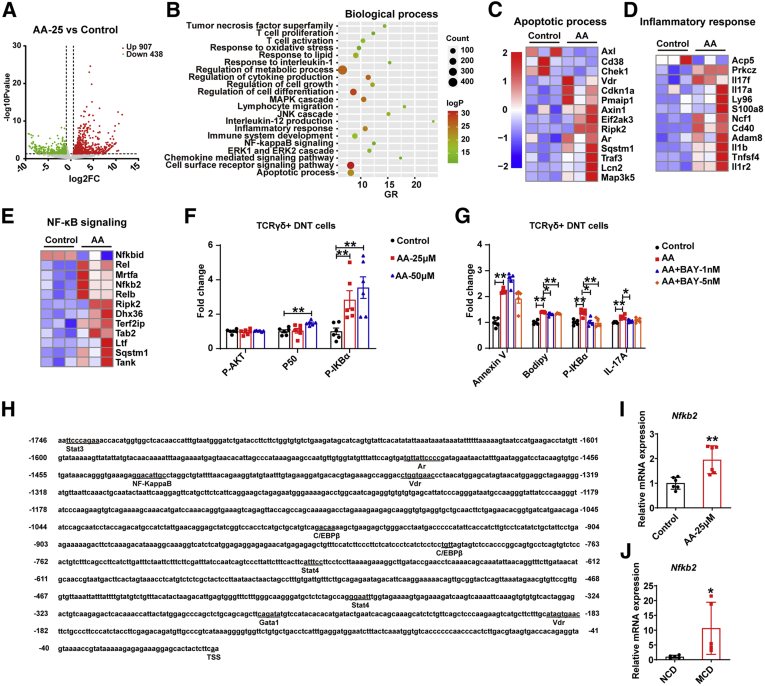
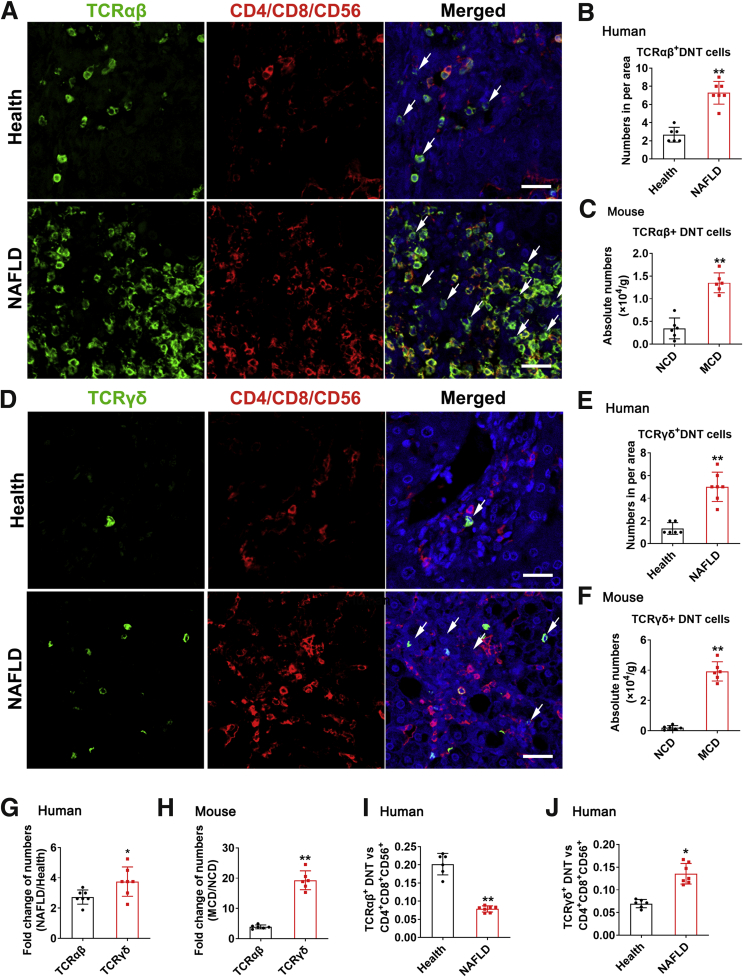
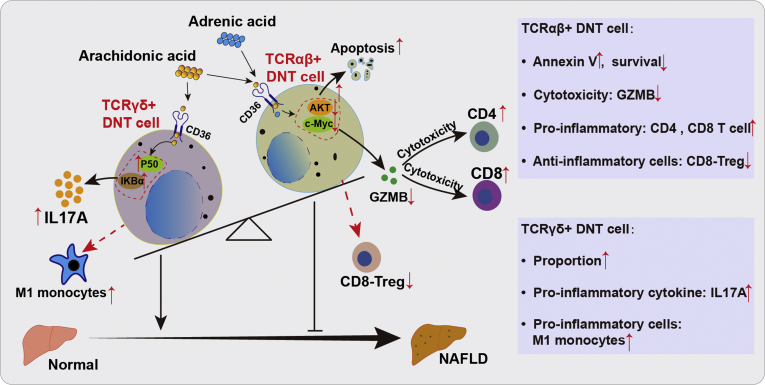
Results: The proportion of intrahepatic DNT cells was significantly increased in mice with diet-induced NAFLD. In NAFLD mice, the proportion of intrahepatic TCRγδ+ DNT cells was increased along with elevated interleukin (IL) 17A; in contrast, the percentage of TCRαβ+ DNT cells was decreased, accompanied by reduced granzyme B (GZMB). TCRγδ+ DNT cell depletion resulted in lowered liver IL17A levels and significantly alleviated NAFLD. Adoptive transfer of intrahepatic TCRαβ+ DNT cells from control mice increased intrahepatic CD4 and CD8 T cell apoptosis and inhibited NAFLD progression. Furthermore, we revealed that adrenic acid and arachidonic acid, harmful fatty acids that were enriched in the liver of the mice with NAFLD, could induce apoptosis of TCRαβ+ DNT cells and inhibit their immunosuppressive function and nuclear factor kappa B (NF-κB) or AKT signaling pathway activity. However, arachidonic acid facilitated IL17A secretion by TCRγδ+ DNT cells, and the NF-κB signaling pathway was involved. Finally, we also confirmed the variation of intrahepatic TCRαβ+ DNT cells and TCRγδ+ DNT cells in humans.

Conclusions: During NAFLD progression, TCRγδ+ DNT cells enhance IL17A secretion and aggravate liver inflammation, whereas TCRαβ+ DNT cells decrease GZMB production and lead to weakened immunoregulatory function. Shifting of balance from TCRγδ+ DNT cell response to one that favors TCRαβ+ DNT regulation would be beneficial for the prevention and treatment of NAFLD.

Keywords: GZMB; IL17A; NAFLD; TCRαβ(+) DNT Cells; TCRγδ(+) DNT Cells.


Figures

None
Graphical abstract
Figure 1
Figure 1
Proportion of DNT cells increased in MCD-induced NAFLD for 5 weeks. (A) Percentages of DNT cells in CD3+ T cells among the liver, spleen, blood, ALNs, DLNs, MLNs, and ILNs from normal mice. (B) Representative H&E staining and Oil Red O and α-SMA staining in livers of NCD- and MCD-fed mice. (C) NAFLD activity score (NAS) in livers of NCD and MCD mice. (D) Serum ALT and serum AST were measured in NCD- and MCD-fed mice. (E) Representative flow cytometry plots and statistical analysis of percentages of intrahepatic DNT cells in CD3+ T cells and CD45+ T cells of NCD- and MCD-fed mice. (F) Numbers of intrahepatic DNT cells in NCD- and MCD-fed mice. (G) Representative flow cytometry plots and statistical analysis of annexin V+ and Ki67+ expression in intrahepatic DNT cells in NCD- and MCD-fed mice. (H) Percentages of DNT cells in CD3+ T cells among the spleen, blood, ALNs, DLNs, and MLNs of NCD- and MCD-fed mice. n ≥ 4 mice/group. Two-sided P values <.05 were considered significant. ∗∗P < .01; ∗P < .05.
Figure 2
Figure 2
Proportion of DNT cells increased in CDHFD-induced NAFLD. (A) Serum ALT and serum AST were measured in NCD- and CDHFD-fed mice. (B) Representative H&E staining and Oil Red O and α-SMA staining in livers of NCD- and CDHFD-fed mice. (C) NAFLD activity score (NAS) in livers of NCD and CDHFD mice. (D) Representative flow cytometry plots and statistical analysis of percentages of intrahepatic DNT cells in CD3+ T cells and CD45+ T cells of NCD- and CDHFD-fed mice. (E) Representative flow cytometry plots and statistical analysis of annexin V+ expression in intrahepatic DNT cells in NCD- and CDHFD-fed mice. n ≥ 3 mice/group. Two-sided P values <.05 were considered significant. ∗∗P < .01; ∗P < .05.
Figure 3
Figure 3
RNA-sequencing showed the differentially expressed genes and biological function of DNT cells from livers of MCD-fed mice compared with NCD-fed mice. (A) Differences of genes with up-regulated (422) and down-regulated (458) expression in intrahepatic DNT cells from MCD-fed mice compared with NCD-fed mice; fold change ≤ 0.5 or fold change ≥ 1.5; P < .05. (B and C) Biological Process and KEGG pathway analyses were performed on the basis of the genes with significantly up-regulated and down-regulated expression in intrahepatic DNT cells from MCD-fed mice compared with NCD-fed mice. (D) GSEA of positive regulation of the T-cell apoptotic process in intrahepatic DNT cells from MCD-fed mice compared with NCD-fed mice. (E and F) Heatmap showing up-regulated and down-regulated genes related to cell apoptosis in intrahepatic DNT cells from MCD-fed mice compared with NCD-fed mice. The significantly changed genes related to cell apoptosis were confirmed via real-time PCR. (G) GSEA of cell killing in intrahepatic DNT cells of MCD-fed mice. (H) Heatmap showing the genes with down-regulated expression related to cell-mediated cytotoxicity in intrahepatic DNT cells from MCD-fed mice compared with NCD-fed mice. (I) The significantly changed genes related to cell-mediated cytotoxicity were confirmed via real-time PCR. (J and K) Representative flow cytometry plots and statistical analysis of GZMB and NKG2D expression in intrahepatic DNT cells from NCD- and MCD-fed mice. (L) GSEA of the inflammatory response in intrahepatic DNT cells from NCD- and MCD-fed mice. (M) Heatmap showing genes with up-regulated and down-regulated expression related to the inflammatory response in intrahepatic DNT cells from livers of MCD-fed mice compared with NCD-fed mice. (N) The significantly changed genes related to the inflammatory response were confirmed via real-time PCR. (O) GSEA of the response to IL17 in intrahepatic DNT cells from NCD- and MCD-fed mice. (P) Representative flow cytometry plots and statistical analysis of IL17A expression in intrahepatic DNT cells from NCD- and MCD-fed mice. n ≥ 5 mice/group. Two-sided P values <.05 were considered significant. ∗∗P < .01; ∗P < .05.
Figure 4
Figure 4
Immunosuppressive function of DNT cells was controlled by TCRαβ+ DNT cells, and secretion of inflammatory factors was controlled by TCRγδ+DNT cells. (A) Representative flow cytometry gating strategy of TCR proportions in intrahepatic DNT cells. (B) Representative flow cytometry plots of TCR proportions in intrahepatic DNT cells from MCD- and NCD-fed mice. (C) Statistical analysis in apoptosis of TCR subtypes in intrahepatic DNT cells from MCD- compared with NCD-fed mice by flow cytometry. n = 3 mice/group. (D) Statistical analysis by flow cytometry of CXCR6 expression in liver and spleen TCRγδ+ DNT cells and TCRαβ+ DNT cells among NCD- and MCD-fed mice. (E) The mRNA expression of Cxcl16 in liver among NCD- and MCD-fed mice. (F, H, and I) Representative flow cytometry plots and mRNA of GZMB expression in intrahepatic TCRγδ+ DNT cells and TCRαβ+ DNT cells among NCD- and MCD-fed mice. (G, J, and K) Representative flow cytometry plots and mRNA of IL17A expression in intrahepatic TCRγδ+ DNT cells and TCRαβ+ DNT cells from NCD- and MCD-fed mice. n ≥ 5 mice/group. Two-sided P values <.05 were considered significant. ∗∗P < .01; ∗P < .05.
Figure 5
Figure 5
TCRγδ+DNT depletion resulted in lowered liver IL17A levels and significantly alleviated diet-induced NAFLD. (A) Representative flow cytometry plots of DNT proportions in TCRγδ+ T cells. (B) Statistical analysis of TCRγδ+ T cells in CD3+ T cells from the spleen and liver of NCD- and MCD-fed mice and TCRγδ+ DNT-depleted mice. (C and D) Representative flow cytometry plots and statistical analysis of TCRγδ+ T cells in intrahepatic DNT cells of NCD- and MCD-fed mice and TCRγδ+ DNT-depleted mice. (E) Representative H&E staining and Oil Red O and α-SMA staining in livers of NCD- and MCD-fed mice and TCRγδ+ DNT-depleted mice. (F) NAFLD activity score (NAS) in livers of NCD- and MCD-fed mice and TCRγδ+ DNT-depleted mice. (G and H) Serum ALT and serum AST were measured in livers from NCD- and MCD-fed mice and TCRγδ+ DNT-depleted mice. (I–L) Representative flow cytometry plots and statistical analysis of GZMB and IL17A expression in intrahepatic DNT cells from NCD- and MCD-fed mice and TCRγδ+ DNT-depleted mice. (M) Statistical analysis of interferon γ expression in intrahepatic DNT cells from NCD- and MCD-fed mice and TCRγδ+ DNT-depleted mice by flow cytometry. (N) Proportions of monocytes (CD45+Ly6G-F4/80intCD11bhi), Kupffer cells (CD45+Ly6G-F4/80hiCD11bint), M1 monocytes (CD45+Ly6G-F4/80intCD11bhiCD11c+CD206-), and M2 monocytes (CD45+Ly6G-F4/80intCD11bhiCD11c-CD206+) among intrahepatic DNT cells from NCD- and MCD-fed mice and TCRγδ+ DNT-depleted mice. n ≥ 5 mice/group. Two-sided P values <.05 were considered significant. ∗∗P < .01; ∗P < .05.
Figure 6
Figure 6
Adoptive transfer of TCRαβ+DNT cells prevented the development and progression of NAFLD. (A) Serum ALT and serum AST levels were measured in NCD- and MCD-fed mice and TCRαβ+ DNT cell-transferred mice. (B) Representative H&E staining and Oil Red O and α-SMA staining in livers from NCD- and MCD-fed mice and TCRαβ+ DNT-transferred mice. (C) NAFLD activity score (NAS) in livers of NCD- and MCD-fed mice and TCRαβ+ DNT-transferred mice. (D–F) Representative flow cytometry plots and statistical analysis of proportion of CD4+ and CD8+ Treg cells among livers of NCD- and MCD-fed mice and TCRαβ+DNT cell-transferred mice. (G) Representative flow cytometry plots and statistical analysis of apoptosis of intrahepatic CD4+ and CD8+ cells of NCD- and MCD-fed mice and TCRαβ+DNT cell-transferred mice. n ≥ 4 mice/group. Two-sided P values <.05 were considered significant. ∗∗P < .01; ∗P < .05.
Figure 7
Figure 7
FAs are involved in regulating apoptosis and the function of TCR subtypes of DNT cells. (A) GSEA of the response to FA metabolism. (B) The level of Bodipy in intrahepatic TCRαβ+ DNT cells and TCRγδ+ DNT cells in NCD- and MCD-fed mice. n = 6 mice/group. (C) CD36 expression in intrahepatic DNT cells of NCD- and MCD-fed mice by flow cytometry and real-time PCR. n = 6 mice/group. (D) Principal component analysis of metabonomics in livers of NCD- and MCD-fed mice. (E) FA content in livers of NCD- and MCD-fed mice. n = 6 mice/group. (F) Correlation between the harmful FAs ADA, AA levels, and DNT cell apoptosis. n = 9 mice/group. (G) Apoptosis, Bodipy, GZMB, IL17A expression in TCRγδ+ and TCRαβ+ DNT cells after ADA and AA stimulation. n = 6 biologically independent samples per group. Two-sided P values <.05 were considered significant. ∗∗P < .01; ∗P < .05.
Figure 8
Figure 8
AA regulates TCRαβ+DNT cells function by AKT signaling pathway. (A) Distributions of differential genes with up-regulated (410) and down-regulated (414) expression in TCRαβ+ DNT cells with or without AA stimulation; fold change ≤ 0.5 or fold change ≥ 1.5; P < .05. n = 3/group. (B and C) Biological Process and KEGG pathway analysis were performed on basis of differential genes with significantly up-regulated and down-regulated expression in TCRαβ+ DNT cells with or without AA stimulation. (D and E) Heatmap showing the genes related to cell death and natural killer cell mediated cytotoxicity in AA-treated TCRαβ+ DNT cells and control. (F) Heatmap showing expression of AKT signaling pathway in AA-treated TCRαβ+ DNT cells and control. (G) P-AKT, P50, and P-IKBα expression in TCRαβ+ DNT cells after AA stimulation. n = 6 biologically independent samples per group. (H) Apoptosis, Bodipy, GZMB, P-AKT expression in TCRαβ+ DNT cells after treating with AA and AKT agonist SC-79. n = 6 biologically independent samples per group. (I) The TFBSs in the upstream region (2k base pairs upstream from transcription starting site) and downstream region (100 base pairs downstream from transcription starting site) of GzmB were predicted. (J) Real-time PCR verified expression of c-Myc in AA-treated TCRαβ+ DNT cells and control. n = 6 biologically independent samples per group. (K) Real-time PCR verified expression of c-Myc in TCRαβ+ DNT cells in NAFLD and normal mice livers. n = 5 biologically independent samples per group. Two-sided P values <.05 were considered significant. ∗∗P < .01; ∗P < .05.
Figure 9
Figure 9
AA regulatesTCRγδ+DNT cells function via NF-κB signaling pathway. (A) Distributions of differential genes with up-regulated (907) and down-regulated (438) expression in AA-treated TCRγδ+ DNT cells and control; fold change ≤ 0.5 or fold change ≥ 1.5; P < .05. n = 3/group. (B) Biological Process analysis was performed on basis of differential genes with significantly up-regulated and down-regulated expression in AA-treated TCRγδ+ DNT cells and control. (C and D) Heatmap showing the genes related to apoptotic process and inflammatory response in AA-treated TCRγδ+ DNT cells and control. (E) Heatmap showing expression of NF-κB signaling pathway in AA-treated TCRγδ+ DNT cells and control. (F) P-AKT, P50, and P-IKBα expression in TCRγδ+ DNT cells after AA stimulation. n = 6 biologically independent samples per group. (G) Apoptosis, Bodipy, P-IKBα, and IL17A expression in TCRγδ+ DNT cells after treating with AA and NF-κB inhibitor BAY 11-7082. n = 6 biologically independent samples per group. (H) The TFBSs in the upstream region (2k base pairs upstream from the transcription starting site) and downstream region (100 base pairs downstream from the transcription starting site) of Il17a were predicted. (I) Real-time PCR verified the expression of Nfkb2 in AA-treated TCRγδ+ DNT cells and control. n = 6 biologically independent samples per group. (J) Real-time PCR verified the expression of Nfkb2 in TCRγδ+ DNT cells in NAFLD and normal mice livers. n = 5 biologically independent samples per group. Two-sided P values <.05 were considered significant. ∗∗P < .01; ∗P < .05.
Figure 10
Figure 10
The variation tendency of DNT cells in livers of NAFLD patients was consistent with that in mice. (A) Typical picture of multiplex immunofluorescence staining of human liver sections. TCRαβ (green), CD4/CD8/CD56 (red). White arrowheads indicate DNT cells. Scale bar, 25 μm. (B) Number of TCRαβ+ DNT cells per area in human liver. The number of DNT cells per area (150 μm × 150 μm) was counted. (C) Absolute number of TCRαβ+DNT cells per g mouse liver. (D) Typical picture of multiplex immunofluorescence staining of human liver sections. TCRγδ (green), CD4/CD8/CD56 (red). White arrowheads indicate DNT cells. Scale bar, 25 μm. (E) Number of TCRαβ+ DNT cells per area in human liver. The number of DNT cells per area (150 μm × 150 μm) was counted. (F) Absolute number of TCRγδ+ DNT cells per g mouse liver. (G) The amplitude of number variation of TCRγδ+CD4CD8CD56 T cells and TCRαβ+CD4CD8CD56 T cells in NAFLD/Health. (H) The amplitude of number variation of TCRαβ+ DNT cells and TCRγδ+ DNT cells in MCD/NCD. (I) Ratio of TCRαβ+DNT cells with CD4+CD8+CD56+ cells (0.02 cm2 per area). (J) Ratio of TCRγδ+ DNT cells with CD4+CD8+CD56+ cells (0.02 cm2 per area). Two-sided P values <.05 were considered significant. ∗∗P < .01; ∗P < .05.
Figure 11
Figure 11
Intrinsic mechanisms of AA and ADA regulation on TCRαβ+ and TCRγδ+ DNT cells during NAFLD development. AA and ADA induced apoptosis of TCRαβ+ DNT cells and decreased their immunosuppressive function, which were mainly associated with the AKT signaling pathway during NAFLD development. AA also facilitated IL17A secretion by TCRγδ+ DNT cells, which was mainly associated with the NF-κB signaling pathway.

Similar articles

Cited by

References

    1. Younossi Z., Anstee Q.M., Marietti M., Hardy T., Henry L., Eslam M., George J., Bugianesi E. Global burden of NAFLD and NASH: trends, predictions, risk factors and prevention. Nat Rev Gastroenterol Hepatol. 2018;15:11–20. - PubMed
    1. Petroni M.L., Brodosi L., Bugianesi E., Marchesini G. Management of non-alcoholic fatty liver disease. BMJ. 2021;372 - PubMed
    1. Sheka A.C., Adeyi O., Thompson J., Hameed B., Crawford P.A., Ikramuddin S. Nonalcoholic steatohepatitis: a review. JAMA. 2020;323:1175–1183. - PubMed
    1. Cai J., Zhang X.J., Li H. The role of innate immune cells in nonalcoholic steatohepatitis. Hepatology. 2019;70:1026–1037. - PubMed
    1. Sutti S., Albano E. Adaptive immunity: an emerging player in the progression of NAFLD. Nat Rev Gastroenterol Hepatol. 2020;17:81–92. - PMC - PubMed

Publication types

MeSH terms