

QSMRim-Net: Imbalance-aware learning for identification of chronic active multiple sclerosis lesions on quantitative susceptibility maps
- PMID: 35247730
- PMCID: PMC8892132
- DOI: 10.1016/j.nicl.2022.102979
QSMRim-Net: Imbalance-aware learning for identification of chronic active multiple sclerosis lesions on quantitative susceptibility maps
Abstract
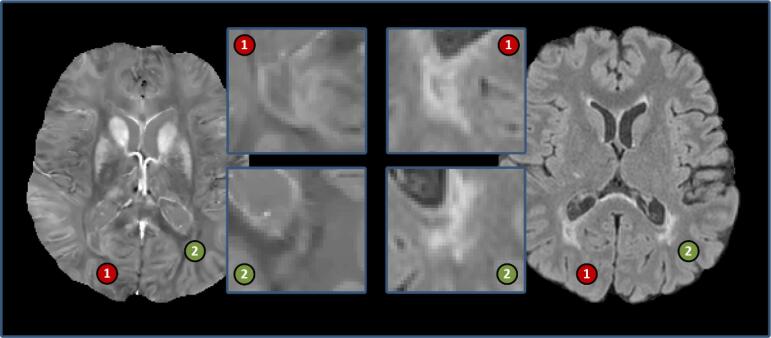
Background and purpose: Chronic active multiple sclerosis (MS) lesions are characterized by a paramagnetic rim at the edge of the lesion and are associated with increased disability in patients. Quantitative susceptibility mapping (QSM) is an MRI technique that is sensitive to chronic active lesions, termed rim + lesions on the QSM. We present QSMRim-Net, a data imbalance-aware deep neural network that fuses lesion-level radiomic and convolutional image features for automated identification of rim + lesions on QSM.
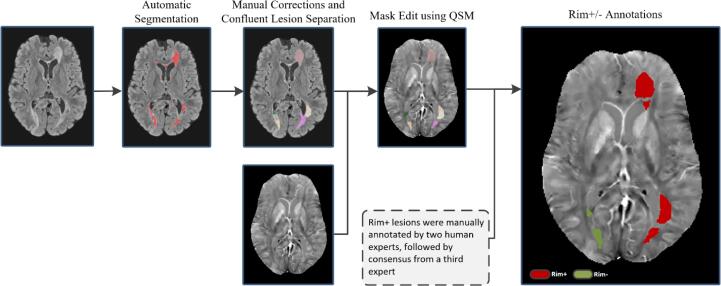
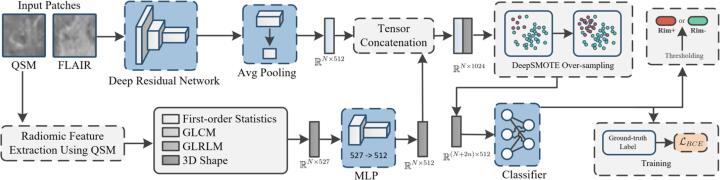
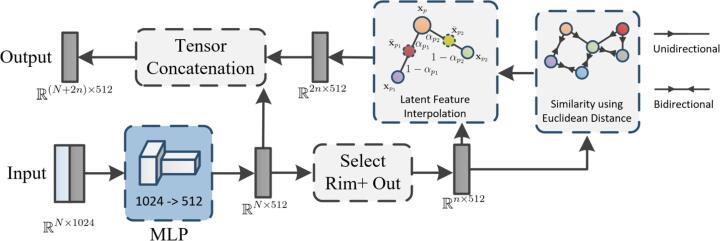
Methods: QSM and T2-weighted-Fluid-Attenuated Inversion Recovery (T2-FLAIR) MRI of the brain were collected at 3 T for 172 MS patients. Rim + lesions were manually annotated by two human experts, followed by consensus from a third expert, for a total of 177 rim + and 3986 rim negative (rim-) lesions. Our automated rim + detection algorithm, QSMRim-Net, consists of a two-branch feature extraction network and a synthetic minority oversampling network to classify rim + lesions. The first network branch is for image feature extraction from the QSM and T2-FLAIR, and the second network branch is a fully connected network for QSM lesion-level radiomic feature extraction. The oversampling network is designed to increase classification performance with imbalanced data.
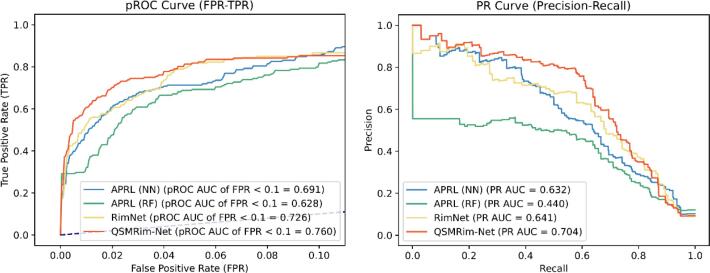
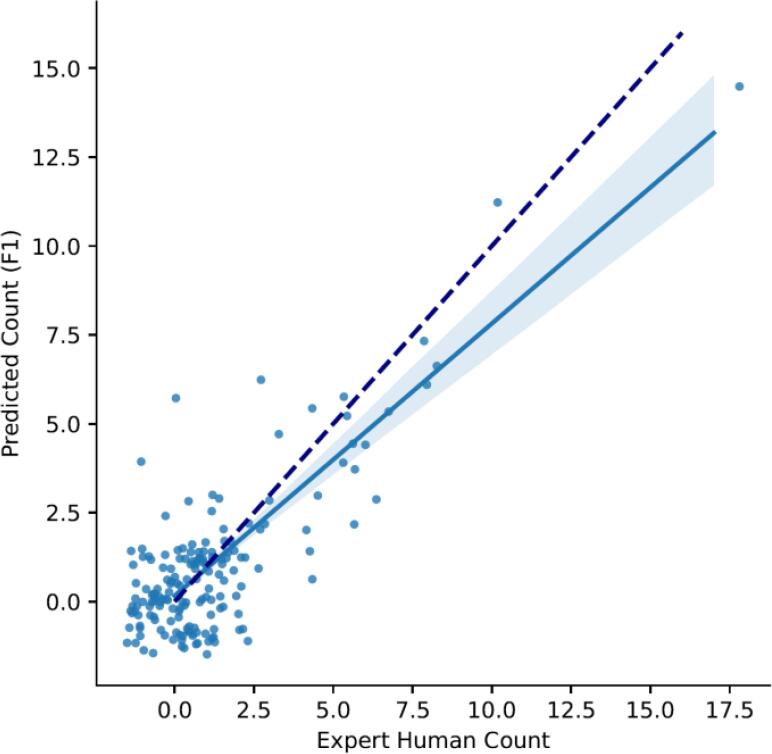
Results: On a lesion-level, in a five-fold cross validation framework, the proposed QSMRim-Net detected rim + lesions with a partial area under the receiver operating characteristic curve (pROC AUC) of 0.760, where clinically relevant false positive rates of less than 0.1 were considered. The method attained an area under the precision recall curve (PR AUC) of 0.704. QSMRim-Net out-performed other state-of-the-art methods applied to the QSM on both pROC AUC and PR AUC. On a subject-level, comparing the predicted rim + lesion count and the human expert annotated count, QSMRim-Net achieved the lowest mean square error of 0.98 and the highest correlation of 0.89 (95% CI: 0.86, 0.92).
Conclusion: This study develops a novel automated deep neural network for rim + MS lesion identification using T2-FLAIR and QSM images.
Keywords: Chronic active lesions; Convolutional neural network; Multiple sclerosis; Quantitative susceptibility mapping; Radiomic features.
Copyright © 2022. Published by Elsevier Inc.
Figures
Similar articles
-
Central Vein Sign and Paramagnetic Rim Lesions: Susceptibility Changes in Brain Tissues and Their Implications for the Study of Multiple Sclerosis Pathology.Diagnostics (Basel). 2024 Jun 27;14(13):1362. doi: 10.3390/diagnostics14131362. Diagnostics (Basel). 2024. PMID: 39001252 Free PMC article. Review.
-
RimNet: A deep 3D multimodal MRI architecture for paramagnetic rim lesion assessment in multiple sclerosis.Neuroimage Clin. 2020;28:102412. doi: 10.1016/j.nicl.2020.102412. Epub 2020 Sep 4. Neuroimage Clin. 2020. PMID: 32961401 Free PMC article.
-
Fully automated detection of paramagnetic rims in multiple sclerosis lesions on 3T susceptibility-based MR imaging.Neuroimage Clin. 2021;32:102796. doi: 10.1016/j.nicl.2021.102796. Epub 2021 Aug 27. Neuroimage Clin. 2021. PMID: 34644666 Free PMC article.
-
Quantitative susceptibility mapping versus phase imaging to identify multiple sclerosis iron rim lesions with demyelination.J Neuroimaging. 2022 Jul;32(4):667-675. doi: 10.1111/jon.12987. Epub 2022 Mar 9. J Neuroimaging. 2022. PMID: 35262241 Free PMC article.
-
The prevalence of paramagnetic rim lesions in multiple sclerosis: A systematic review and meta-analysis.PLoS One. 2021 Sep 8;16(9):e0256845. doi: 10.1371/journal.pone.0256845. eCollection 2021. PLoS One. 2021. PMID: 34495999 Free PMC article.
Cited by
-
Central Vein Sign and Paramagnetic Rim Lesions: Susceptibility Changes in Brain Tissues and Their Implications for the Study of Multiple Sclerosis Pathology.Diagnostics (Basel). 2024 Jun 27;14(13):1362. doi: 10.3390/diagnostics14131362. Diagnostics (Basel). 2024. PMID: 39001252 Free PMC article. Review.
-
The role of AI for MRI-analysis in multiple sclerosis-A brief overview.Front Artif Intell. 2025 Apr 8;8:1478068. doi: 10.3389/frai.2025.1478068. eCollection 2025. Front Artif Intell. 2025. PMID: 40265105 Free PMC article. Review.
-
Imaging Outcomes for Phase 2 Trials Targeting Compartmentalized Inflammation.Mult Scler. 2024 Dec;30(5_suppl):48-60. doi: 10.1177/13524585241301303. Mult Scler. 2024. PMID: 39658905 Free PMC article. Review.
-
Reliability of paramagnetic rim lesion classification on quantitative susceptibility mapping (QSM) in people with multiple sclerosis: Single-site experience and systematic review.Mult Scler Relat Disord. 2023 Nov;79:104968. doi: 10.1016/j.msard.2023.104968. Epub 2023 Sep 14. Mult Scler Relat Disord. 2023. PMID: 37716210 Free PMC article.
-
Imaging chronic active lesions in multiple sclerosis: a consensus statement.Brain. 2024 Sep 3;147(9):2913-2933. doi: 10.1093/brain/awae013. Brain. 2024. PMID: 38226694 Free PMC article. Review.
References
Publication types
MeSH terms
Grants and funding
LinkOut - more resources
Full Text Sources
Medical
Research Materials
