. 2022 Jun 6;82(11):2156-2170.
doi: 10.1158/0008-5472.CAN-21-2076.

Tumor Intrinsic PD-L1 Promotes DNA Repair in Distinct Cancers and Suppresses PARP Inhibitor-Induced Synthetic Lethality

Affiliations

Tumor Intrinsic PD-L1 Promotes DNA Repair in Distinct Cancers and Suppresses PARP Inhibitor-Induced Synthetic Lethality

Anand V R Kornepati et al. Cancer Res. .

Abstract

BRCA1-mediated homologous recombination is an important DNA repair mechanism that is the target of FDA-approved PARP inhibitors, yet details of BRCA1-mediated functions remain to be fully elucidated. Similarly, immune checkpoint molecules are targets of FDA-approved cancer immunotherapies, but the biological and mechanistic consequences of their application are incompletely understood. We show here that the immune checkpoint molecule PD-L1 regulates homologous recombination in cancer cells by promoting BRCA1 nuclear foci formation and DNA end resection. Genetic depletion of tumor PD-L1 reduced homologous recombination, increased nonhomologous end joining, and elicited synthetic lethality to PARP inhibitors olaparib and talazoparib in vitro in some, but not all, BRCA1 wild-type tumor cells. In vivo, genetic depletion of tumor PD-L1 rendered olaparib-resistant tumors sensitive to olaparib. In contrast, anti-PD-L1 immune checkpoint blockade neither enhanced olaparib synthetic lethality nor improved its efficacy in vitro or in wild-type mice. Tumor PD-L1 did not alter expression of BRCA1 or its cofactor BARD1 but instead coimmunoprecipitated with BARD1 and increased BRCA1 nuclear accumulation. Tumor PD-L1 depletion enhanced tumor CCL5 expression and TANK-binding kinase 1 activation in vitro, similar to known immune-potentiating effects of PARP inhibitors. Collectively, these data define immune-dependent and immune-independent effects of PARP inhibitor treatment and genetic tumor PD-L1 depletion. Moreover, they implicate a tumor cell-intrinsic, immune checkpoint-independent function of PD-L1 in cancer cell BRCA1-mediated DNA damage repair with translational potential, including as a treatment response biomarker.

Significance: PD-L1 upregulates BRCA1-mediated homologous recombination, and PD-L1-deficient tumors exhibit BRCAness by manifesting synthetic lethality in response to PARP inhibitors, revealing an exploitable therapeutic vulnerability and a candidate treatment response biomarker. See related commentary by Hanks, p. 2069.


Conflict of interest statement

Competing Interests: A.V.K and T.J.C have filed a patent application on targeting non-canonical PD-L1 signals in cancer cells.

Figures

Figure 1.
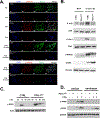
Figure 1.. Tumor PD-L1 promotes BRCA1 nuclear foci formation and DNA end resection in response to DNA damage.
A. Representative confocal images of CTRL versus PD-L1KO T24 cells stained for p-BRCA1Ser1524 and p-RPA32S4/S8 DNA damage repair nuclear foci following 2 Gy ionizing radiation (1-hour recovery) or 1 ng/ml gemcitabine (4-hour incubation) as indicated. Immunofluorescence scale bars, 10 μM. B. Immunoblotting analysis of ATR/Chk1 pathway activation measured by p-ATR, p-Chk1 and p-RPA32 accumulation in response to 2 Gy ionizing X-irradiation 4 hours post treatment in CTRL and PD-L1KO T24 cells. C. Western blot analysis of CTRL and PD-L1KO T24 cells for γH2AX, levels at indicated recovery time periods in hours (h) following ionizing irradiation (2 Gy). M, medium alone at time 0. D. CTRL and PD-L1KO T24 cells were treated with 2 Gy X-irradiation in the presence of emricasan (5 μM) or vehicle control as indicated for 8 hours. γH2AX and cleaved PARP (C-PARP) levels were measured by immunoblotting. Experiments were repeated for n=3 biological replicates with similar results.
Figure 2.
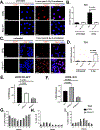
Figure 2.. PD-L1 promotes homologous recombination DNA repair efficiency.
A. Representative confocal images of CTRL and PD-L1KO T24 cells stained for RAD51 (red) before or 8 hours after 8 Gy ionizing X-irradiation with blue DAPI nuclear stain. B. Quantification of images from panel A for average RAD51 foci per nucleus. C. Representative confocal images of CTRL and PD-L1KO T24 cells stained for 53BP1 (red) before or 8 hours after 8 Gy ionizing X irradiation with blue DAPI nuclear stain. D. Quantification of images from panel C for average 53BP1 foci per nucleus. E. U2OS cells expressing the DR-GFP homologous recombination reporter transfected with an I-SceI plasmid and an shRNA against PD-L1 or Rad51 (positive control) and GFP positivity assessed by flow cytometry. % homologous recombination efficiency was calculated by normalizing to an empty vector (EV) control. F. U2OS cells expressing the EJ5 reporter transfected with an I-SceI NHEJ reporter plasmid and an shRNA against PD-L1 or XRCC5 (positive control) and GFP positivity assessed by flow cytometry. % non-homologous end joining efficiency calculated as in panel E. Cell cycle analysis of % cells in G1 G., S H. or G2 I. in CTRL versus PD-L1KO T24 cells following release from double thymidine block at the indicated time points (hours). NS, non-synchronized cells. All bar graphs shown represent the average of n=3 biological replicates and p-values calculated by unpaired t-test.
Figure 3.
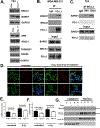
Figure 3.. Tumor PD-L1 associates with BARD1 and promotes nuclear BRCA1 nuclear.
A. Blots of BRCA1-BARD1 and ATM, factors involved in resecting DNA ends (P95/NBS1, Rad50), and homology directed recombination (Rad51). B. PD-L1 IP from human MBA-MB-231 cells and co-IP lysates blotted for BRCA1 or BARD1. C. PD-L1 IP from human T24 bladder cancer cells and co-IP lysates blotted for BARD1. D. Representative confocal images of CTRL and PD-L1KO T24 cells for total BRCA1 (tBRCA1) treated with 8 Gy ionizing X irradiation for 1 hour versus unirradiated controls. E. quantification of tBRCA1 foci from panel D. F. Quantification of nuclear (N) to cytoplasmic (C) MFI (mean fluorescence intensity, image J) of BRCA1 in CTRL versus PD-L1KO cells from panel D. G. CTRL (C) and PD-L1KO (K) T24 cells fractionated for cytoplasmic (GAPDH) and nuclear fractions (LAMIN B1) and immunoblotted for indicated proteins. +++, over-exposed blot. Black arrows show BRCA1 location. All bar graphs shown represent the average and standard deviation of n=3 biological replicates and p-values calculated by unpaired t-test.
Figure 4.
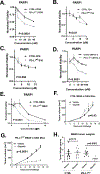
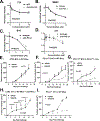
Figure 4.. PD-L1 deficiency promotes synthetic lethality to PARP inhibitors and treats NSG mice in vivo.
A. Viability normalizing to respective vehicle treated controls of CTRL versus PD-L1lo U2OS cells treated with the PARP inhibitor (PARP inhibitor) talazoparib at indicated concentrations for 5 days in vitro. Viability by MTT of CTRL versus PD-L1KO B. B16 and C. T24 treated with the PARP inhibitor olaparib in vitro for 5 days. Similarly, viability of D. UM-UC3 and E. MB49 treated with talazoparib or olaparib, respectively, is shown at indicated concentrations. MTT viability data as in A. are presented as mean ± standard error of the mean of at least n=3 biological replicates. P-value calculated by two-way ANOVA. Tumor measurements of NSG mice (n=10/group) subcutaneously challenged with F. CTRL or G. PD-L1KO MB49 cells and treated with olaparib (see materials and methods). P-values calculated by two-way ANOVA. H. Tumor weights of CTRL versus PD-L1KO tumors ± olaparib at endpoint of experiments in panels F,G. P values, unpaired t-test.
Figure 5.
Figure 5.. Genetic PD-L1 deficiency, but not anti-PD-L1, sensitizes tumors to PARP inhibitors in vivo in wild type mice.
Viability of CTRL versus genetically PD-L1-depleted A. T24, B. MB49, C. B16-F10 or D. 4T1 cells treated with olaparib (PARP inhibitor, 2.5 μM) ± isotype or anti-PD-L1 immune checkpoint blockade antibody. Viability was normalized to respective vehicle controls. Data represented as mean ± standard error of the mean of n=3 biological replicates. P-values calculated by two-way ANOVA. Atezolizumab (anti-human PD-L1 antibody) or anti-mouse PD-L1 antibody concentration on X-axis. Tumor measurements of wild type BL6 mice subcutaneously challenged with CTRL E. or PD-L1KO F. B16-F10 cells treated with olaparib (n=5 mice/group) at dose and schedule described in materials and methods. G. Tumor measurements of PD-L1KO BL6 mice subcutaneously challenged with PD-L1KO B16-F10 cells and treated with olaparib at dose and schedule as in E-F. H. Tumor measurements of wild type BALB/c mice bearing CTRL 4T1 cells treated with vehicle or olaparib (n=5 mice/group, see materials and methods). Both groups received anti-PD-L1 immune checkpoint blockade antibody at indicated time points (blue arrows). I. Tumor growth of wild type BALB/c mice bearing syngeneic PD-L1lo 4T1 tumors treated with vehicle or olaparib (n=5 mice/group) as in panel H. P-values calculated by two-way ANOVA.
Figure 6.
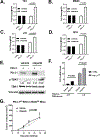
Figure 6.. Tumor-intrinsic PD-L1 suppresses PARP inhibitor- induced tumor DNA sensing activation.
CTRL or genetically PD-L1-depleted A. T24, B. MB49, C. B16-F10 or D. 4T1 cells treated with the PARP inhibitor olaparib (2.5 μM) for 48 hours and assessed for γH2AX by flow cytometry. Data represented as fold change of % γH2AX positive cells over respective vehicle treated controls. Bar graphs depict the average and standard deviation of n=3 biological replicates and p-values calculated by unpaired t-test. E. Immunoblotting of PD-L1, p-TBK1ser172, total TBK1 and Vinculin in CTRL versus PD-L1KO B16 cells treated with olaparib (2.5 μM) for 48 hours. Relative p-TBK1 intensity per lane is shown. Intensities were calculated using image J and normalized against untreated B16 CTRL lane (set to 1.00). F. CTRL and PD-L1KO cells were subjected to olaparib treatment as in A and normalized CCL5 gene expression was assessed by RT-qPCR. Data represent average ± standard deviation of n=3 independent experiments and p-values calculated by unpaired t-test. Difference in normalized CCL5 content ± olaparib in CTRL or PD-L1KO B16 cells is shown in G. RAG2KO mice challenged with PD-L1KO B16 cells and treated with olaparib (see materials and methods). P values, two-way ANOVA.

Comment in

References

    1. Topalian SL, Taube JM, Anders RA and Pardoll DM (2016) Mechanism-driven biomarkers to guide immune checkpoint blockade in cancer therapy. Nat Rev Cancer, 16, 275–287. - PMC - PubMed
    1. Kornepati AVR, Vadlamudi R. and Curiel T. (2021, in press) Programmed death ligand-1 signals in cancer cells. Nature Reviews Cancer. - PMC - PubMed
    1. Clark CA, Gupta HB, Sareddy G, Pandeswara S, Lao S, Yuan B, Drerup JM, Padron A, Conejo-Garcia J, Murthy K. et al. (2016) Tumor-Intrinsic PD-L1 Signals Regulate Cell Growth, Pathogenesis, and Autophagy in Ovarian Cancer and Melanoma. Cancer Res, 76, 6964–6974. - PMC - PubMed
    1. Gupta HB, Clark CA, Yuan B, Sareddy G, Pandeswara S, Padron AS, Hurez V, Conejo-Garcia J, Vadlamudi R, Li R. et al. (2016) Tumor cell-intrinsic PD-L1 promotes tumor-initiating cell generation and functions in melanoma and ovarian cancer. Signal Transduct Target Ther, 1, 1–9. - PMC - PubMed
    1. Chen C, Li S, Xue J, Qi M, Liu X, Huang Y, Hu J, Dong H. and Ling K. (2021) PD-L1 tumor-intrinsic signaling and its therapeutic implication in triple-negative breast cancer. JCI Insight, 6. - PMC - PubMed

Publication types