. 2022 May 3;82(9):1698-1711.
doi: 10.1158/0008-5472.CAN-21-3983.

Comprehensive Analysis of Metabolic Isozyme Targets in Cancer

Affiliations

Comprehensive Analysis of Metabolic Isozyme Targets in Cancer

Michal Marczyk et al. Cancer Res. .

Abstract

Metabolic reprogramming is a hallmark of malignant transformation, and loss of isozyme diversity (LID) contributes to this process. Isozymes are distinct proteins that catalyze the same enzymatic reaction but can have different kinetic characteristics, subcellular localization, and tissue specificity. Cancer-dominant isozymes that catalyze rate-limiting reactions in critical metabolic processes represent potential therapeutic targets. Here, we examined the isozyme expression patterns of 1,319 enzymatic reactions in 14 cancer types and their matching normal tissues using The Cancer Genome Atlas mRNA expression data to identify isozymes that become cancer-dominant. Of the reactions analyzed, 357 demonstrated LID in at least one cancer type. Assessment of the expression patterns in over 600 cell lines in the Cancer Cell Line Encyclopedia showed that these reactions reflect cellular changes instead of differences in tissue composition; 50% of the LID-affected isozymes showed cancer-dominant expression in the corresponding cell lines. The functional importance of the cancer-dominant isozymes was assessed in genome-wide CRISPR and RNAi loss-of-function screens: 17% were critical for cell proliferation, indicating their potential as therapeutic targets. Lists of prioritized novel metabolic targets were developed for 14 cancer types; the most broadly shared and functionally validated target was acetyl-CoA carboxylase 1 (ACC1). Small molecule inhibition of ACC reduced breast cancer viability in vitro and suppressed tumor growth in cell line- and patient-derived xenografts in vivo. Evaluation of the effects of drug treatment revealed significant metabolic and transcriptional perturbations. Overall, this systematic analysis of isozyme expression patterns elucidates an important aspect of cancer metabolic plasticity and reveals putative metabolic vulnerabilities.

Significance: This study exploits the loss of metabolic isozyme diversity common in cancer and reveals a rich pool of potential therapeutic targets that will allow the repurposing of existing inhibitors for anticancer therapy. See related commentary by Kehinde and Parker, p. 1695.


Figures

Figure 1.
Figure 1.
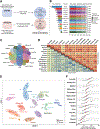
Characterization of isozyme mRNA expression in 14 cancer types. A, Data sources and sample sizes for human enzymatic reactions (ENZYME database) and isozyme expression (TCGA data downloaded from RNAseqDB). B, Number of paired tumor/normal samples, enzymatic reactions, and isozymes included in our analysis in each cancer type. C, Venn diagram of shared and private enzymatic reactions between cancer types. D, Top (red heat map), median Pearson correlation coefficients of isozyme expression levels between patients within and across cancer types. Bottom (blue heat map), Jaccard index of differentially expressed isozymes between tumor and corresponding normal tissues (defined as absolute log-fold change >2 and FDR <0.05). E, T-Distributed stochastic neighbor embedding (t-SNE) plot based on expression levels of all isozymes (n = 2,331) in all tumor and normal samples. F, Proportion of differentially expressed isozymes between tumor and normal tissues. Each dot represents a patient; medians are indicated by the red vertical lines.
Figure 2.
Figure 2.
LID in cancer and identification of potential therapeutic isozyme targets. A, Schematic representation of the strategy for finding an ideal therapeutic target isozyme showing LID. B, Venn diagram of private and shared enzymatic reactions showing LID across cancers. C, Left, total number of enzymatic reactions affected by LID in each cancer type. Right, Jaccard index of enzymes affected by LID across cancer types. D, Linear regression line of average selection scores and their SD across cancer types. Each point represents an enzymatic reaction; the color scale (yellow to red) indicates the number of cancers in which it shows LID. Gray shading around the regression line indicates the 95% confidence intervals. E, Over-representation analysis of LID enzymes in KEGG pathways. Color scale (yellow to red) reflects P values from the enrichment test (*, adjusted P < 0.01; **, adjusted P < 0.001). Number of pathways affected in different cancer types are shown on sidebars.
Figure 3.
Figure 3.
Prioritization of LID-based target isozymes by functional importance. A, Number of LID-based target isozymes that satisfied the three criteria for the functional assessment by cancer type. Each row corresponds to different criteria. B, Selection score distributions of isozymes that passed all three functional validation criteria and those that failed. C, Association between number of cancer types in which isozymes showed LID (x-axis) and number of corresponding cancer cell line models in which the isozymes were functionally validated (y-axis). Color scale shows percent functional validation rate, and the size of dots corresponds to the number of reactions.
Figure 4.
Figure 4.
Identification and prioritization of potential therapeutic isozyme targets in breast cancer subtypes. A, Venn diagrams of shared and private LID-based isozyme targets in breast cancer subtypes. JI, Jaccard index comparing similarity between subtypes. B, Overrepresentation analysis of LID enzymes in KEGG pathways. Color scale (yellow to red) reflects P values from the enrichment test (*, adjusted P < 0.01; **, adjusted P < 0.001). Number of pathways affected in different subtypes are shown on sidebars. C, Number of LID-based target isozymes that met four steps of the functional assessment by breast cancer subtype. D, Normalized log2 expression of BDH1 isozyme validated in all breast cancer subtypes as target. Black lines show average values for each isozyme.
Figure 5.
Figure 5.
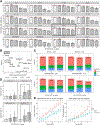
Inhibition of breast cancer cell viability and tumor growth by PF-05175157. A, Dose–response curve with 72 hours of exposure in 16 cell lines. Red dotted lines, no effect of treatment. Black frame highlights the normal epithelial cells. B, Association between predicted maximum cell viability inhibition and log EC50. Black frame highlights normal epithelial cell line. C, Proportion of cells in different cell-cycle phases measured in 2 cell lines (rows) and 2 time points (columns). D, Proportion of apoptotic cells measured in 2 cell lines (rows) and 2 time points (columns). Significant differences between different doses, *, P < 0.05. E, Tumor growth curves in mouse MDA-MB-468 xenograft and patient-derived TNBC xenografts with and without (Vehicle) drug treatment. Lines indicate prediction of mixed-effect model. Error bars show 95% confidence intervals around mean values of the data.
Figure 6.
Figure 6.
In vitro transcriptomic changes induced by PF-05175157. A, Volcano plots of differentially expressed genes at different time points in BT474 cells. Red dots, significantly affected genes (FDR < 0.05 and log2FC > 1). In the lower corners of each plot are the number of genes up- or downregulated after treatment. B, Validation of significantly altered genes at 24 hours in BT474 cells using data from MDA-MB-468 cells treated with PF-05175157 for 24 hours. Red dots, validated genes (i.e., P < 0.05 in MDA-MB-468 cells and the same direction of change in both cell lines); blue dots, not validated genes. C, Gene set enrichment analysis using the NanoString metabolic pathways. Red, higher expression of gene set after treatment; blue, higher expression in control (*, adjusted P < 0.05; **, adjusted P < 0.01). D, mRNA expression changes in key fatty acid metabolism enzymes mapped onto a schema of fatty acid metabolism (modified after Montesdeoca and colleagues; ref. 27).
Figure 7.
Figure 7.
In vitro metabolomic changes induced by PF-05175157. A, Volcano plots show increased and decreased metabolites after PF-05175157 treatment of BT474 cells. Red dots, significantly affected metabolites (FDR < 0.05 and log2FC > 1). In the lower corners of each plot are the number of metabolites that increased or decreased after treatment. Metabolites are coded by KEGG compound ID (https://www.genome.jp/kegg/compound/) and are listed in Supplementary Table S9. B, Validation of metabolites significantly altered in BT474 cells using MDA-MB-468 cells. Red dots, validated metabolites (P < 0.05 in MDA-MB-468 and the same direction of expression change in both cell lines); blue dots, not validated metabolites. C, Enrichment analysis of metabolites on KEGG metabolic pathways. Red, enrichment of a metabolic pathway after treatments (*, adjusted P < 0.05; **, adjusted P < 0.01).

Comment in

References

    1. Svensson RU, Shaw RJ. Cancer metabolism: tumor friend or foe. Nature 2012; 485:590–1. - PubMed
    1. Ward PS, Thompson CB. Metabolic reprogramming: a cancer hallmark even Warburg did not anticipate. Cancer Cell 2012;21:297–308. - PMC - PubMed
    1. Vogelstein B, Papadopoulos N, Velculescu VE, Zhou S, Diaz LA Jr, Kinzler KW. Cancer genome landscapes. Science 2013;339:1546–58. - PMC - PubMed
    1. Hu J, Locasale JW, Bielas JH, O’Sullivan J, Sheahan K, Cantley LC, et al. Heterogeneity of tumor-induced gene expression changes in the human metabolic network. Nat Biotechnol 2013;31:522–9. - PMC - PubMed
    1. Benjamin Daniel I, Cravatt Benjamin F, Nomura Daniel K. Global profiling strategies for mapping dysregulated metabolic pathways in cancer. Cell Metab 2012;16:565–77. - PMC - PubMed

Publication types