. 2022 May 2;12(5):1294-1313.
doi: 10.1158/2159-8290.CD-21-1207.

Genomic and Single-Cell Landscape Reveals Novel Drivers and Therapeutic Vulnerabilities of Transformed Cutaneous T-cell Lymphoma

Affiliations

Genomic and Single-Cell Landscape Reveals Novel Drivers and Therapeutic Vulnerabilities of Transformed Cutaneous T-cell Lymphoma

Xiaofei Song et al. Cancer Discov. .

Abstract

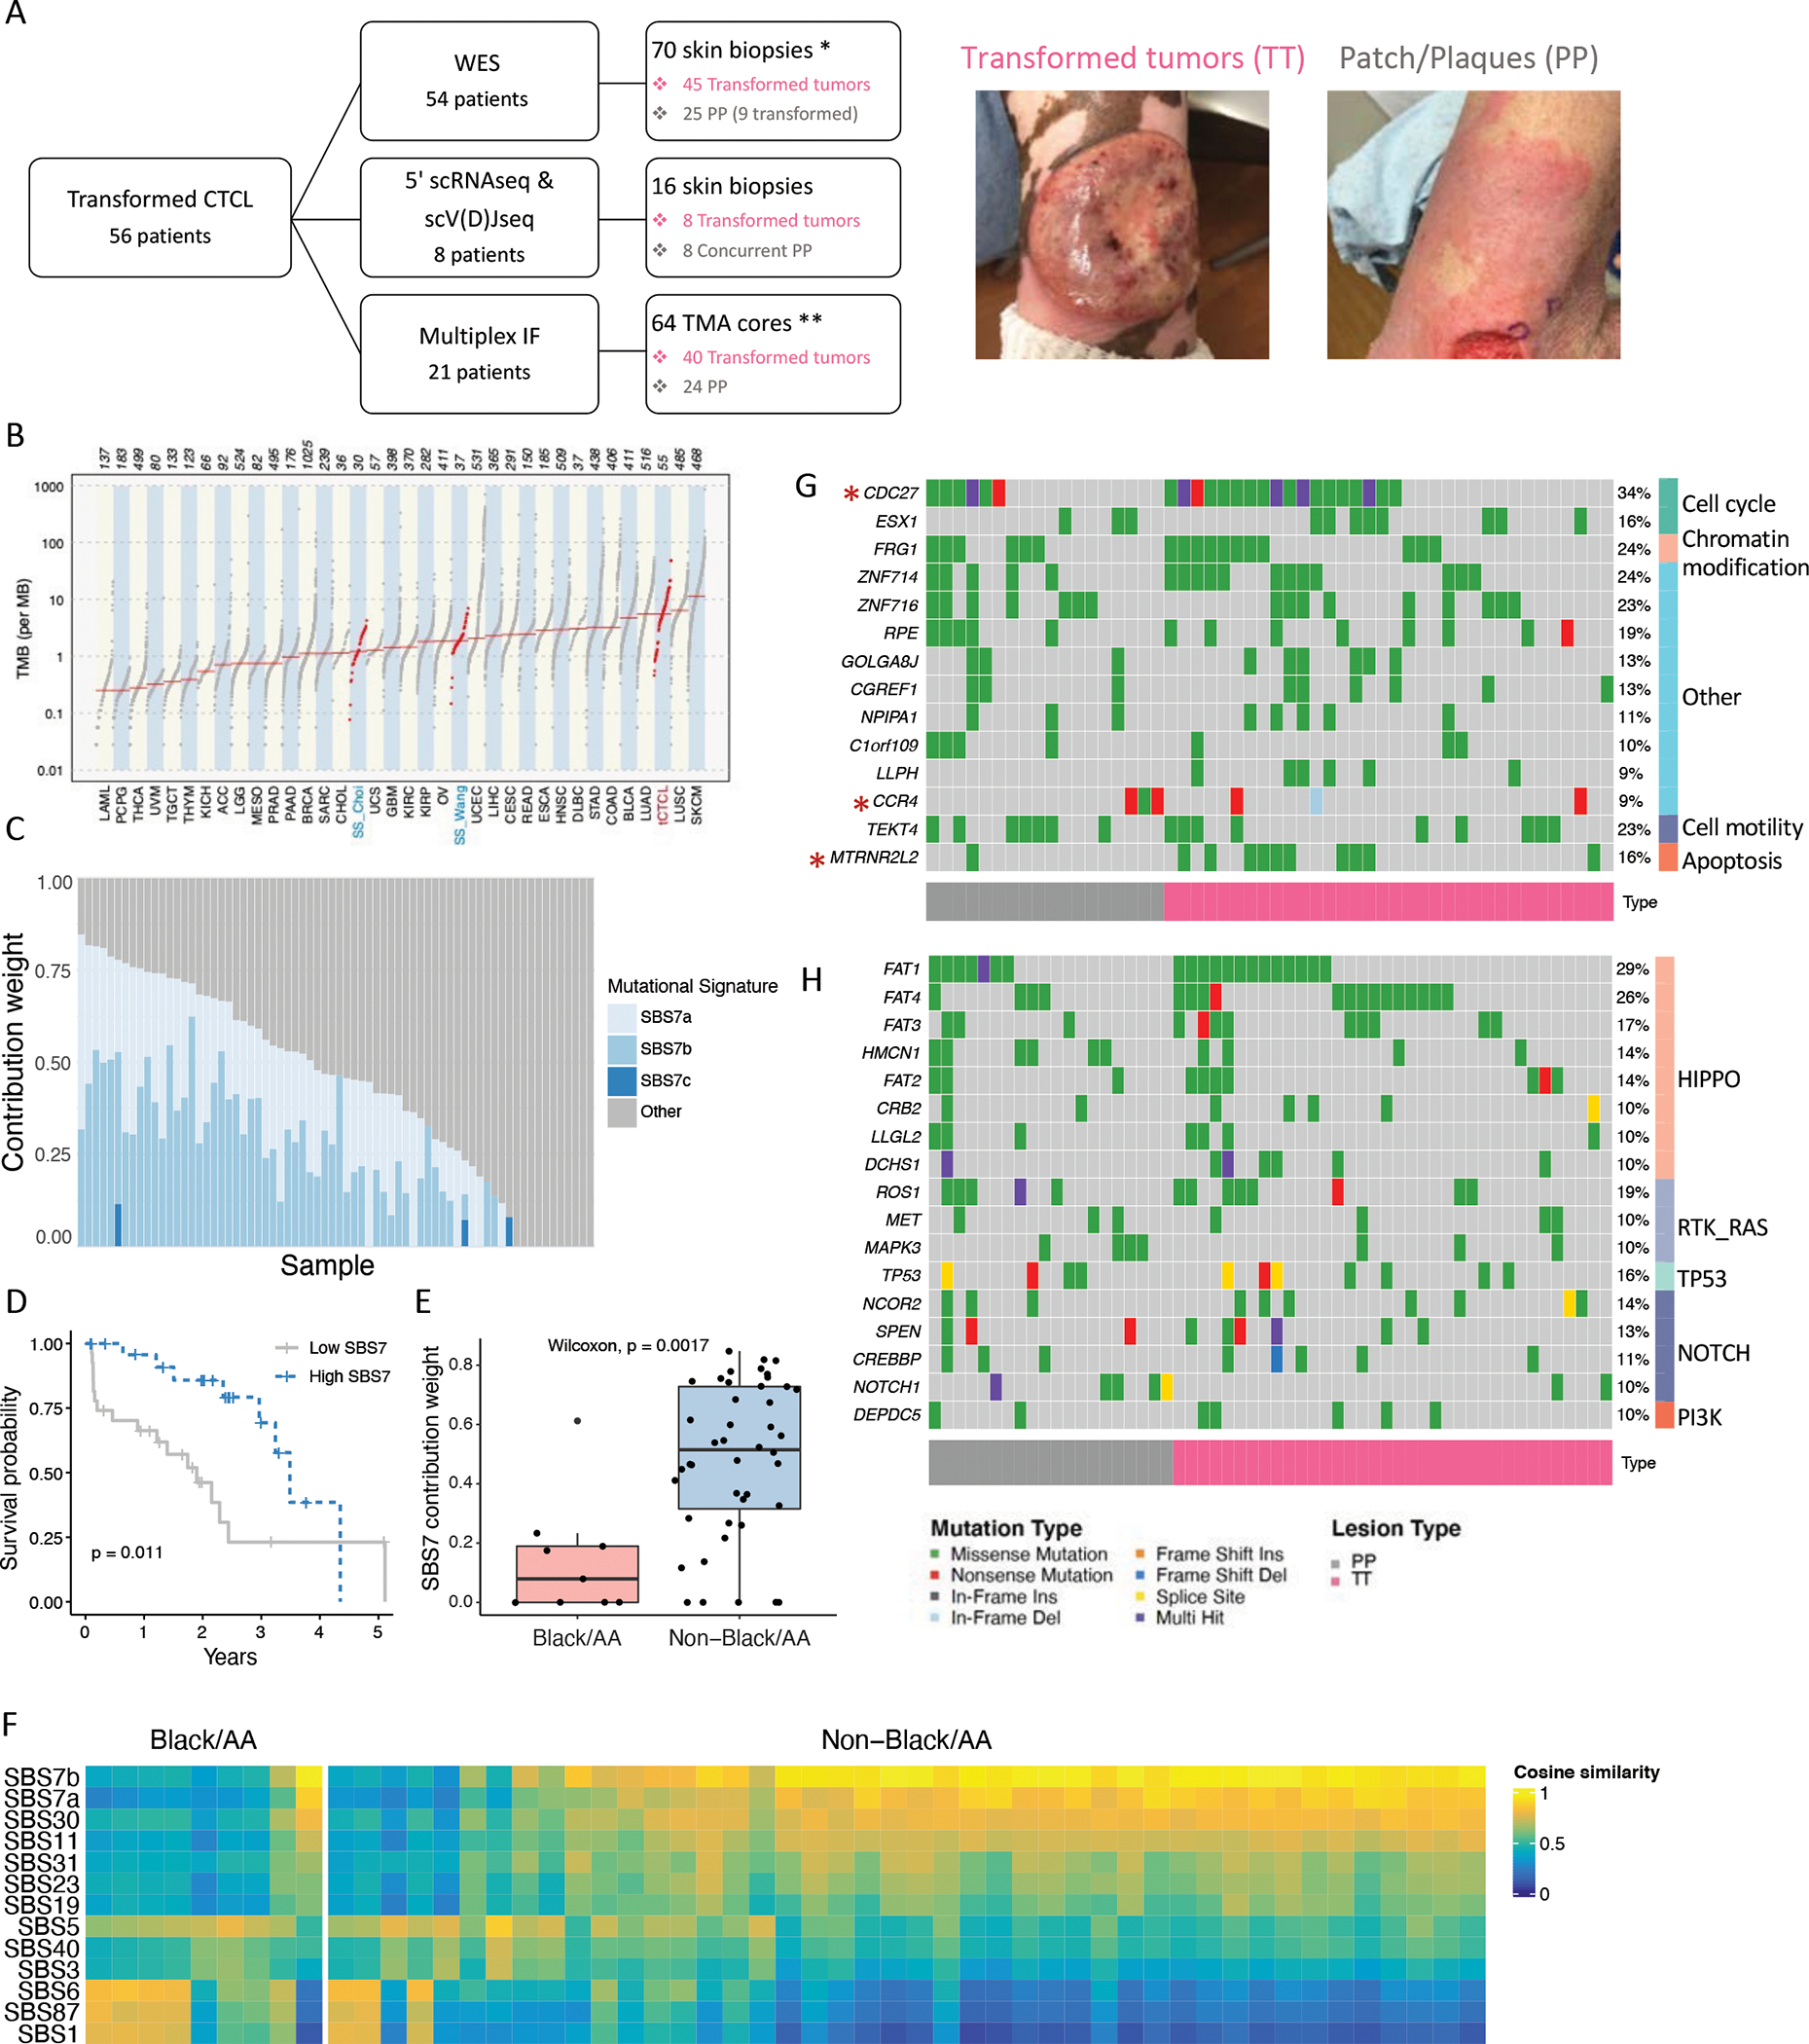
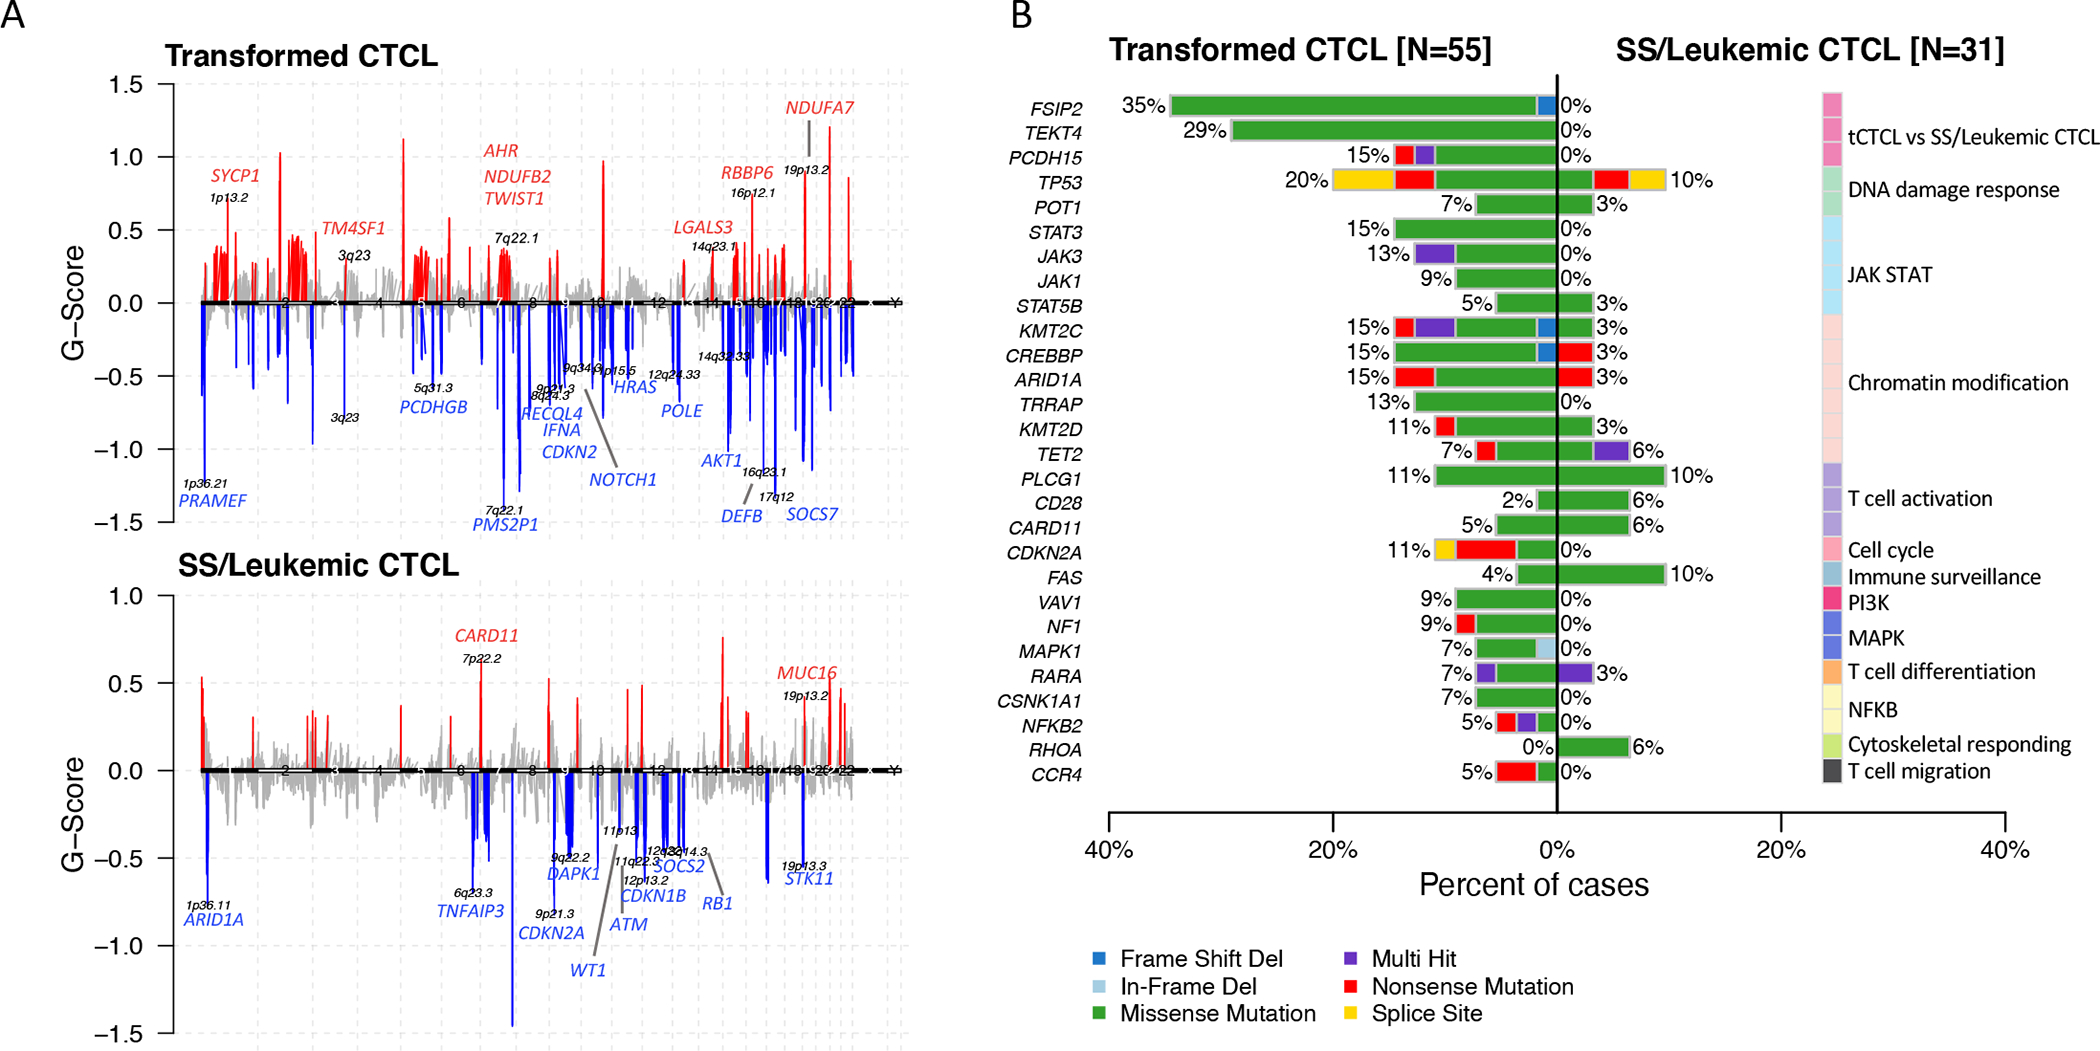
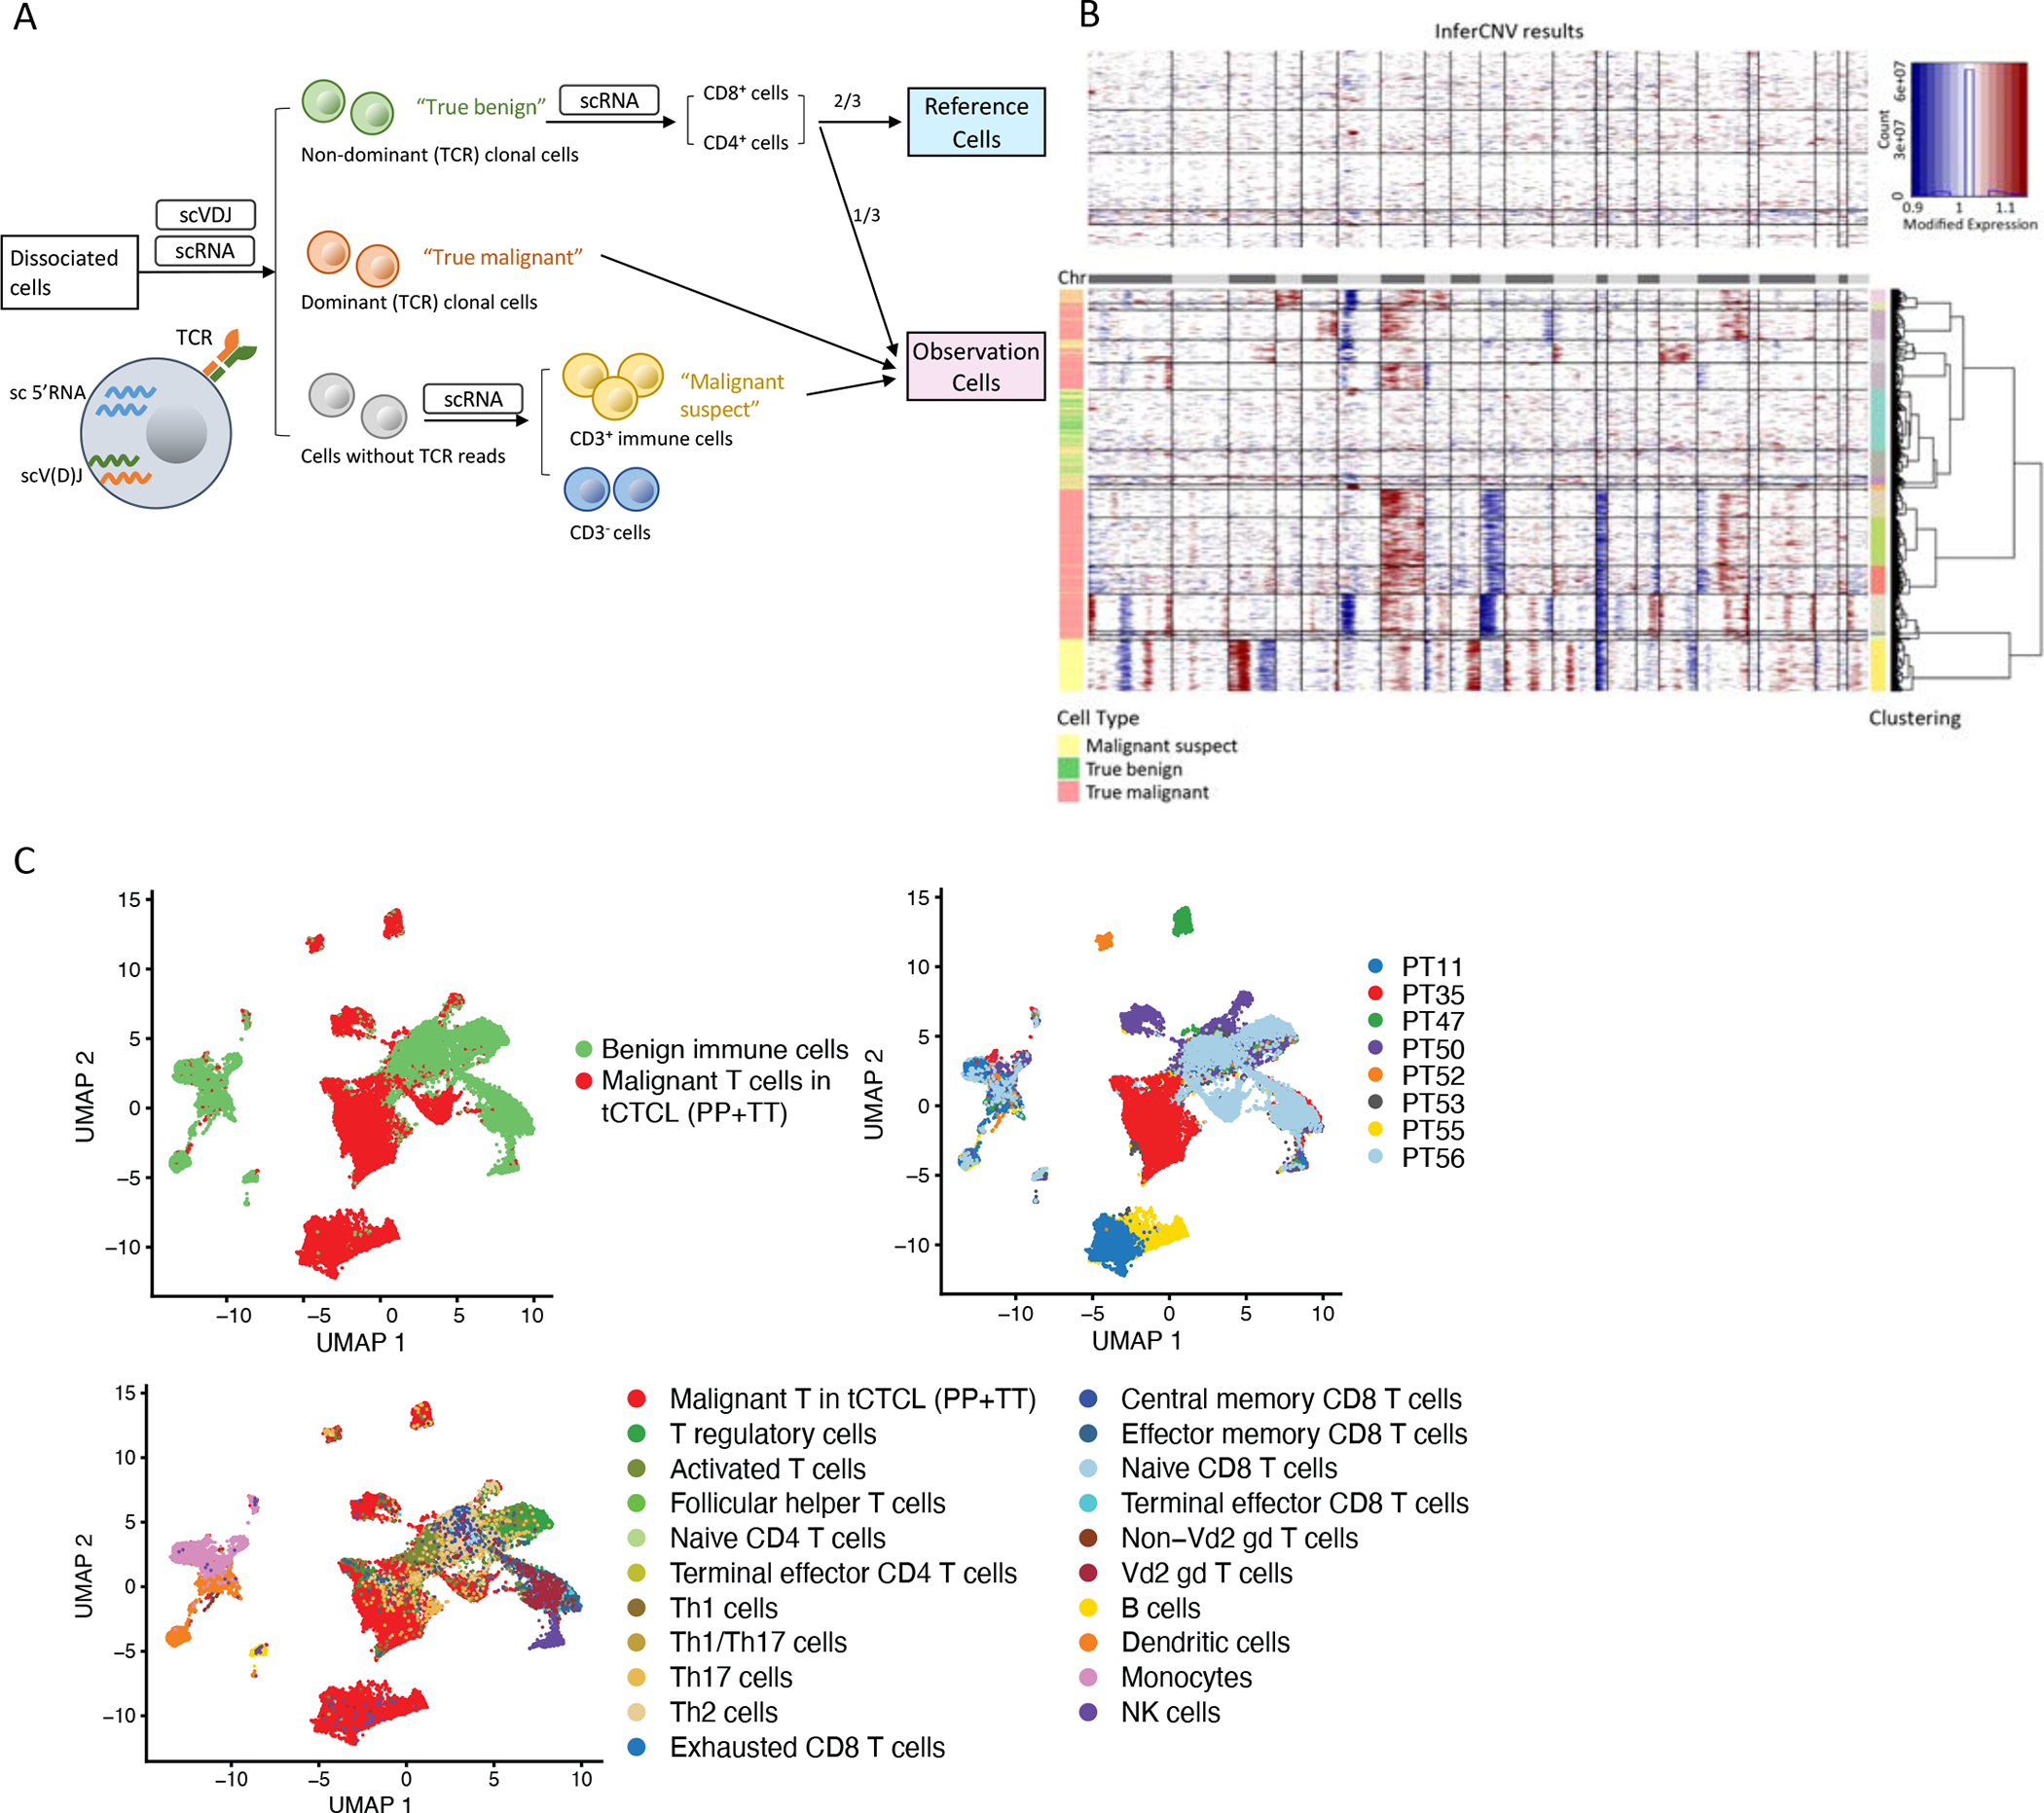
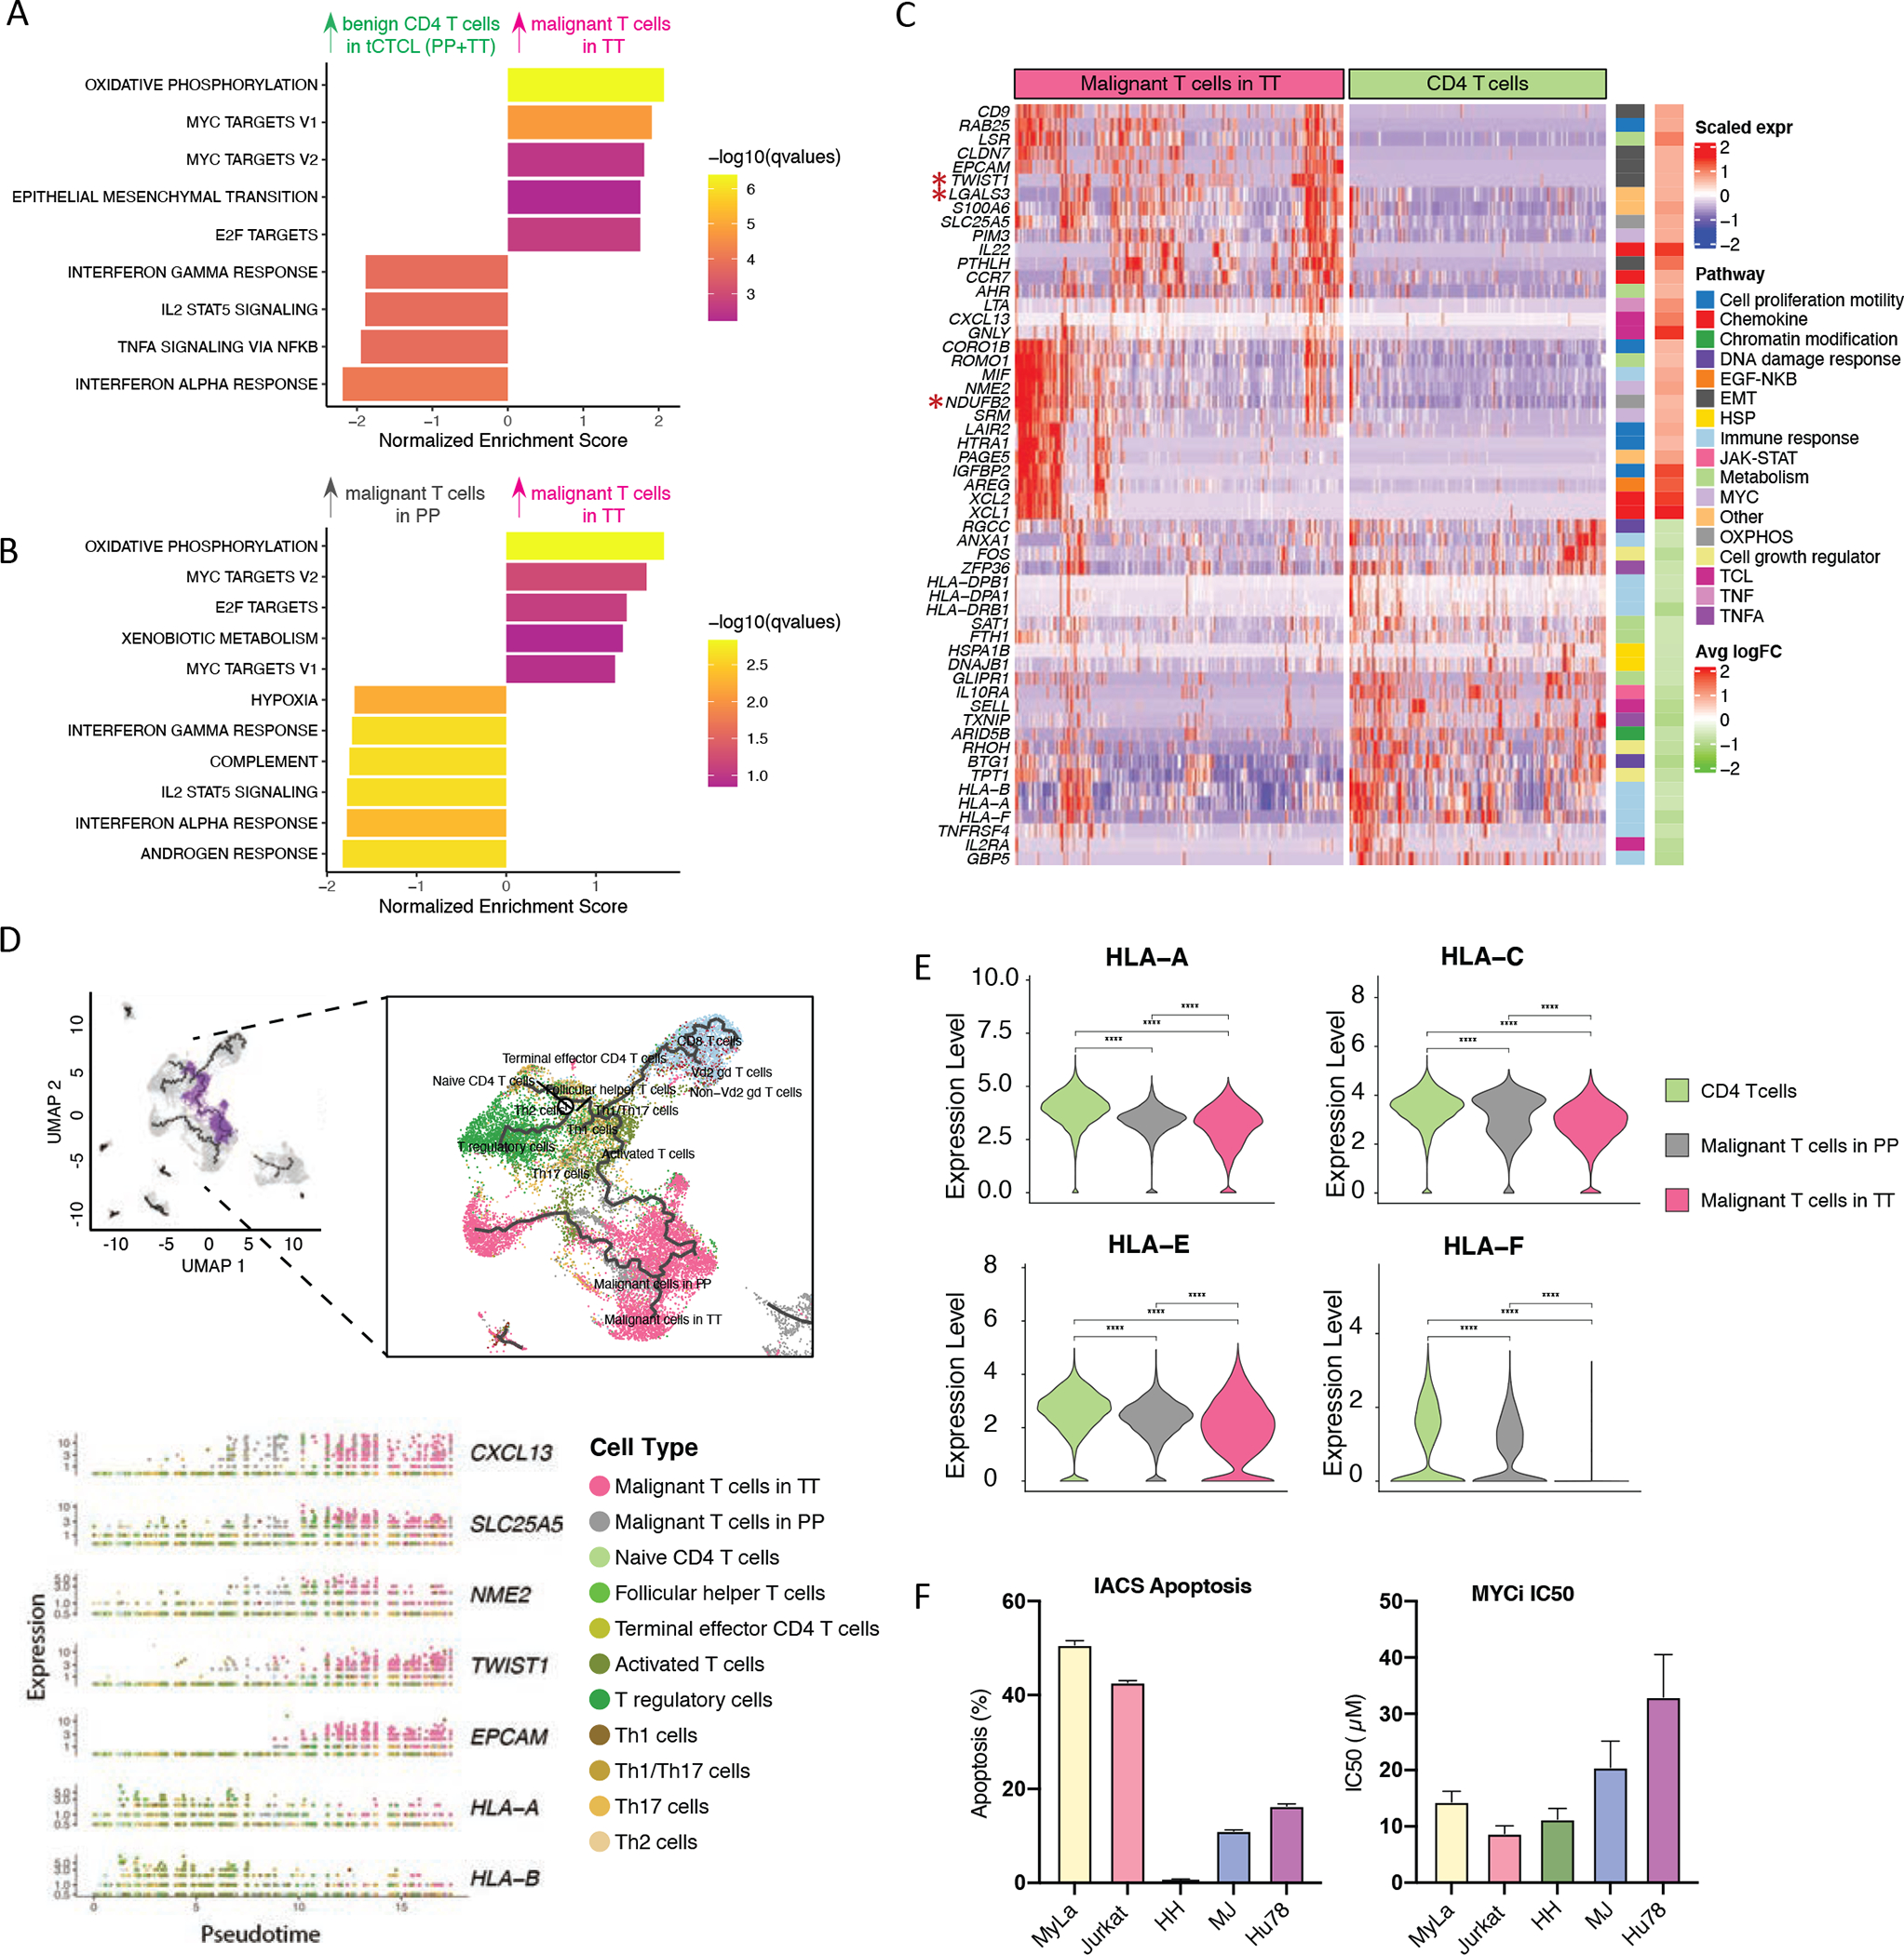
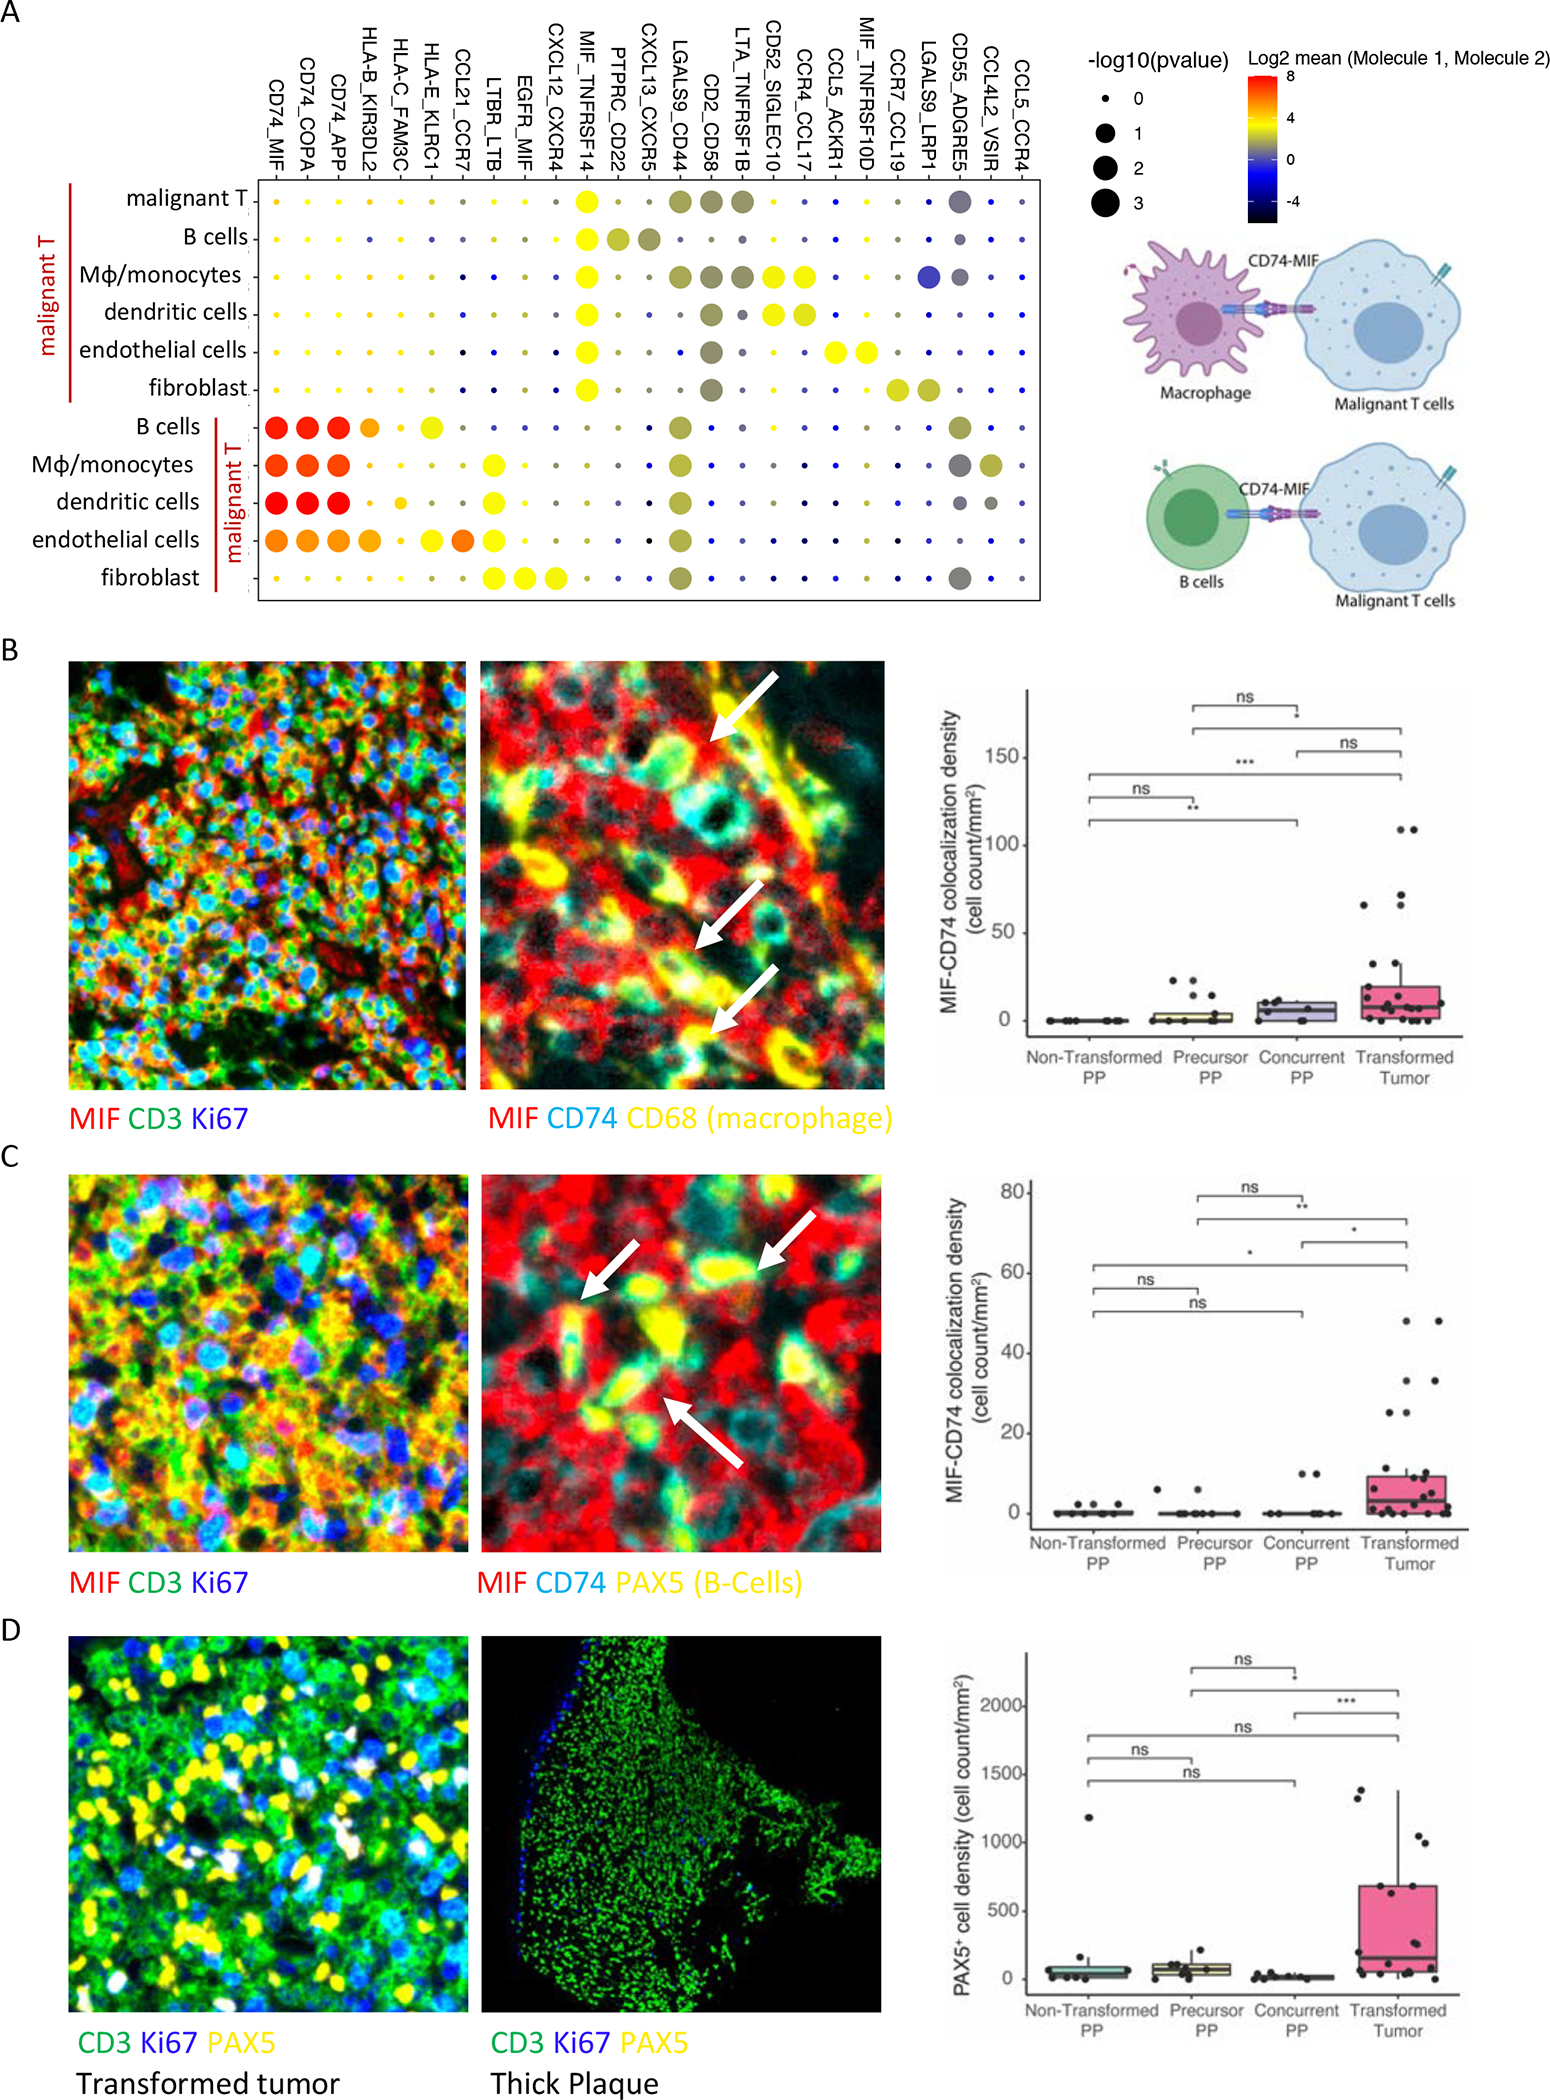
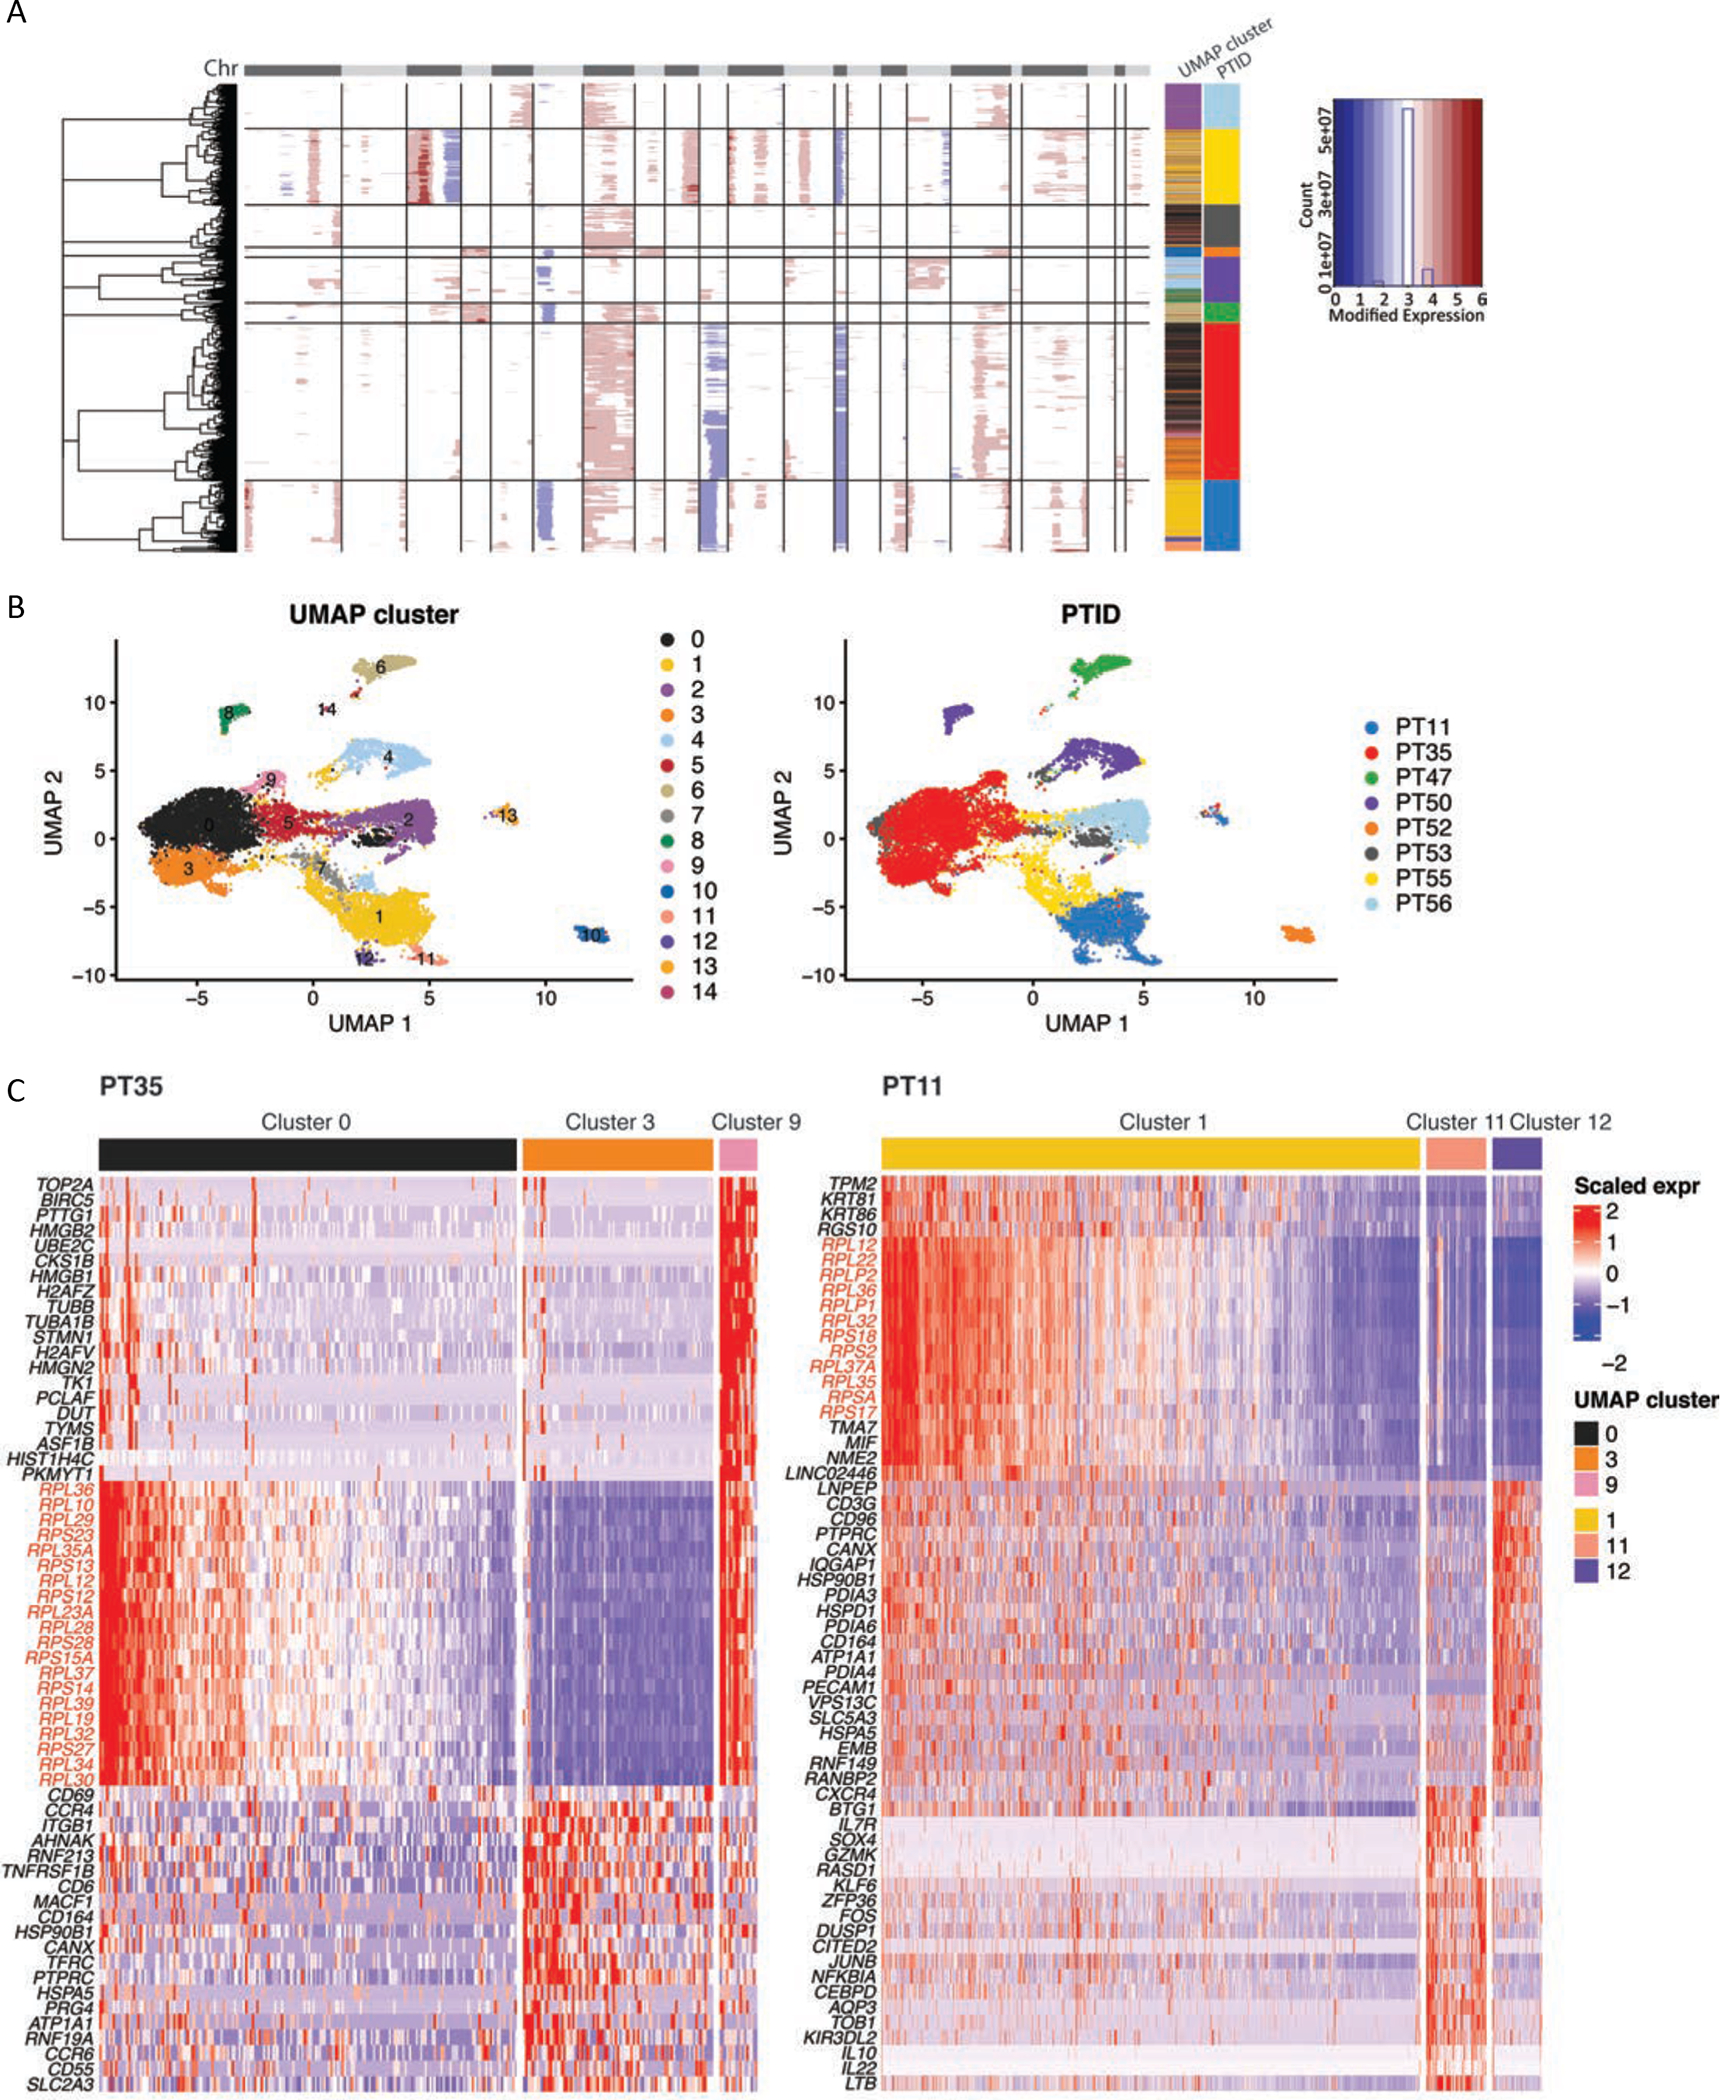
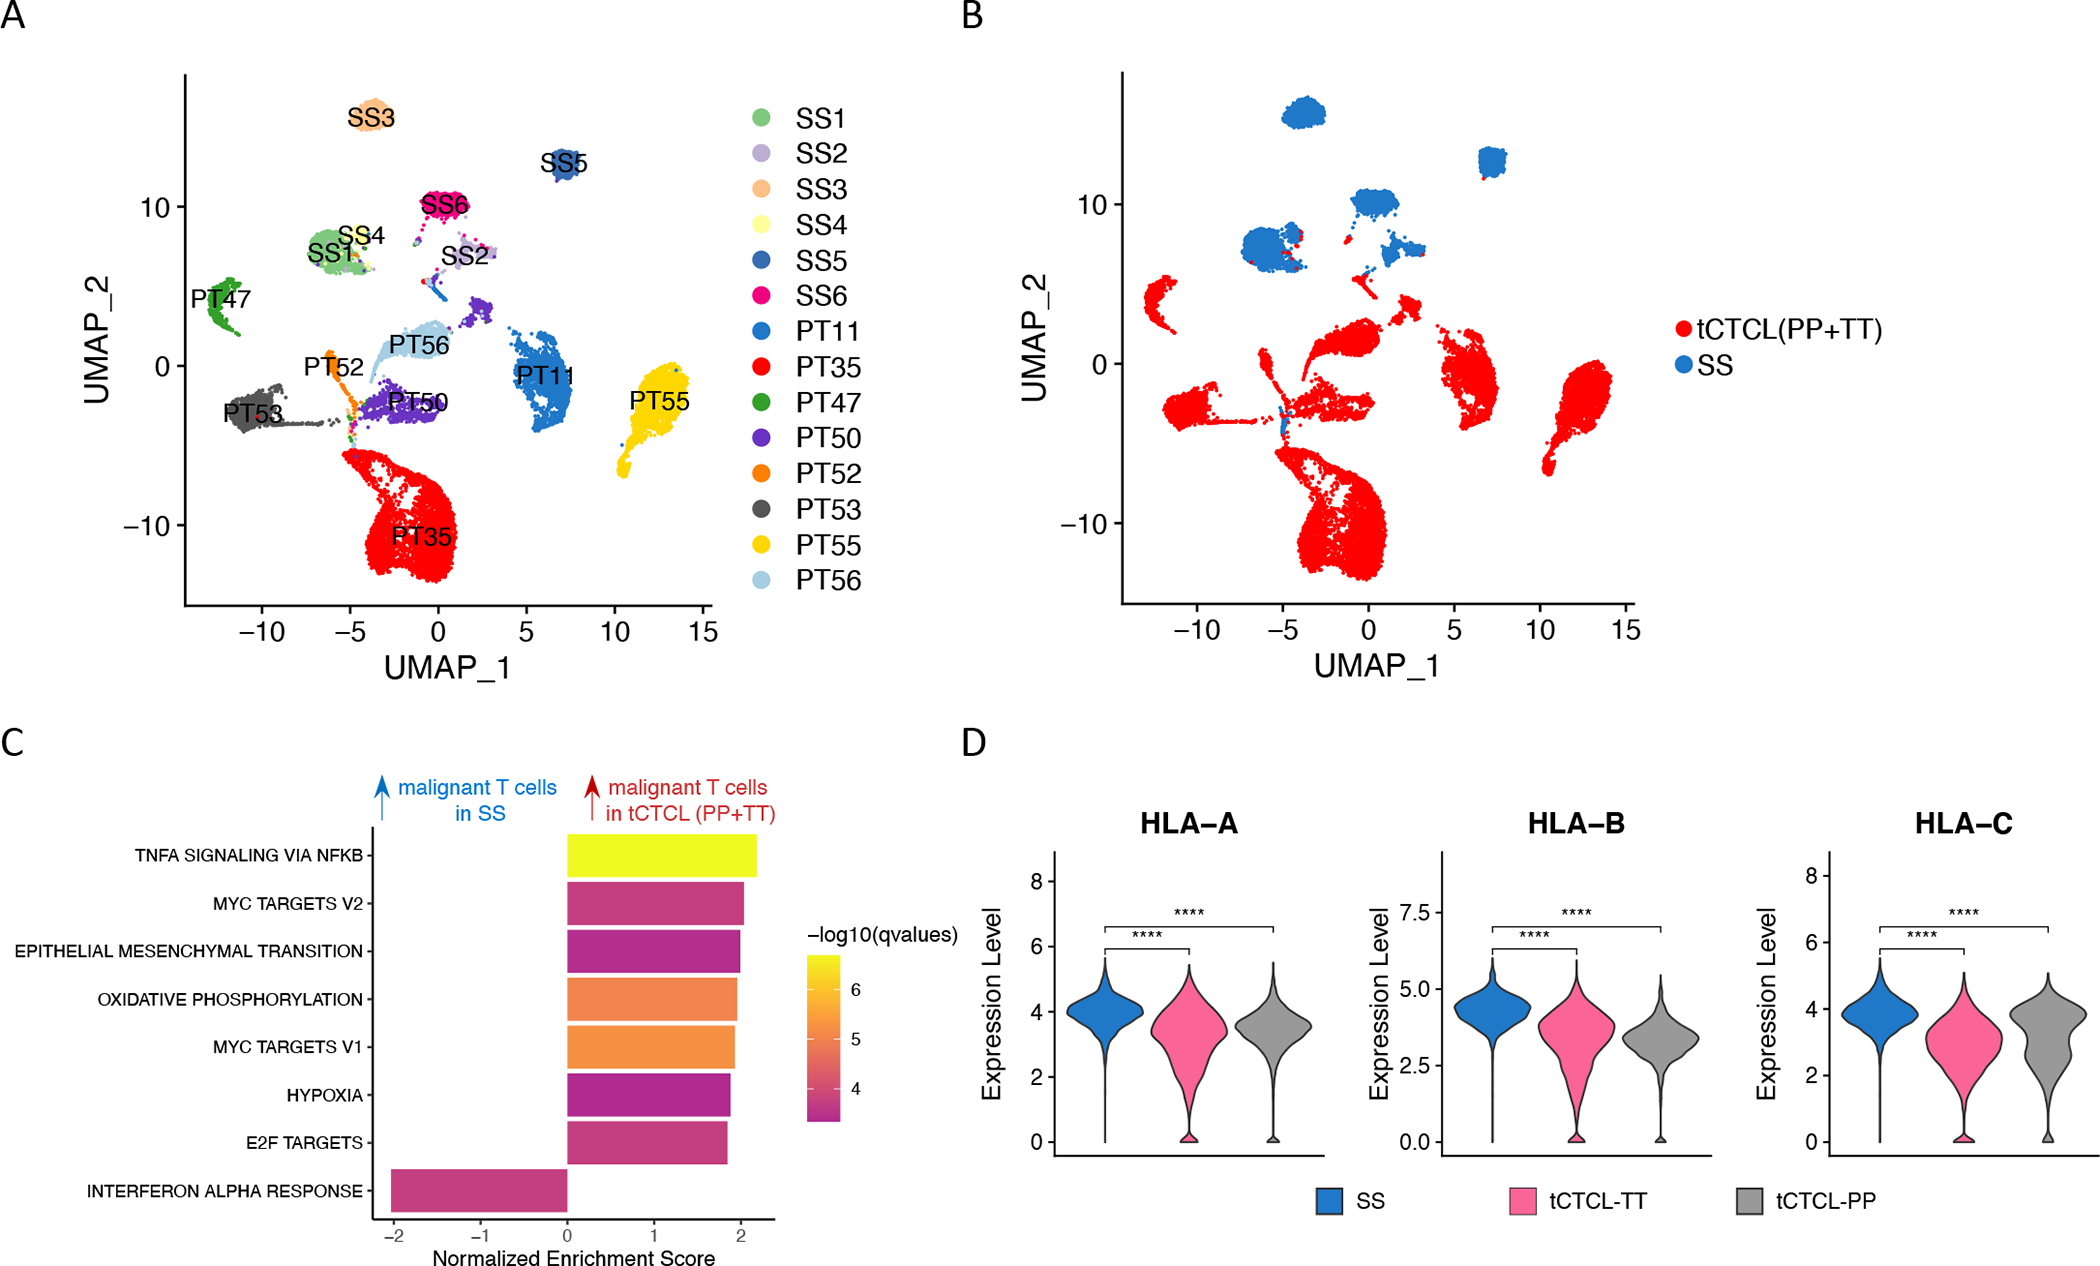
Abstract: Cutaneous T-cell lymphoma (CTCL) is a rare cancer of skin-homing T cells. A subgroup of patients develops large cell transformation with rapid progression to an aggressive lymphoma. Here, we investigated the transformed CTCL (tCTCL) tumor ecosystem using integrative multiomics spanning whole-exome sequencing (WES), single-cell RNA sequencing, and immune profiling in a unique cohort of 56 patients. WES of 70 skin biopsies showed high tumor mutation burden, UV signatures that are prognostic for survival, exome-based driver events, and most recurrently mutated pathways in tCTCL. Single-cell profiling of 16 tCTCL skin biopsies identified a core oncogenic program with metabolic reprogramming toward oxidative phosphorylation (OXPHOS), cellular plasticity, upregulation of MYC and E2F activities, and downregulation of MHC I suggestive of immune escape. Pharmacologic perturbation using OXPHOS and MYC inhibitors demonstrated potent antitumor activities, whereas immune profiling provided in situ evidence of intercellular communications between malignant T cells expressing macrophage migration inhibitory factor and macrophages and B cells expressing CD74.

Significance: Our study contributes a key resource to the community with the largest collection of tCTCL biopsies that are difficult to obtain. The multiomics data herein provide the first comprehensive compendium of genomic alterations in tCTCL and identify potential prognostic signatures and novel therapeutic targets for an incurable T-cell lymphoma. This article is highlighted in the In This Issue feature, p. 1171.


Conflict of interest statement

Conflicts of interest disclosures

L.S.V. or her institution received research support from Helsinn, Eisai Co., Soligenix, Kyowa Kirin Inc., Innate Pharma, and Elorac Inc. for CTCL studies. L.S.V. is a consultant and speaker for Kyowa Kirin Inc. and Helsinn. L.S. is advisory board member of Kyowa Kirin and consultant at Dren-Bio. S.W. is advisory board member and KOL for Kyowa Kirin.

Figures

Figure 1.
Figure 1.. The genomic landscape of transformed CTCL.
A. Flow diagram showing the tCTCL patient cohort (n= 56 patients with biopsy-proven tCTCL, including 53 transformed MF and 3 SS/overlap MF-SS with transformed tumors in skin) and correlative biospecimen studies. WES (n=54 tCTCL patients, 70 FFPE skin biopsies): 45 patients with TT, 25 patients with PP (of which 9 are transformed PP). *n=17 patients had matched transformed tumor and PP (precursor or concurrent PP; Methods). Simultaneous 5’ single cell RNAseq and single cell V(D)Jseq (n=8 tCTCL patients, each with concurrent TT and PP). Multiplex IF immune profiling by Vectra (n=21 tCTCL patients, 64 TMA cores; **n=16 patients with matched TT and PP (Methods). Clinical photographs of TT (left; PT11) and extensive patch/plaque lesions (right). B. Tumor mutation burden per MB of 33 TCGA cancer types and tCTCL, SS-Choi and SS-Wang cohorts (red). Sample size annotated at top. C. Plot represent weighted contribution of COSMIC v3.2 mutational signatures SBS7a, SBS7b, SBS7c and others in each tissue sample using deconstructSigs(38) (n=70 samples). D. Overall survival probability of tCTCL patients classified according to high versus low SBS7 mutation signature (by sum of weighted contribution from SBS7a-d) and onset of LCT to time of death or last follow up. E. Weighted contribution of SBS7a-d mutation signatures in Black/AA versus non-Black/AA patients. F. Heatmap of cosine similarities between the mutational profile of each sample and COSMIC v3.2 mutational signature in Black/AA vs non-Black/AA patients, ranked by SBS7a-d (complete COSMIC v3.2 signatures in Supplementary Fig. S3B). G, H. Oncoplot of predicted driver genes by dNdScv and MutsigCV (G) and most recurrently mutated pathway genes (H) in tCTCL (n=70 samples). Each column represents a patient tumor sample. Somatic mutations, including missense (green), nonsense (red), in frame insertion (dark grey) and deletion (light blue), frame shift insertion (orange) and deletion (blue), splice site (yellow), multi hit (purple) and genes implicated in leukemia and lymphoma by manual curation (red asterisk) are depicted. TT (magenta), PP (gray). Recurrent mutations in >10% of the samples are depicted (full mutation list in Supplemental Table S5 and S6). The predicted driver genes belong to five groups: cell cycle, chromatin modification, cell motility, apoptosis, genes implicated in leukemia/lymphomagenesis (*asterisk) and other undefined (G). Most recurrently mutated pathways are Hippo, Notch, RAS-RTK pathways and p53 (H; Supplementary Table S6).
Figure 2.
Figure 2.. tCTCL exhibits distinct genomic gains and losses from those of SS/leukemic CTCL.
A. Composite plot of significant arm-level and focal SCNAs by WES, using GISTIC 2.0 to detect genes targeted by somatic copy-number alterations (SCNAs) that drive cancer growth. Transformed CTCL (tCTCL, top, n= 55 samples with matched germline). SS/leukemic CTCL36 (bottom, n=31 samples with matched germline). Each alteration is assigned a G-score (y-axis; frequency x amplitude). Amplifications (red, above the solid horizontal lines) and deletions (blue, below the solid horizontal lines) are plotted across the genome (x-axis). Select gene targets within the peak regions are depicted. Q-threshold= 0.25. B. Examination of 55 CTCL-associated genes reported in literature (mostly SS)19 and significantly differentially mutated genes in tCTCL (left, n=55 samples) vs SS/leukemic CTCL36 (right, n=31 samples) (p< 0.05 and q< 0.25). Depicted are select candidate genes involved in DNA damage response, JAK/STAT, chromatin modification, T-cell activation, cell cycle, immune surveillance, PI3K, MAPK, T-cell differentiation, NFKB, cytoskeletal responding, T-cell migration), and significantly differentially mutated genes from unbiased comparison between tCTCL and SS cohorts (full gene list in Supplementary Table S8).
Figure 3.
Figure 3.. Dissecting the transformed CTCL TIME at single-cell resolution.
A. Single-cell profiling analytic workflow. 16 fresh skin biopsies were collected from 8 patients with CD4+ tCTCL (paired TT and PP lesions) for complementary 5’ scRNAseq and scV(D)Jseq. Single-cell V(D)J seq (10× chromium) detects the precise TCR α- and β-chain combination that defines each T-cell’s TCR clonotype. “True malignant” cells (red) = cells with dominant TCR clonotypes, while “True benign” cells (green) = cells with non-dominant/polyclonal TCR clonotypes (Supplementary Table S9). B. Malignant cells are further identified by inferred large-scale CNAs (inferCNV). The CNAs (red, amplifications; blue, deletions) are shown along the chromosomes for each cell. Two-thirds (2/3) of randomly selected non-dominant TCR/polyclonal CD4+ or CD8+ T-cells were input as the benign “Reference cells”. For the inferCNV observation group, the remaining 1/3 of “True benign” cells were “spiked in”, along with all clonal “Tue malignant” cells, and “Cells without TCR reads” (grey) that are positive for CD3 (i.e., the “Malignant suspect” cells, yellow) as the input cells. In the tCTCL TIME, “True malignant” cells by TCR clonality show malignant CNV patterns, while “True benign” cells show CNV neutral patterns. C. Uniform manifold approximation and projection (UMAP) of single-cell profile of 27,055 immune cells (dots), colored by malignant cell status (top left panel), with clear separation of malignant T-cells (red) from benign immune cell (green) clusters, patient ID (top right panel), and all malignant T-cells and benign immune cell types annotated in the TIME (bottom panel) (Supplementary Methods).
Figure 4.
Figure 4.. Malignant T-cell oncogenic program in tCTCL and pharmacologic inhibition of the OXPHOS and MYC in vitro.
A. Gene set enrichment analysis (GSEA) comparing malignant T-cells in TT to benign CD4 T-cells showed significant enrichment of genes in OXPHOS, MYC, EMT (cellular plasticity/stemness) and E2F target pathways and down-regulation of IFN-γ, TNF-α, and IFN-α. The normalized enrichment score (NES, x-axis) reflects the extent of enrichment and allows comparison across gene sets. Listed pathways are ranked by their NES and colored by their significance. B. GSEA. Comparison of malignant T-cells in TT to malignant T-cells in PP shows upregulation of genes in OXPHOS, MYC and E2F target pathways and down-regulation of IFN-γ and IFN -α pathways from PP to TT. C. Malignant T-cell oncogenic program DEGs. Scaled expression of select genes from the 55-genes tCTCL malignant T-cell oncogenic program (y-axis, rows, full list in Supplementary Table S12) across the profiled cells (columns), malignant T-cells in TT (magenta) and benign CD4+ T-cells (green). Color bars to right denote significantly enriched pathways. Significant DEGs were filtered with a q value < 0.05 and an absolute value of fold change (FC) > 2 or <0.5 (Methods). D. Trajectories of the tCTCL TIME constituents in pseudotime by Monocle 3. UMAP for dimension reduction and visualization, including all cells previously annotated in Fig. 3C. Naïve CD4+ T cells in the graphical interface was designated as the root node, and the cellular trajectories in pseudotime were learned using the default parameters of Monocle 3 (learn_graph function). The learned trajectories reveal mono-directionality from benign T-cells to malignant T-cells in PP (grey) to malignant T-cells in TT (magenta) (right panel). A branch of the trajectory originating from naïve CD4+ T cells to malignant T cells was selected (choose_graph_segments function, left panel, purple branch), and the kinetics of the 55-gene malignant T-cell oncogenic program was plotted along pseudotime with select genes shown in the bottom panel (full list of genes in Supplementary Fig. S8; Supplementary Table S13). Cell types as annotated in the scRNAseq dataset are dotted in colors (e.g., malignant T-cells in PP – grey, malignant T-cells in TT - magenta). CXCL13 (chemokine), SLC25A5 (OXPHOS), NME2 (MYC) showed coordinated up-regulation from benign T-cells to malignant PP, while EPCAM and TWIST (EMT/cellular plasticity) showed accentuation of gene expression at the end of the trajectory in tumors. Downregulation of HLA-A and HLA-B (MHC-I) occurred early at the bifurcation from benign to malignant PP in pseudotime. E. Violin plots of distribution of HLA-A, C, E, F gene expression in malignant T-cells in TT (magenta), malignant T-cells in PP (gray) and benign CD4 T-cells (green). **** denotes p<0.001. F. T-cell lymphoma cell lines, Myla (MF), Jurkat (ATLL), HH (leukemic CTCL), MJ (ATLL) and Hu78 (SS). OXPHOS inhibitor (IACS-10759) apoptosis assay (left): indicated cell lines were seeded on 96-well plates and treated with 8 nM of IACS-010759 for 5 days. At day 5, cells were harvested and stained with Annexin V and PI following manufacture’s protocol (Biolegend Cat#640914). Annexin V+PI+ population was gated on Singlet population using FlowJo 10 software. The data was normalized to vehicle control. The error bars represent the mean ± s.e.m. n=8 (MyLa and Jurkat); n=4 (HH, MJ, Hu78). MYC inhibitor (MYCi975) cell proliferation assay (right). Indicated cell lines were seeded on 96-well plates and treated with different dose of MYCi975 for 5 days. At day 5, cells were incubated with MTS reagent following manufacture’s protocol (Promega Cat#G3580). Absorbance at OD490 nm was recorded and percentage of growth were normalized to vehicle control. Half maximal inhibitory concentration (IC50) was calculated based on curve fitting result using non-linear regression function of GraphPad Prism 8. The symbol represents the mean. The error bars represent the mean ± s.e.m. n=12 (MyLa and Jurkat); n=8 (HH, MJ, Hu78).
Figure 5.
Figure 5.. Cellular crosstalk between malignant T-cells and the tCTCL TIME highlights MIF-CD74 interactions.
A. Overview of the statistically significant receptor-ligand interactions between malignant T-cells and macrophage/monocytes, B-cells, dendritic cells, endothelial cells and fibroblasts by integrating CellPhoneDB v2.0, a cell-cell communication informatics pipeline, with the single-cell RNAseq dataset (left; potential receptor-ligand pairs between interacting cell types denoted at top). Significance of p-values are indicated by circle size (−log10 p-value, permutation test; Methods). Color indicates the log2 means of the receptor-ligand pairs between 2 interacting cell types. Scale is shown to the right. Schematic (right) representing predicted top-ranking predicted ligand-receptor interactions between MIF in malignant T-cells and CD74 in macrophages/monocytes and B-cells in the tCTCL TIME. B-C. MIF expression and MIF-CD74 co-localization by mIF immune profiling (80 core TMA). Lesion types: PP-NT (PP from non-transformed patients, n= 16 tissue cores), PP-P (precursor PP from tCTCL patients, n= 12 cores), PP-C (concurrent PP from tCTCL patients, n= 12 cores), Transformed tumors (n= 64 cores). Multi-layer TIFF images were exported from InForm (Akoya Biosciences) into HALO Image Analysis Platform (Indica Labs) for segmentation and quantitative analysis. B. MIF (red), CD74 (sky blue), CD3 (green), Ki67 (dark blue), CD68 (yellow). Malignant Cd4+ T-cell (Cd3+ CD8− Ki67 high). Macrophages (CD68+ cells). MIF in malignant T-cells (left panel), MIF in malignant T-cells co-localizes with CD74 in macrophages (white arrow, middle panel). Boxplot depicting MIF-CD74 colocalization density (y-axis, count per mm2) against each lesion type. C. MIF (red), CD74 (sky blue), CD3 (green), Ki67 (dark blue), PAX5 (yellow). Malignant CD4+ T-cell (CD3+ CD8− Ki67 high). B-cells (PAX5+ cells). MIF in malignant T-cells (left panel), MIF in malignant T-cells co-localizes with CD74 in B-cells (white arrow, middle panel). Boxplot demonstrating MIF-CD74 colocalization density (y-axis, cell count per mm2) against each lesion type. D. TT (left panel) with dense infiltration of B-cells (PAX5+, yellow) between malignant Cd4+ T-cells (CD3+ CD8− Ki67 high). A thick PP lesion from a non-transformed patient (middle panel) showing absence of PAX5+ B-cells in the TIME. Ki67 cells (dark blue) depict basal layer of the epidermis. Boxplot depicting B-cell density (y-axis, cell count per mm2) against each lesion type.
Figure 6.
Figure 6.. Dominant subclones in tCTCL show deregulation of ribosomal gene expression.
A. Identification of genetic subclones in malignant T-cells in each patient by partitioning hierarchical clustering trees (inferCNV, HMM subcluster mode, “qnorm” method). The CNAs (red, amplifications; blue, deletions) are shown along the chromosomes for each cell. Color bars to the right denote matched UMAP cluster annotation, patient ID and scaled expression. B. UMAP plots of all malignant T-cells clustered by gene expression (left) and labeled by patient ID (right) reveal subclonal transcriptional heterogeneity in PT11 (clusters 1, 11, 12), PT 35 (clusters 0, 3, 9) and PT50 (clusters 4, 8) (Supplementary Table S17). UMAP clusters and patient IDs (PTID) are color coded to the right. C. DEG of the malignant T-cell subclusters in PT 35 (left) and PT11 (right) reveal dramatic upregulation of genes encoding ribosomal protein large and small subunits in the preponderant malignant T-cell subclones in these two patients with the worst clinical outcomes.
Figure 7.
Figure 7.. Cutaneous tCTCL shows distinct malignant T-cell oncogenic program from SS
A. UMAP of malignant T-cells from 6 SS patients (Herrera cohort, patients SS1 to SS6) and malignant T-cells from 8 tCTCL patients in the current study (PT11, 35, 47, 50, 52, 53, 55, 56; each with PP and TT lesions). B. UMAP of malignant T-cells from tCTCL patients (PP+TT, red) and SS patients (blue). C. GSEA comparing malignant T-cells in tCTCL (PP+TT) vs malignant T-cells in SS shows significant upregulation of genes in TNF-a, MYC, EMT, OXPHOS and E2F target pathways and downregulation of genes in the IFN-a pathway. Normalized enrichment score (NES, x-axis). Listed pathways are ranked by their NES and colored by their significance. D. Violin plots of distribution of HLA-A, B, C gene expression (y-axis, normalized expression counts in a log scale) in malignant T-cells in SS (blue), malignant T-cells in TT (magenta) and malignant T-cells in PP (gray). **** denotes p<0.001.

References

    1. Nath SK, Yu JB, Wilson LD. Poorer prognosis of African-American patients with mycosis fungoides: an analysis of the SEER dataset, 1988 to 2008. Clin Lymphoma Myeloma Leuk 2014;14(5):419–23 doi 10.1016/j.clml.2013.12.018. - DOI - PMC - PubMed
    1. Su C, Nguyen KA, Bai HX, Cao Y, Tao Y, Xiao R, et al. Racial disparity in mycosis fungoides: An analysis of 4495 cases from the US National Cancer Database. J Am Acad Dermatol 2017;77(3):497–502 e2 doi 10.1016/j.jaad.2017.04.1137. - DOI - PubMed
    1. Willemze R, Cerroni L, Kempf W, Berti E, Facchetti F, Swerdlow SH, et al. The 2018 update of the WHO-EORTC classification for primary cutaneous lymphomas. Blood 2019;133(16):1703–14 doi 10.1182/blood-2018-11-881268. - DOI - PMC - PubMed
    1. Scarisbrick JJ, Prince HM, Vermeer MH, Quaglino P, Horwitz S, Porcu P, et al. Cutaneous Lymphoma International Consortium Study of Outcome in Advanced Stages of Mycosis Fungoides and Sezary Syndrome: Effect of Specific Prognostic Markers on Survival and Development of a Prognostic Model. J Clin Oncol 2015;33(32):3766–73 doi 10.1200/JCO.2015.61.7142. - DOI - PMC - PubMed
    1. Jawed SI, Myskowski PL, Horwitz S, Moskowitz A, Querfeld C. Primary cutaneous T-cell lymphoma (mycosis fungoides and Sezary syndrome): part I. Diagnosis: clinical and histopathologic features and new molecular and biologic markers. J Am Acad Dermatol 2014;70(2):205 e1–16; quiz 21–2 doi 10.1016/j.jaad.2013.07.049. - DOI - PubMed

Publication types