. 2022 Mar 1;3(2):154-169.
doi: 10.1158/2643-3230.BCD-21-0098.

Identification and Targeting of the Developmental Blockade in Extranodal Natural Killer/T-cell Lymphoma

Affiliations

Identification and Targeting of the Developmental Blockade in Extranodal Natural Killer/T-cell Lymphoma

Bethany L Mundy-Bosse et al. Blood Cancer Discov. .

Abstract

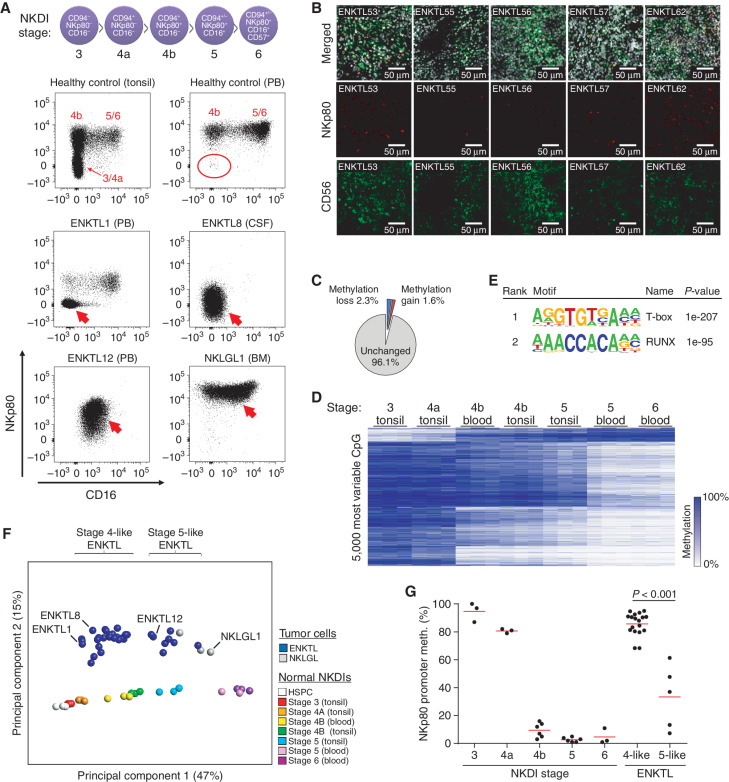
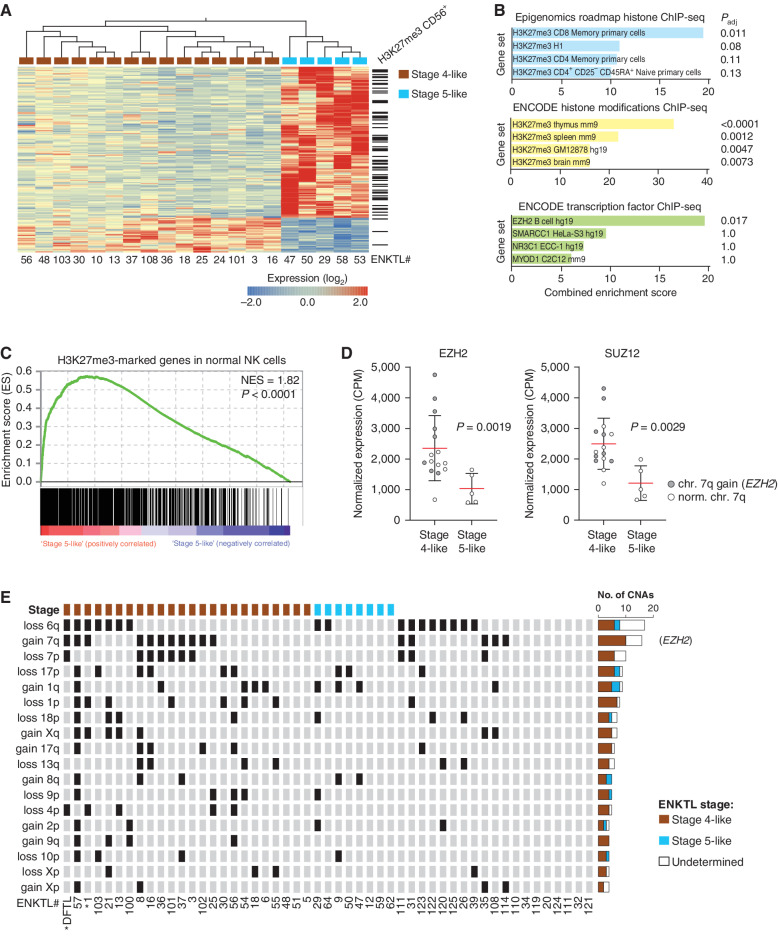
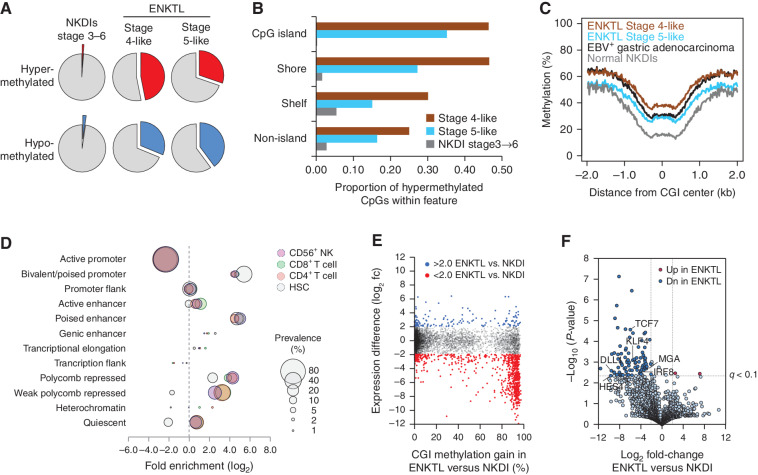
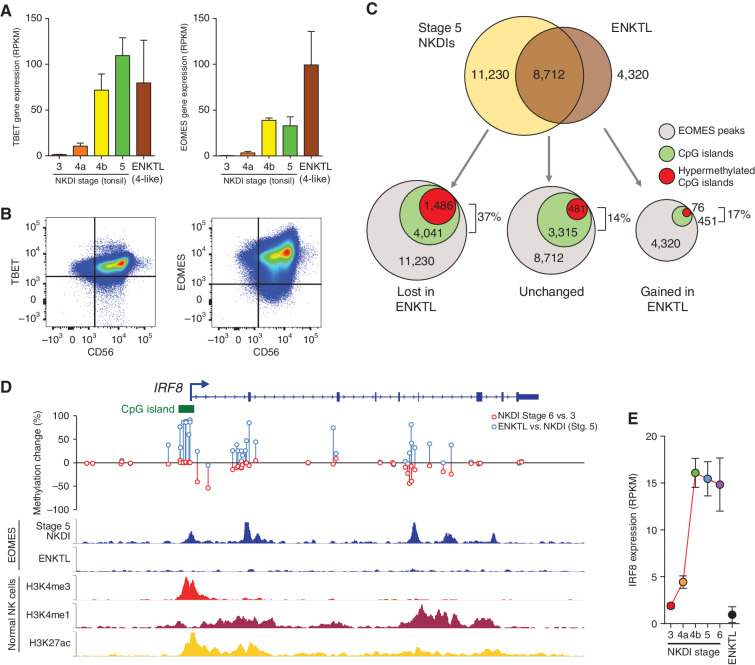
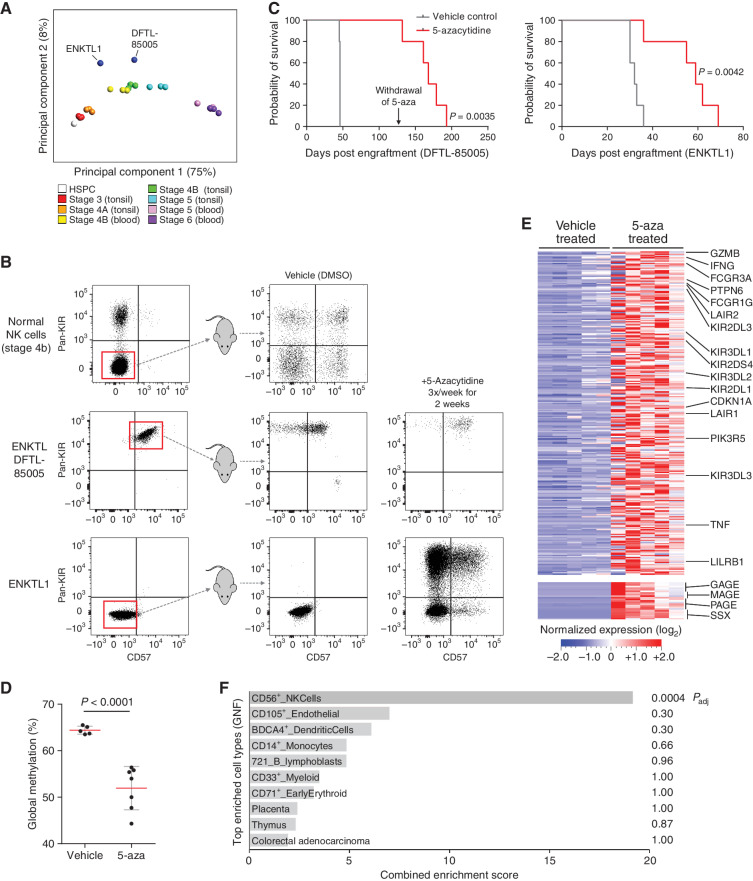
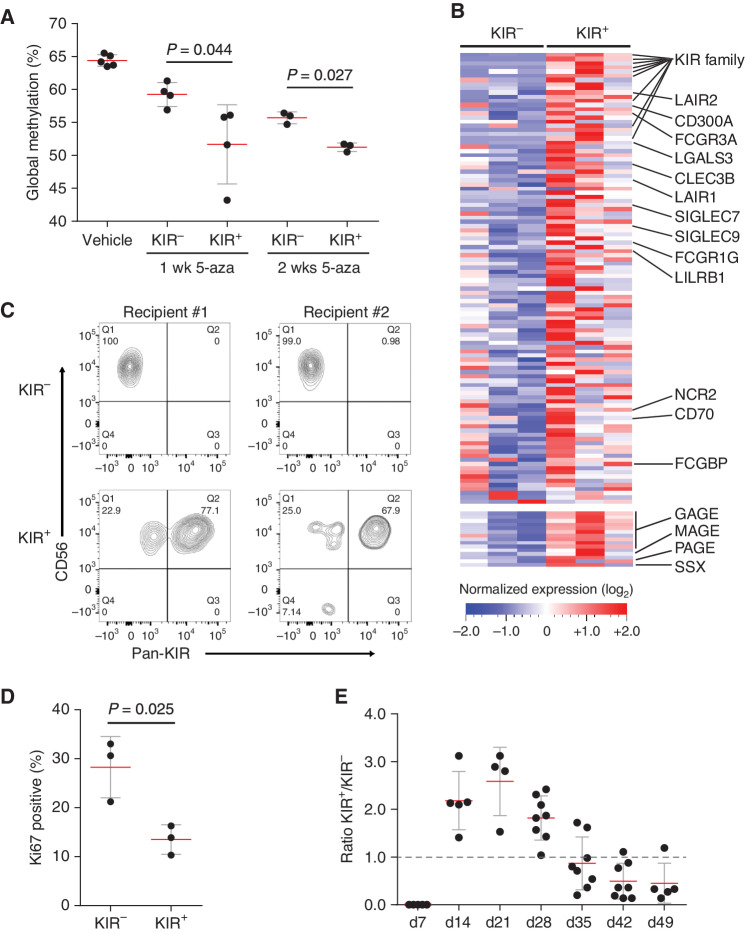
Extranodal natural killer/T-cell lymphoma (ENKTL) is an aggressive, rare lymphoma of natural killer (NK) cell origin with poor clinical outcomes. Here we used phenotypic and molecular profiling, including epigenetic analyses, to investigate how ENKTL ontogeny relates to normal NK-cell development. We demonstrate that neoplastic NK cells are stably, but reversibly, arrested at earlier stages of NK-cell maturation. Genes downregulated in the most epigenetic immature tumors were associated with polycomb silencing along with genomic gain and overexpression of EZH2. ENKTL cells exhibited genome-wide DNA hypermethylation. Tumor-specific DNA methylation gains were associated with polycomb-marked regions, involving extensive gene silencing and loss of transcription factor binding. To investigate therapeutic targeting, we treated novel patient-derived xenograft (PDX) models of ENKTL with the DNA hypomethylating agent, 5-azacytidine. Treatment led to reexpression of NK-cell developmental genes, phenotypic NK-cell differentiation, and prolongation of survival. These studies lay the foundation for epigenetic-directed therapy in ENKTL.

Significance: Through epigenetic and transcriptomic analyses of ENKTL, a rare, aggressive malignancy, along with normal NK-cell developmental intermediates, we identified that extreme DNA hypermethylation targets genes required for NK-cell development. Disrupting this epigenetic blockade in novel PDX models led to ENKTL differentiation and improved survival. This article is highlighted in the In This Issue feature, p. 85.


Figures

Figure 1. Relationship of ENKTL to normal NK-cell development using immunophenotyping and genome-wide DNA methylation patterns. A, Top indicates the cell surface markers delineating NKDI stages. Below are flow cytometry analyses showing NKDI stages in healthy adult tonsil and PB after gating on lineage-negative, CD56+ cells. Stage 3/4a NKDIs are not observed in blood from healthy donors (red oval). Patients with ENKTL or NKLGL derived from PB, BM, or CSF are displayed using the same gaiting strategy. ENKTL1 and 8 displayed atypical CD16−NKp80− NK-cell populations reminiscent of stage 4a NK-cell precursors (thick red arrows). ENKTL12 displays an atypical NKp80+CD16Dim population more reminiscent of stage 5 NKDIs. NKLGL is stage 5 like. All plots were gated on lineage−CD56+ cells. B, Immunofluorescent confocal microscopy images of ENKTL tumors stained for NKp80 (red) and CD56 (green) then merged with DAPI (white, top). Despite broad positivity for CD56, only ENKTL62 showed consistent NKp80 staining. C, Total number of CpGs displaying altered methylation between stage 3 and stage 6 of NK-cell development. D, Heat map showing the 5,000 most variable CpGs across NKDI samples. E, Most enriched DNA sequence motifs proximal (±100 bp) to hypomethylated CpGs during NK-cell development (stage 3 to 6 NKDIs). F, Principal component analysis of NKDIs and ENKTLs using the 5,000 most-variable CpGs among NKDIs. ENKTL samples in A are indicated. G, NKp80 (KLRF1) promoter methylation levels assessed by targeted MassARRAY analysis in NKDI stages and ENKTL separated into stage 4- and 5-like subgroups. CpGs in the vicinity of the NKp80 promoter were averaged for individual NKDI and ENKTL samples.
Figure 1.
Relationship of ENKTL to normal NK-cell development using immunophenotyping and genome-wide DNA methylation patterns. A, Top indicates the cell surface markers delineating NKDI stages. Below are flow cytometry analyses showing NKDI stages in healthy adult tonsil and PB after gating on lineage-negative, CD56+ cells. Stage 3/4a NKDIs are not observed in blood from healthy donors (red oval). Patients with ENKTL or NKLGL derived from PB, BM, or CSF are displayed using the same gaiting strategy. ENKTL1 and 8 displayed atypical CD16NKp80 NK-cell populations reminiscent of stage 4a NK-cell precursors (thick red arrows). ENKTL12 displays an atypical NKp80+CD16Dim population more reminiscent of stage 5 NKDIs. NKLGL is stage 5 like. All plots were gated on lineageCD56+ cells. B, Immunofluorescent confocal microscopy images of ENKTL tumors stained for NKp80 (red) and CD56 (green) then merged with DAPI (white, top). Despite broad positivity for CD56, only ENKTL62 showed consistent NKp80 staining. C, Total number of CpGs displaying altered methylation between stage 3 and stage 6 of NK-cell development. D, Heat map showing the 5,000 most variable CpGs across NKDI samples. E, Most enriched DNA sequence motifs proximal (±100 bp) to hypomethylated CpGs during NK-cell development (stage 3 to 6 NKDIs). F, Principal component analysis of NKDIs and ENKTLs using the 5,000 most-variable CpGs among NKDIs. ENKTL samples in A are indicated. G, NKp80 (KLRF1) promoter methylation levels assessed by targeted MassARRAY analysis in NKDI stages and ENKTL separated into stage 4- and 5-like subgroups. CpGs in the vicinity of the NKp80 promoter were averaged for individual NKDI and ENKTL samples.
Figure 2. Gene repression in stage 4-like ENKTL involves polycomb repression. A, Heat map of the most differentially expressed genes between stage 4 and 5-like ENKTL (q < 0.05) assessed by RNA-seq of FFPE-derived material. Genes with H3K27me3 overlapping their transcriptional start sites in NK cells are indicated. B, Enrichment of differentially expressed genes from A in genesets identified from TF and histone modification ChIP-seq profiles from the Epigenomics Roadmap and ENCODE projects. C, Gene-set enrichment analysis showing the enrichment of differentially expressed genes from A in a custom gene set of H3K27me3-marked genes in normal NK cells. D, Expression of core polycomb repressor complex 2 genes in stage 4- and 5-like ENKTL. Error bars represent SD, significance assessed by Mann–Whitney test. E, Oncoprint displaying the locations of recurrent copy-number alterations in ≥3 patients separated by ENKTL methylation subgroup. Patient samples with undetermined methylation subtype due to insufficient purity are indicated. Individual ENKTL patient samples are listed below and those used for PDX models are indicated (*). Minimally gained and deleted regions are shown in Supplementary Table S2.
Figure 2.
Gene repression in stage 4-like ENKTL involves polycomb repression. A, Heat map of the most differentially expressed genes between stage 4 and 5-like ENKTL (q < 0.05) assessed by RNA-seq of FFPE-derived material. Genes with H3K27me3 overlapping their transcriptional start sites in NK cells are indicated. B, Enrichment of differentially expressed genes from A in genesets identified from TF and histone modification ChIP-seq profiles from the Epigenomics Roadmap and ENCODE projects. C, Gene-set enrichment analysis showing the enrichment of differentially expressed genes from A in a custom gene set of H3K27me3-marked genes in normal NK cells. D, Expression of core polycomb repressor complex 2 genes in stage 4- and 5-like ENKTL. Error bars represent SD, significance assessed by Mann–Whitney test. E, Oncoprint displaying the locations of recurrent copy-number alterations in ≥3 patients separated by ENKTL methylation subgroup. Patient samples with undetermined methylation subtype due to insufficient purity are indicated. Individual ENKTL patient samples are listed below and those used for PDX models are indicated (*). Minimally gained and deleted regions are shown in Supplementary Table S2.
Figure 3. Altered DNA methylation in ENKTL involving remarkable hypermethylation of poised, developmentally regulated genes. A, Total number of CpGs hyper- and hypomethylated (gain, loss >20%) in ENKTL versus stage-matched NKDIs. B, The proportion of CpGs within CpG islands and subregions (shores and shelves) that are hypermethylated >20% versus NKDIs, separated by ENKTL subgroup. Changes that occurred during NK-cell development (NKDI stage 3–6) are also indicated. C, Occupancy plot showing methylation of all CpG islands in the genome. ENKTL subgroups are shown separately along with EBV+ gastric carcinoma and NKDIs for reference. Methylation is averaged across all samples within each group (NKDI; n = 21, ENKTL stage 4-like; n = 21, ENKTL stage 5-like; n = 7, EBV+ gastric adenocarcinoma; n = 25). D, Enrichment of hypermethylated CpGs within chromatin state regions from NK, T, and hematopoietic stem cells (HSC). Fold enrichment/depletion of overlapping differential methylation is indicated on the x-axis and bubble size represents the proportion of the total CpGs either enriched or depleted (prevalence). E, Comparison of the gain of promoter CpG island methylation with the corresponding gene expression change in a stage 4–like ENKTL sample (ENKTL1). F, Volcano plot illustrating gene expression differences between ENKTL and matched stage 4b NKDIs. This comparison comprises n = 3 fresh (non–FFPE-derived) stage 4–like ENKTL samples. Selected genes involved in NK-cell development are indicated.
Figure 3.
Altered DNA methylation in ENKTL involving remarkable hypermethylation of poised, developmentally regulated genes. A, Total number of CpGs hyper- and hypomethylated (gain, loss >20%) in ENKTL versus stage-matched NKDIs. B, The proportion of CpGs within CpG islands and subregions (shores and shelves) that are hypermethylated >20% versus NKDIs, separated by ENKTL subgroup. Changes that occurred during NK-cell development (NKDI stage 3–6) are also indicated. C, Occupancy plot showing methylation of all CpG islands in the genome. ENKTL subgroups are shown separately along with EBV+ gastric carcinoma and NKDIs for reference. Methylation is averaged across all samples within each group (NKDI; n = 21, ENKTL stage 4-like; n = 21, ENKTL stage 5-like; n = 7, EBV+ gastric adenocarcinoma; n = 25). D, Enrichment of hypermethylated CpGs within chromatin state regions from NK, T, and hematopoietic stem cells (HSC). Fold enrichment/depletion of overlapping differential methylation is indicated on the x-axis and bubble size represents the proportion of the total CpGs either enriched or depleted (prevalence). E, Comparison of the gain of promoter CpG island methylation with the corresponding gene expression change in a stage 4–like ENKTL sample (ENKTL1). F, Volcano plot illustrating gene expression differences between ENKTL and matched stage 4b NKDIs. This comparison comprises n = 3 fresh (non–FFPE-derived) stage 4–like ENKTL samples. Selected genes involved in NK-cell development are indicated.
Figure 4. DNA hypermethylation prevents developmental TF binding and target gene expression. A, Expression of TBET and EOMES in NKDIs and ENKTL samples using RNA-seq. Error bars represent SEM. B, Surface and intracellular flow cytometry analysis of a representative stage 4–like ENKTL sample showing high levels of TBET and EOMES. Cells were gated on Lineage−, CD45+ events. C, Proportional Venn diagram of EOMES ChIP-seq peaks in stage 5 NKDIs and ENKTL determined using ChIP-seq. Below circles illustrate the number of EOMES binding sites within CpG islands and the subsequent number displaying hypermethylation. EOMES binding sites are separated into those that were gained, lost, or unchanged in ENKTL compared with NKDIs. The percent of hypermethylated CpG islands is indicated. D, Integration of DNA methylation dynamics and ChIP-seq across the IRF8 locus. Red circles indicate the change in methylation from stage 3 to stage 6 of NK-cell development, blue circles indicate the change from NKDI (stage 5) to ENKTL. EOMES binding in stage 5 NKDIs and ENKTL is shown. Histone modifications are shown to indicate promoter (H3K4me3) and enhancer (H3K4me1+ H3K27ac) chromatin states in mature NK cells. E, Expression of IRF8 in ENKTL and across NKDI stages. Error bars represent SEM.
Figure 4.
DNA hypermethylation prevents developmental TF binding and target gene expression. A, Expression of TBET and EOMES in NKDIs and ENKTL samples using RNA-seq. Error bars represent SEM. B, Surface and intracellular flow cytometry analysis of a representative stage 4–like ENKTL sample showing high levels of TBET and EOMES. Cells were gated on Lineage, CD45+ events. C, Proportional Venn diagram of EOMES ChIP-seq peaks in stage 5 NKDIs and ENKTL determined using ChIP-seq. Below circles illustrate the number of EOMES binding sites within CpG islands and the subsequent number displaying hypermethylation. EOMES binding sites are separated into those that were gained, lost, or unchanged in ENKTL compared with NKDIs. The percent of hypermethylated CpG islands is indicated. D, Integration of DNA methylation dynamics and ChIP-seq across the IRF8 locus. Red circles indicate the change in methylation from stage 3 to stage 6 of NK-cell development, blue circles indicate the change from NKDI (stage 5) to ENKTL. EOMES binding in stage 5 NKDIs and ENKTL is shown. Histone modifications are shown to indicate promoter (H3K4me3) and enhancer (H3K4me1+ H3K27ac) chromatin states in mature NK cells. E, Expression of IRF8 in ENKTL and across NKDI stages. Error bars represent SEM.
Figure 5. Generation of ENKTL PDX models and treatment with 5-aza. A, Principal component analysis of the ENKTL samples used for PDX model generation and NKDIs using the NK-cell developmental DNA methylation signature. B, Flow cytometry analysis of ENKTL and normal donor stage 4b NK cells before and after engraftment into NSG mice and following treatment with 5-aza. Flow plots are gated on human CD45, CD56, and lineage-negative markers and show pan-KIR and CD57 as markers of NK cell differentiation. Healthy donor and first-passage ENKTL-engrafted mice were supported with human IL15. Following engraftment, mice were treated after 1 week with vehicle (DMSO) control or 5-azacytidine for 2 weeks (3 times per week) prior to analysis. Statistical significance assessed by log-rank test. C, Survival of 5-aza versus vehicle-treated ENKTL PDX mice. Mice were treated continuously with the above schedule (2 weeks on drug with 1 week drug-free intervals) and monitored for circulating tumor cells. 5-aza treatment was withdrawn for DFTL-85005 mice at 129 days postengraftment. D, Global methylation levels in ex vivo ENKTL1-PDX cells derived from mice treated with vehicle or 5-aza for 14 days. Error bars represent SD, significance assessed by t test. E, The top 277 upregulated genes in ENKTL-PDX cells after 14 days of 5-aza treatment versus vehicle using RNA-seq (>2.0 log2 fc, q < 0.10). Upregulated CT antigen gene families (MAGE, GAGE, PAGE, and SSX) illustrated separately below. F, Enrichment of upregulated genes following 5-aza treatment within gene expression signatures in collection of 176 distinct tissues and cell types from the GNF database.
Figure 5.
Generation of ENKTL PDX models and treatment with 5-aza. A, Principal component analysis of the ENKTL samples used for PDX model generation and NKDIs using the NK-cell developmental DNA methylation signature. B, Flow cytometry analysis of ENKTL and normal donor stage 4b NK cells before and after engraftment into NSG mice and following treatment with 5-aza. Flow plots are gated on human CD45, CD56, and lineage-negative markers and show pan-KIR and CD57 as markers of NK cell differentiation. Healthy donor and first-passage ENKTL-engrafted mice were supported with human IL15. Following engraftment, mice were treated after 1 week with vehicle (DMSO) control or 5-azacytidine for 2 weeks (3 times per week) prior to analysis. Statistical significance assessed by log-rank test. C, Survival of 5-aza versus vehicle-treated ENKTL PDX mice. Mice were treated continuously with the above schedule (2 weeks on drug with 1 week drug-free intervals) and monitored for circulating tumor cells. 5-aza treatment was withdrawn for DFTL-85005 mice at 129 days postengraftment. D, Global methylation levels in ex vivo ENKTL1-PDX cells derived from mice treated with vehicle or 5-aza for 14 days. Error bars represent SD, significance assessed by t test. E, The top 277 upregulated genes in ENKTL-PDX cells after 14 days of 5-aza treatment versus vehicle using RNA-seq (>2.0 log2 fc, q < 0.10). Upregulated CT antigen gene families (MAGE, GAGE, PAGE, and SSX) illustrated separately below. F, Enrichment of upregulated genes following 5-aza treatment within gene expression signatures in collection of 176 distinct tissues and cell types from the GNF database.
Figure 6. Developmental phenotypic diversity between ENKTL cells following 5-aza treatment. A, Global DNA methylation levels of ENKTL1-PDX cells harvested from vehicle and 5-aza–treated mice and separated into KIR+ and KIR− subsets. ENKTL cells were collected after 1 week of therapy and at moribund, which included 2 weeks on therapy followed by approximately 2 weeks without therapy. Error bars represent SD, significance assessed by paired t tests. B, Heat map of 123 genes upregulated in KIR+ versus KIR− cells (fc>1.5, q < 0.1). Genes with known involvement in NK-cell maturation and function are highlighted. CT antigen gene families are shown. C, KIR+ and KIR− cells were sorted from 5-aza–treated PDX mice at moribund and transplanted into new recipient mice. Transplanted ENKTL cells were expanded without additional treatment. Contour flow plots show the levels of KIR expression of human CD56+ cells 21 days after transplant. D, Percent of KIR+ and KIR− cell populations that display Ki67 positivity. Error bars represent SD, significance assessed by paired t test. E, Ratio of KIR+ to KIR− cells in PDX mice during disease course in ENKTL1-PDX mice. 5-aza treatment was started on day 7. Error bars represent SD.
Figure 6.
Developmental phenotypic diversity between ENKTL cells following 5-aza treatment. A, Global DNA methylation levels of ENKTL1-PDX cells harvested from vehicle and 5-aza–treated mice and separated into KIR+ and KIR subsets. ENKTL cells were collected after 1 week of therapy and at moribund, which included 2 weeks on therapy followed by approximately 2 weeks without therapy. Error bars represent SD, significance assessed by paired t tests. B, Heat map of 123 genes upregulated in KIR+ versus KIR cells (fc>1.5, q < 0.1). Genes with known involvement in NK-cell maturation and function are highlighted. CT antigen gene families are shown. C, KIR+ and KIR cells were sorted from 5-aza–treated PDX mice at moribund and transplanted into new recipient mice. Transplanted ENKTL cells were expanded without additional treatment. Contour flow plots show the levels of KIR expression of human CD56+ cells 21 days after transplant. D, Percent of KIR+ and KIR cell populations that display Ki67 positivity. Error bars represent SD, significance assessed by paired t test. E, Ratio of KIR+ to KIR cells in PDX mice during disease course in ENKTL1-PDX mice. 5-aza treatment was started on day 7. Error bars represent SD.

Comment in

  • Blood Cancer Discov. 3:85.
  • Blood Cancer Discov. 3:85.

References

    1. Brammer JE, Chihara D, Poon LM, Caimi P, de Lima M, Ledesma Cet al. Management of advanced and relapsed/refractory extranodal natural killer T-cell lymphoma: an analysis of stem cell transplantation and chemotherapy outcomes. Clin Lymphoma Myeloma Leuk 2018;18:e41–50. - PMC - PubMed
    1. Haverkos BM, Coleman C, Gru AA, Pan Z, Brammer J, Rochford Ret al. Emerging insights on the pathogenesis and treatment of extranodal NK/T cell lymphomas (ENKTL). Discov Med 2017;23:189–99. - PMC - PubMed
    1. Pongpruttipan T, Kummalue T, Bedavanija A, Khuhapinant A, Ohshima K, Arakawa Fet al. Aberrant antigenic expression in extranodal NK/T-cell lymphoma: a multi-parameter study from Thailand. Diagn Pathol 2011;6:79. - PMC - PubMed
    1. Pongpruttipan T, Pongtongcharoen P, Sukpanichnant S. Mature T-cell and NK-cell lymphomas in Thailand: an analysis of 71 cases. J Med Assoc Thai 2011;94:743–8. - PubMed
    1. Pongpruttipan T, Sukpanichnant S, Assanasen T, Wannakrairot P, Boonsakan P, Kanoksil Wet al. Extranodal NK/T-cell lymphoma, nasal type, includes cases of natural killer cell and alphabeta, gammadelta, and alphabeta/gammadelta T-cell origin: a comprehensive clinicopathologic and phenotypic study. Am J Surg Pathol 2012;36:481–99. - PubMed

Publication types

MeSH terms