. 2022 May 5;3(3):240-263.
doi: 10.1158/2643-3230.BCD-21-0163.

ZNF384 Fusion Oncoproteins Drive Lineage Aberrancy in Acute Leukemia

Affiliations

ZNF384 Fusion Oncoproteins Drive Lineage Aberrancy in Acute Leukemia

Kirsten M Dickerson et al. Blood Cancer Discov. .

Abstract

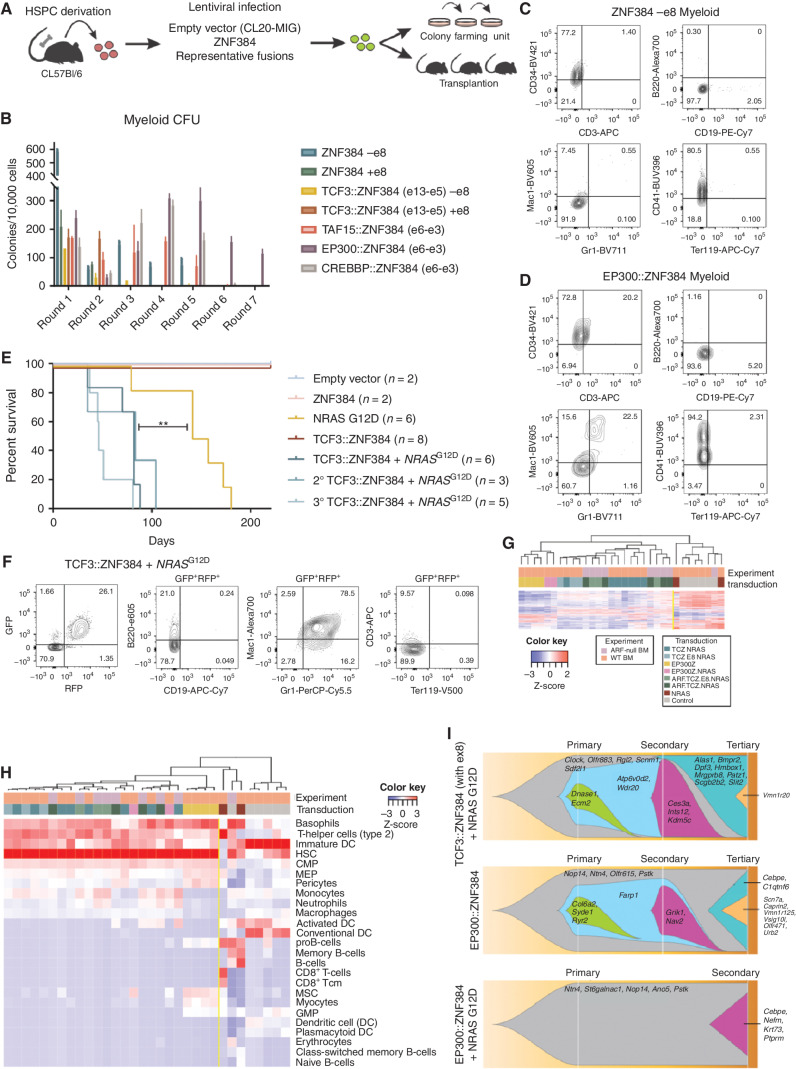
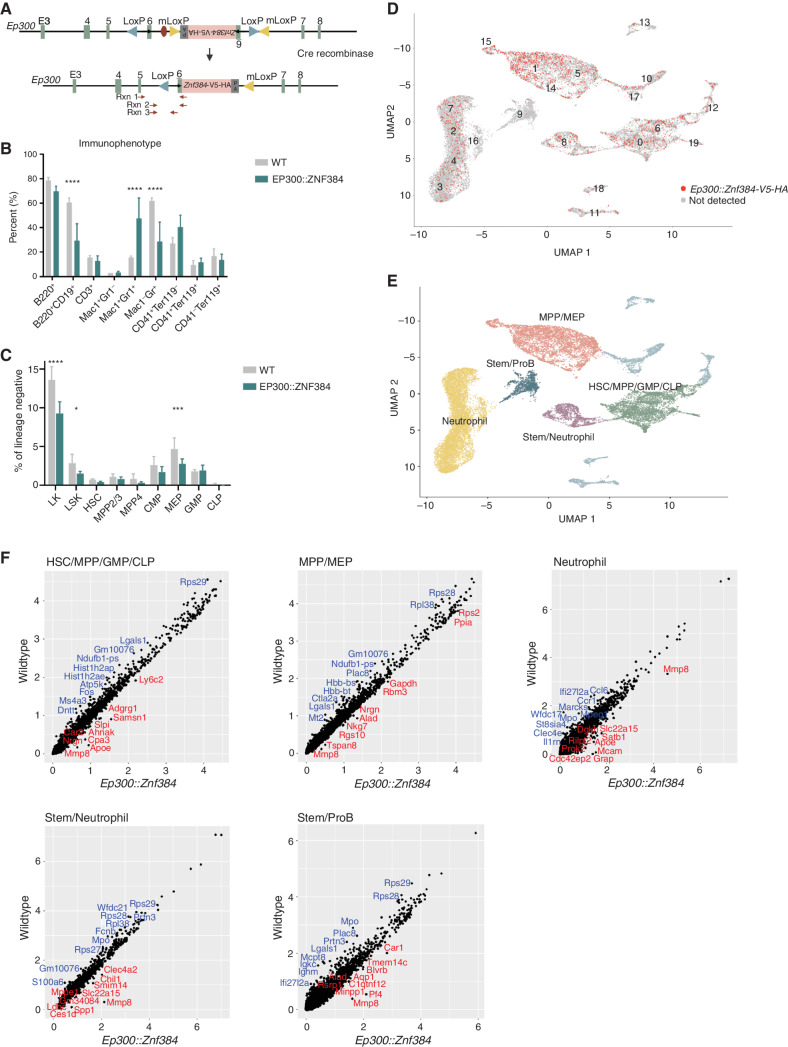
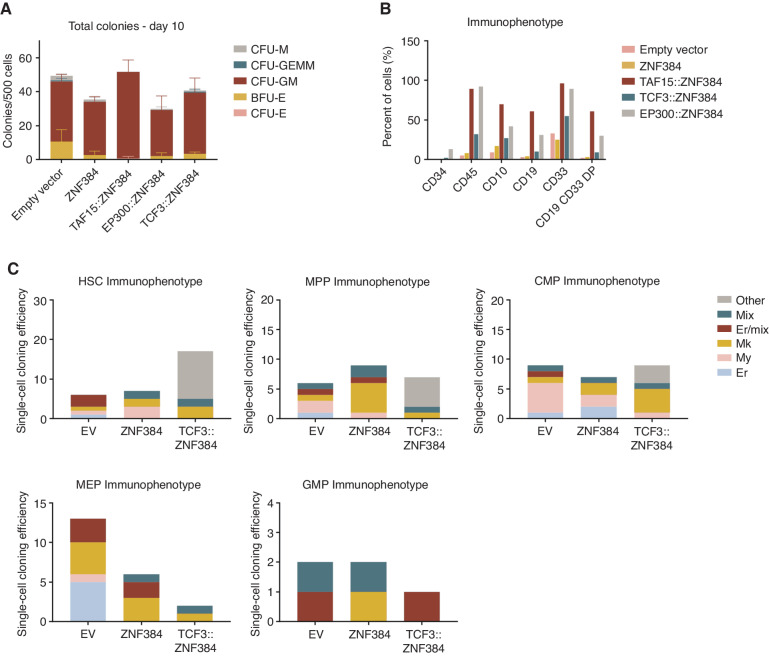
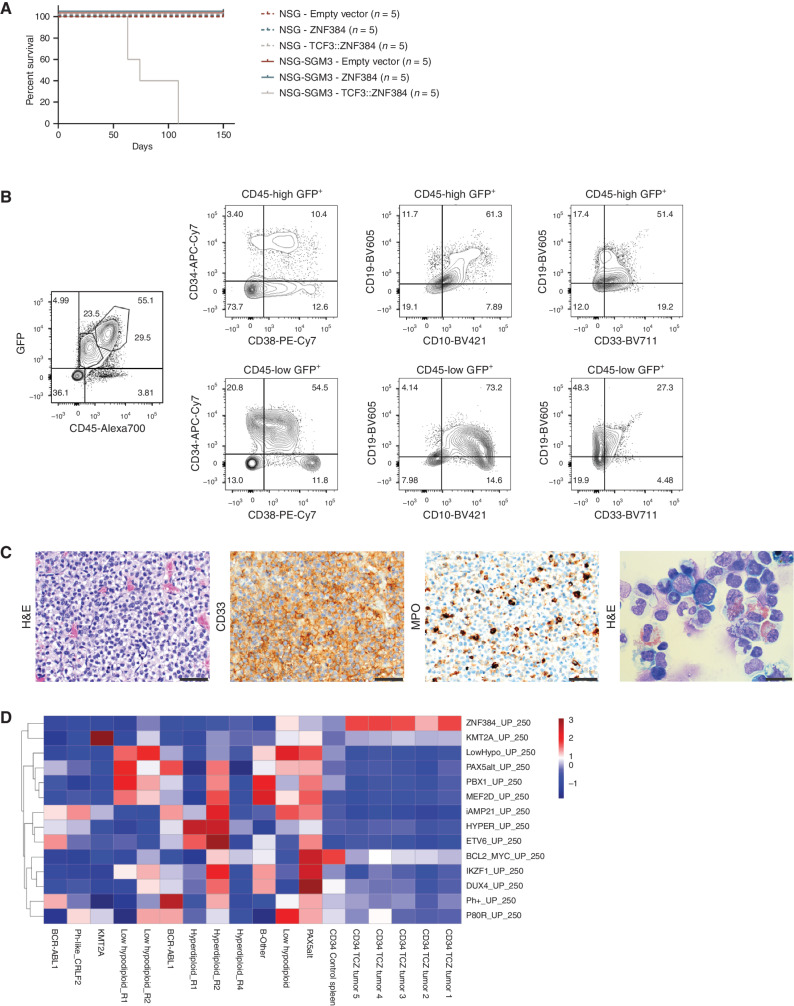
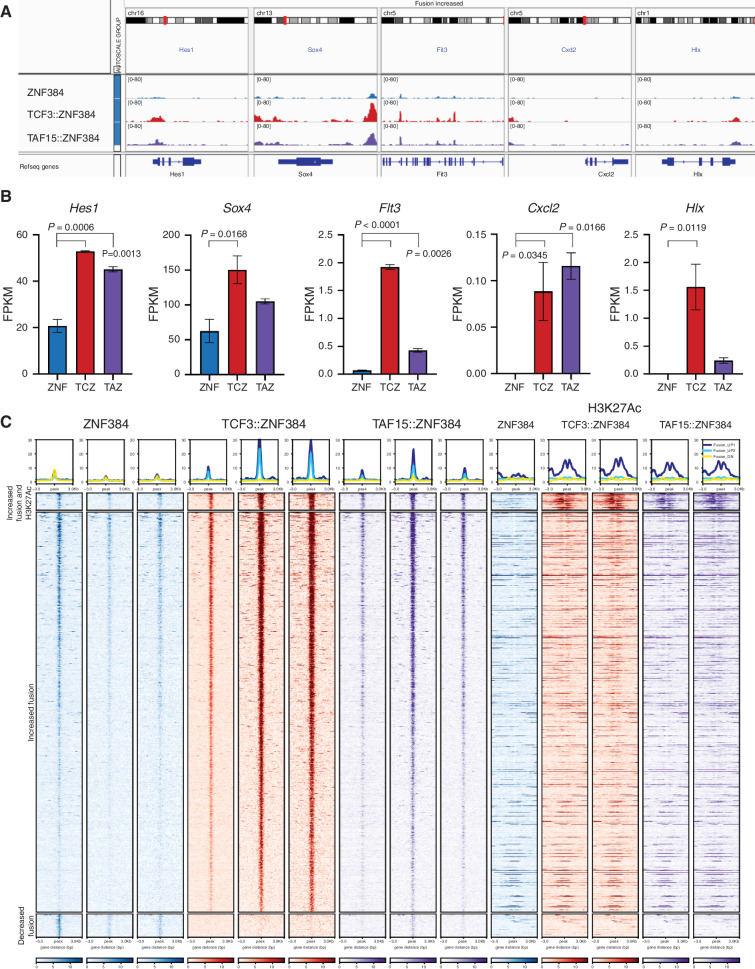
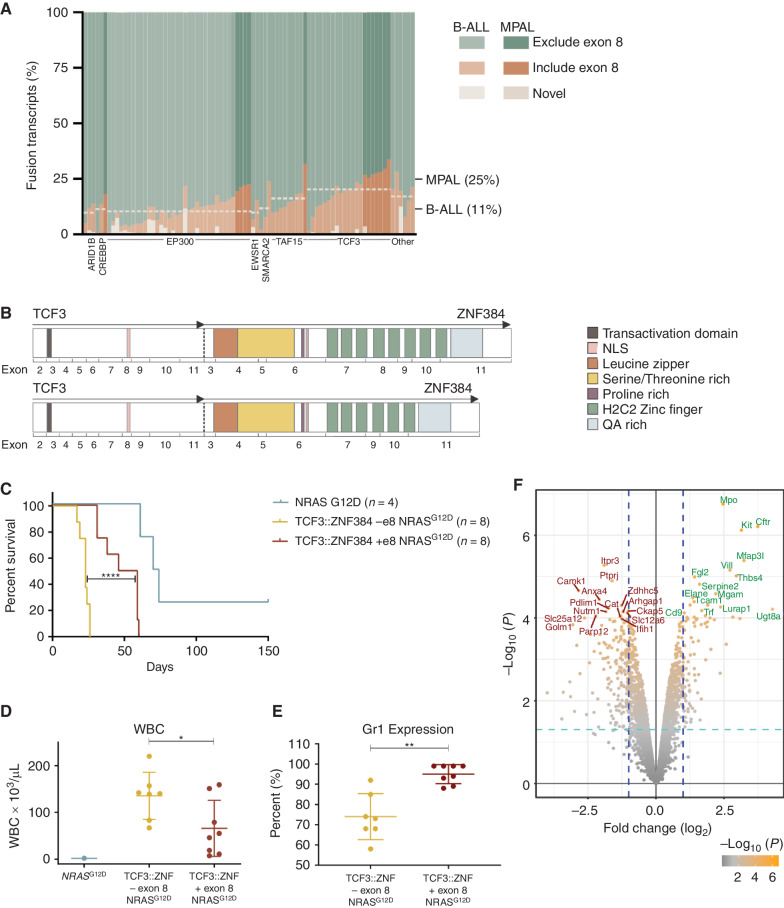
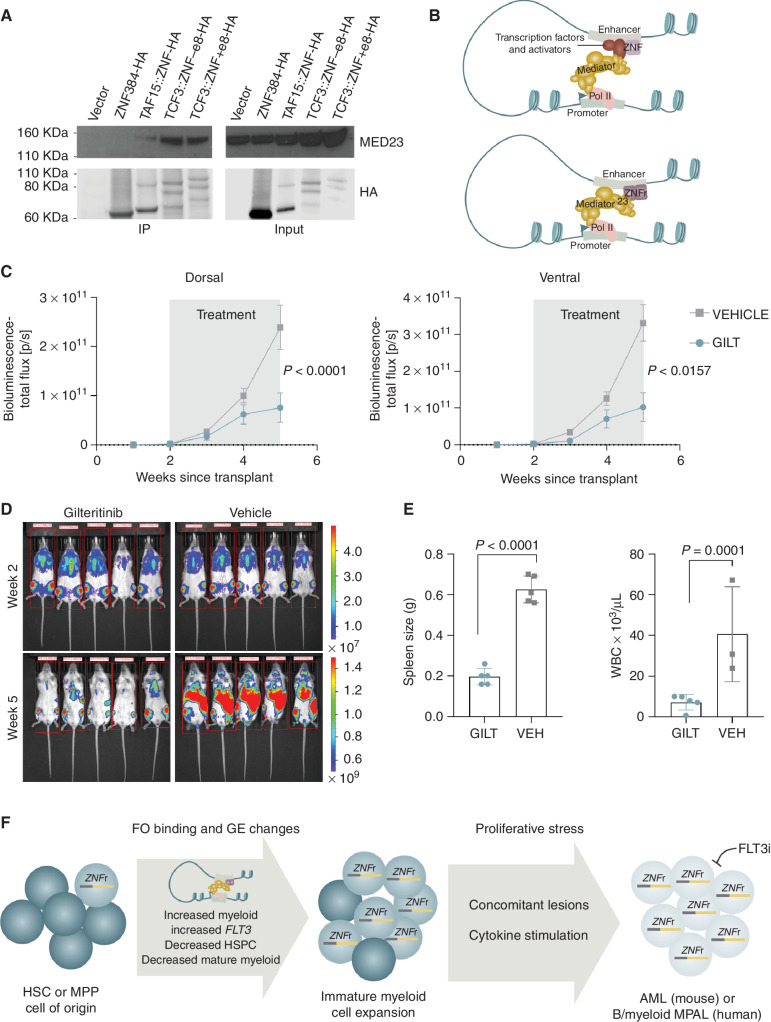
ZNF384-rearranged fusion oncoproteins (FO) define a subset of lineage ambiguous leukemias, but their mechanistic role in leukemogenesis and lineage ambiguity is poorly understood. Using viral expression in mouse and human hematopoietic stem and progenitor cells (HSPC) and a Ep300::Znf384 knockin mouse model, we show that ZNF384 FO promote hematopoietic expansion, myeloid lineage skewing, and self-renewal. In mouse HSPCs, concomitant lesions, such as NRASG12D, were required for fully penetrant leukemia, whereas in human HSPCs, expression of ZNF384 FO drove B/myeloid leukemia, with sensitivity of a ZNF384-rearranged xenograft to FLT3 inhibition in vivo. Mechanistically, ZNF384 FO occupy a subset of predominantly intragenic/enhancer regions with increased histone 3 lysine acetylation and deregulate expression of hematopoietic stem cell transcription factors. These data define a paradigm for FO-driven lineage ambiguous leukemia, in which expression in HSPCs results in deregulation of lineage-specific genes and hematopoietic skewing, progressing to full leukemia in the context of proliferative stress.

Significance: Expression of ZNF384 FO early in hematopoiesis results in binding and deregulation of key hematopoietic regulators, skewing of hematopoiesis, and priming for leukemic transformation. These results reveal the interplay between cell of origin and expression of ZNF384 FO to mediate lineage ambiguity and leukemia development. This article is highlighted in the In This Issue feature, p. 171.


Figures

Figure 1. Mouse HSPC transformation by expression of ZNF384 FO. A, The workflow for colony-forming assays and transplantation assays. Bone marrow was isolated from mice, enriched for HSPC, transduced with representative fusions, and sorted for colony-forming assays (CFU) or transplanted directly into mice. B, CFU of lineage-negative bone marrow cells expressing wild-type or FO, with or without exon 8, grown in myeloid differentiation conditions. Columns show means of three replicates ± SD. C, Cells harvested from CFU after two or more replatings were subjected to flow cytometry and representative immunophenotype is shown of wild-type cells (D) or EP300::ZNF384–expressing cell. E, Survival curves in primary, secondary, and tertiary recipients. Two-sided log-rank Mantel–Cox test, **, P  =  0.008, F, Immunophenotyping from a representative mouse (ID 1723) showing tumors harvested from bone marrow expressing Mac1 and Gr1. G, Unsupervised hierarchical clustering of tumors generated in mice. Abbreviations: TCZ.NRAS: TCF3::ZNF384 + NRASG12D; TCZ.E8.NRAS: TCF3::ZNF384 (with exon 8) + NRASG12D; EP300Z.NRAS: EP300::ZNF384 + NRASG12D; ARF.TCZ.NRAS: ARF-null TCF3::ZNF384 + NRASG12D; ARF.TCZ.E8.NRAS: ARF-null TCF3::ZNF384 (with exon 8) + NRASG12D; NRAS: NRASG12D. H, Unsupervised hierarchical clustering xCell analysis showing hematopoietic cell-type signature enrichment. Color legend is the same from G. I, Fishplot of three mouse tumors subjected to exome sequencing showing mutational evolution.
Figure 1.
Mouse HSPC transformation by expression of ZNF384 FO. A, The workflow for colony-forming assays and transplantation assays. Bone marrow was isolated from mice, enriched for HSPC, transduced with representative fusions, and sorted for colony-forming assays (CFU) or transplanted directly into mice. B, CFU of lineage-negative bone marrow cells expressing wild-type or FO, with or without exon 8, grown in myeloid differentiation conditions. Columns show means of three replicates ± SD. C, Cells harvested from CFU after two or more replatings were subjected to flow cytometry and representative immunophenotype is shown of wild-type cells (D) or EP300::ZNF384–expressing cell. E, Survival curves in primary, secondary, and tertiary recipients. Two-sided log-rank Mantel–Cox test, **, P  =  0.008, F, Immunophenotyping from a representative mouse (ID 1723) showing tumors harvested from bone marrow expressing Mac1 and Gr1. G, Unsupervised hierarchical clustering of tumors generated in mice. Abbreviations: TCZ.NRAS: TCF3::ZNF384 + NRASG12D; TCZ.E8.NRAS: TCF3::ZNF384 (with exon 8) + NRASG12D; EP300Z.NRAS: EP300::ZNF384 + NRASG12D; ARF.TCZ.NRAS: ARF-null TCF3::ZNF384 + NRASG12D; ARF.TCZ.E8.NRAS: ARF-null TCF3::ZNF384 (with exon 8) + NRASG12D; NRAS: NRASG12D. H, Unsupervised hierarchical clustering xCell analysis showing hematopoietic cell-type signature enrichment. Color legend is the same from G. I, Fishplot of three mouse tumors subjected to exome sequencing showing mutational evolution.
Figure 2. Mice expressing Ep300::Znf384-V5-HA show skewing of hematopoiesis with immature myeloid cell expansion. A, A schematic representation of the reverse-orientation minigene that was knocked into intron 6 of Ep300. Upon Cre-driven recombination, the minigene is flipped and replaces endogenous exon 6. The primers used for PCR validation are shown in red arrows. B, Immunophenotype of the peripheral blood, determined by flow. Columns show means of four replicates ± SD. ****, P < 0.0001; ***, P = 0.0008. C, HSPC compartment characterization by flow analysis of bone marrow cells. Lineage-negative, Kit+ (LK); lineage-negative, Sca1+, Kit+ (LSK); hematopoietic stem cell (HSC); multipotent progenitor 2 and 3 (MPP2/3); multipotent progenitor 4 (MPP4); common myeloid progenitor (CMP); megakaryocyte erythroid progenitor (MEP); granulocyte monocyte progenitor (GMP). ***, P = 0.0008; *, P = 0.0460. D, Uniform Manifold Approximation and Projection (UMAP) dimensionality reduction showing wild-type and EP300::ZNF384 cells, with red indicating detectable Ep300::ZNF384-V5-HA expression. E, UMAP showing that similar clusters were grouped together to make five partitions. F, Gene expression was compared between wild-type and EP300::ZNF384-V5-HA samples in the HSC/MPP/GMP/CLP partition, MPP/MEP partition, neutrophil partition, stem/neutrophil partition or stem/pro B partition.
Figure 2.
Mice expressing Ep300::Znf384-V5-HA show skewing of hematopoiesis with immature myeloid cell expansion. A, A schematic representation of the reverse-orientation minigene that was knocked into intron 6 of Ep300. Upon Cre-driven recombination, the minigene is flipped and replaces endogenous exon 6. The primers used for PCR validation are shown in red arrows. B, Immunophenotype of the peripheral blood, determined by flow. Columns show means of four replicates ± SD. ****, P < 0.0001; ***, P = 0.0008. C, HSPC compartment characterization by flow analysis of bone marrow cells. Lineage-negative, Kit+ (LK); lineage-negative, Sca1+, Kit+ (LSK); hematopoietic stem cell (HSC); multipotent progenitor 2 and 3 (MPP2/3); multipotent progenitor 4 (MPP4); common myeloid progenitor (CMP); megakaryocyte erythroid progenitor (MEP); granulocyte monocyte progenitor (GMP). ***, P = 0.0008; *, P = 0.0460. D, Uniform Manifold Approximation and Projection (UMAP) dimensionality reduction showing wild-type and EP300::ZNF384 cells, with red indicating detectable Ep300::ZNF384-V5-HA expression. E, UMAP showing that similar clusters were grouped together to make five partitions. F, Gene expression was compared between wild-type and EP300::ZNF384-V5-HA samples in the HSC/MPP/GMP/CLP partition, MPP/MEP partition, neutrophil partition, stem/neutrophil partition or stem/pro B partition.
Figure 3. Human CD34 cells expressing ZNF384 FO exhibit immature myeloid cell expansion. A, CFU of CD34 human cord blood cells expressing empty vector, wild-type, or FO. Columns show means of two replicates ± SD. Colonies were scored based on morphology; macrophage (CFU-M), granulocyte, erythrocyte, macrophage, megakaryocyte (CFU-GEMM), granulocyte, macrophage (CFU-GM), burst forming unit-erythroid (BFU-E), or erythroid (CFU-E). B, Cells harvested from CFU were subjected to flow cytometry. FO-expressing cells have an expansion of CD45- and CD33-positive cells compared with controls. FO samples also have CD19, CD33 double-positive cells. C, Cloning efficiency and lineage outcomes of single cells from indicated genotypes. Data in B and C represent cells pooled from replicates for analysis.
Figure 3.
Human CD34 cells expressing ZNF384 FO exhibit immature myeloid cell expansion. A, CFU of CD34 human cord blood cells expressing empty vector, wild-type, or FO. Columns show means of two replicates ± SD. Colonies were scored based on morphology; macrophage (CFU-M), granulocyte, erythrocyte, macrophage, megakaryocyte (CFU-GEMM), granulocyte, macrophage (CFU-GM), burst forming unit-erythroid (BFU-E), or erythroid (CFU-E). B, Cells harvested from CFU were subjected to flow cytometry. FO-expressing cells have an expansion of CD45- and CD33-positive cells compared with controls. FO samples also have CD19, CD33 double-positive cells. C, Cloning efficiency and lineage outcomes of single cells from indicated genotypes. Data in B and C represent cells pooled from replicates for analysis.
Figure 4. Human CD34 cells expressing TCF3::ZNF384 (TCZ) drive B/myeloid leukemia in vivo. A, Survival curves in primary recipients transplanted with indicated cells. B, Immunophenotyping from a representative mouse showing tumors express CD34, CD38, CD33, and CD19. C, Hematoxylin and eosin (H&E) staining (left), CD33 staining (middle), MPO staining (right) of sternal section and cytospin of bone marrow cells. Scale bars represent 50 µm for all except for bone marrow cytospin (scale bar, 20 µm). D, Single-sample GSEA displaying relative enrichment score (Z-score) for B-ALL subtype-specific gene lists. Experimental tumors are enriched for ZNF384r gene set. Patients 1–12 (non-ZNF384r) were included for heterogeneity, which is required for analysis. Adjacent samples labeled R1, R2, or R4 are relapsed samples from the same patient. TCZ, TCF3::ZNF384.
Figure 4.
Human CD34 cells expressing TCF3::ZNF384 (TCZ) drive B/myeloid leukemia in vivo. A, Survival curves in primary recipients transplanted with indicated cells. B, Immunophenotyping from a representative mouse showing tumors express CD34, CD38, CD33, and CD19. C, Hematoxylin and eosin (H&E) staining (left), CD33 staining (middle), MPO staining (right) of sternal section and cytospin of bone marrow cells. Scale bars represent 50 µm for all except for bone marrow cytospin (scale bar, 20 µm). D, Single-sample GSEA displaying relative enrichment score (Z-score) for B-ALL subtype-specific gene lists. Experimental tumors are enriched for ZNF384r gene set. Patients 1–12 (non-ZNF384r) were included for heterogeneity, which is required for analysis. Adjacent samples labeled R1, R2, or R4 are relapsed samples from the same patient. TCZ, TCF3::ZNF384.
Figure 5. ZNF384 FO binding to chromatin is associated with H3K27 acetylation and increased expression of hematopoietic regulators. A, Representative genomic regions with increased binding of the FO compared with wild-type. B, Representative expression in fragments per kilobase million (FPKM) of genes with differential binding. Columns show means of two replicates ± SD. ZNF, wild type ZNF384; TCZ, TCF3::ZNF384; TAZ, TAF15::ZNF384. C, Heat map showing the ChIP-seq signal, centered on ZNF384 peaks, of wild-type ZNF384 compared with TCF3::ZNF384 and TAF15::ZNF384; and H3K27Ac signal, centered on ZNF384 peaks (top). Peaks with increased binding of FO compared with wild-type proteins separated by regions with increased H3K27Ac or regions with same H3K27Ac (middle). Peaks with decreased binding of the FO compared with wild-type proteins (bottom).
Figure 5.
ZNF384 FO binding to chromatin is associated with H3K27 acetylation and increased expression of hematopoietic regulators. A, Representative genomic regions with increased binding of the FO compared with wild-type. B, Representative expression in fragments per kilobase million (FPKM) of genes with differential binding. Columns show means of two replicates ± SD. ZNF, wild-type ZNF384; TCZ, TCF3::ZNF384; TAZ, TAF15::ZNF384. C, Heat map showing the ChIP-seq signal, centered on ZNF384 peaks, of wild-type ZNF384 compared with TCF3::ZNF384 and TAF15::ZNF384; and H3K27Ac signal, centered on ZNF384 peaks (top). Peaks with increased binding of FO compared with wild-type proteins separated by regions with increased H3K27Ac or regions with same H3K27Ac (middle). Peaks with decreased binding of the FO compared with wild-type proteins (bottom).
Figure 6. The effect of TCF3::ZNF384 alternative splicing isoforms. A, Relative abundance of ZNF384 splice isoforms in ZNF384r B-ALL and MPAL. Each column represents a case and shows the cumulative abundance of all isoforms as a proportion within each case. The mean inclusion of exon 8 based on N-terminal partner is marked by the horizontal line across cases including that partner. TCF3::ZNF384 fusions have a higher mean exon 8 inclusion rate. Light cases were diagnosed as B-ALL and darker cases as MPAL, with the mean exon 8 inclusion for each diagnosis marked on the left. MPAL cases have a higher average exon 8 inclusion rate. B, A schematic representation of TCF3::ZNF384 mRNA splicing isoforms that differ in exon 8 inclusion. C, Survival curves in primary recipients transplanted with indicated cells. Two-sided log-rank Mantel–Cox test; ****, P < 0.0001. D, White blood cell (WBC) count at death in mice transplanted with indicated cells. The mean expression is shown by the horizontal line in the scatter dot plot and the error bars represent the SD. *, P = 0.0315. E, Percent of cells expressing Gr1 as determined by flow analysis. The mean expression is shown by the horizontal line in the scatter dot plot and the error bars represent the SD; **, P = 0.0042. F, A volcano plot displaying −log10 P value by log2 fold change to compare gene expression of tumors driven by TCF3::ZNF384 with exon 8 to TCF3::ZNF384 without exon 8.
Figure 6.
The effect of TCF3::ZNF384 alternative splicing isoforms. A, Relative abundance of ZNF384 splice isoforms in ZNF384r B-ALL and MPAL. Each column represents a case and shows the cumulative abundance of all isoforms as a proportion within each case. The mean inclusion of exon 8 based on N-terminal partner is marked by the horizontal line across cases including that partner. TCF3::ZNF384 fusions have a higher mean exon 8 inclusion rate. Light cases were diagnosed as B-ALL and darker cases as MPAL, with the mean exon 8 inclusion for each diagnosis marked on the left. MPAL cases have a higher average exon 8 inclusion rate. B, A schematic representation of TCF3::ZNF384 mRNA splicing isoforms that differ in exon 8 inclusion. C, Survival curves in primary recipients transplanted with indicated cells. Two-sided log-rank Mantel–Cox test; ****, P < 0.0001. D, White blood cell (WBC) count at death in mice transplanted with indicated cells. The mean expression is shown by the horizontal line in the scatter dot plot and the error bars represent the SD. *, P = 0.0315. E, Percent of cells expressing Gr1 as determined by flow analysis. The mean expression is shown by the horizontal line in the scatter dot plot and the error bars represent the SD; **, P = 0.0042. F, A volcano plot displaying −log10P value by log2 fold change to compare gene expression of tumors driven by TCF3::ZNF384 with exon 8 to TCF3::ZNF384 without exon 8.
Figure 7. Proposed model of ZNF384 FO mechanism and in vivo sensitivity to gilteritinib. A, Co-immunoprecipitation assay using 293T cells and HA antibody. Pull-down lysates were blotted with anti-MED23 or anti-HA to show that ZNF384 FOs, but not ZNF384, interact with MED23. White bars between images delineate samples run on separate gels. B, Proposed model showing that ZNF384 binds to enhancer regions and through interactions with transcription factors and activators can interact with the Mediator complex to initiate transcription (left). In contrast, ZNF384 FO directly interact with MED23 of the Mediator complex, which bypasses the need to interact with additional transcription factors and activators to initiate transcription (right). C, MPAL patient-derived xenograft expressing TCF3::ZNF384 were randomized to receive 20 mg/kg of gilteritinib (GILT) or vehicle (VEH) once daily from week 2 to week 5. Tumor burden was monitored by bioluminescent imaging. D, Ventral bioluminescent imaging of indicated treatment groups at beginning (top) and end (bottom) of treatment. E, Spleen weight at time of death (left) or white blood cell (WBC; right) count at time of death in mice with indicated treatment. The mean expression is shown by the bar and the error bars represent the SD. F, Graphical summary of the results from this study. ZNF384 rearrangements arise in an early HSC or multi-potent progenitor (MPP). Through increased binding of ZNF384 FO at wild-type target genes (related to normal hematopoietic development), gene expression (GE) is deregulated, likely through a stabilized Mediator complex. Changes in GE programs leads to an expansion of immature myeloid cells that are primed for leukemic transformation in the presence of proliferative stress. In addition, ZNF384r leukemia shows in vivo sensitivity to FLT3 inhibition.
Figure 7.
Proposed model of ZNF384 FO mechanism and in vivo sensitivity to gilteritinib. A, Co-immunoprecipitation assay using 293T cells and HA antibody. Pull-down lysates were blotted with anti-MED23 or anti-HA to show that ZNF384 FOs, but not ZNF384, interact with MED23. White bars between images delineate samples run on separate gels. B, Proposed model showing that ZNF384 binds to enhancer regions and through interactions with transcription factors and activators can interact with the Mediator complex to initiate transcription (top). In contrast, ZNF384 FO directly interact with MED23 of the Mediator complex, which bypasses the need to interact with additional transcription factors and activators to initiate transcription (bottom). C, MPAL patient-derived xenograft expressing TCF3::ZNF384 were randomized to receive 20 mg/kg of gilteritinib (GILT) or vehicle (VEH) once daily from week 2 to week 5. Tumor burden was monitored by bioluminescent imaging. D, Ventral bioluminescent imaging of indicated treatment groups at beginning (top) and end (bottom) of treatment. E, Spleen weight at time of death (left) or white blood cell (WBC; right) count at time of death in mice with indicated treatment. The mean expression is shown by the bar and the error bars represent the SD. F, Graphical summary of the results from this study. ZNF384 rearrangements arise in an early HSC or multi-potent progenitor (MPP). Through increased binding of ZNF384 FO at wild-type target genes (related to normal hematopoietic development), gene expression (GE) is deregulated, likely through a stabilized Mediator complex. Changes in GE programs leads to an expansion of immature myeloid cells that are primed for leukemic transformation in the presence of proliferative stress. In addition, ZNF384r leukemia shows in vivo sensitivity to FLT3 inhibition.

Comment in

  • Blood Cancer Discov. 3:171.
  • Blood Cancer Discov. 3:171.

References

    1. Hunger SP, Mullighan CG. Acute lymphoblastic leukemia in children. N Engl J Med 2015;373:1541–52. - PubMed
    1. Arber DA, Orazi A, Hasserjian R, Thiele J, Borowitz MJ, Le Beau MM, et al. . The 2016 revision to the World Health Organization classification of myeloid neoplasms and acute leukemia. Blood 2016;127:2391–405. - PubMed
    1. Kurzer JH, Weinberg OK. Acute leukemias of ambiguous lineage: clarification on lineage specificity. Surg Pathol Clin 2019;12:687–97. - PubMed
    1. Gerr H, Zimmermann M, Schrappe M, Dworzak M, Ludwig WD, Bradtke J, et al. . Acute leukaemias of ambiguous lineage in children: characterization, prognosis and therapy recommendations. Br J Haematol 2010;149:84–92. - PubMed
    1. Rubnitz JE, Onciu M, Pounds S, Shurtleff S, Cao X, Raimondi SC, et al. . Acute mixed lineage leukemia in children: the experience of St Jude Children's Research Hospital. Blood 2009;113:5083–9. - PMC - PubMed

Publication types