. 2022 May 4;21(5):762-774.
doi: 10.1158/1535-7163.MCT-21-0142.

Concurrent Inhibition of ERK and Farnesyltransferase Suppresses the Growth of HRAS Mutant Head and Neck Squamous Cell Carcinoma

Affiliations

Concurrent Inhibition of ERK and Farnesyltransferase Suppresses the Growth of HRAS Mutant Head and Neck Squamous Cell Carcinoma

Sehrish Javaid et al. Mol Cancer Ther. .

Abstract

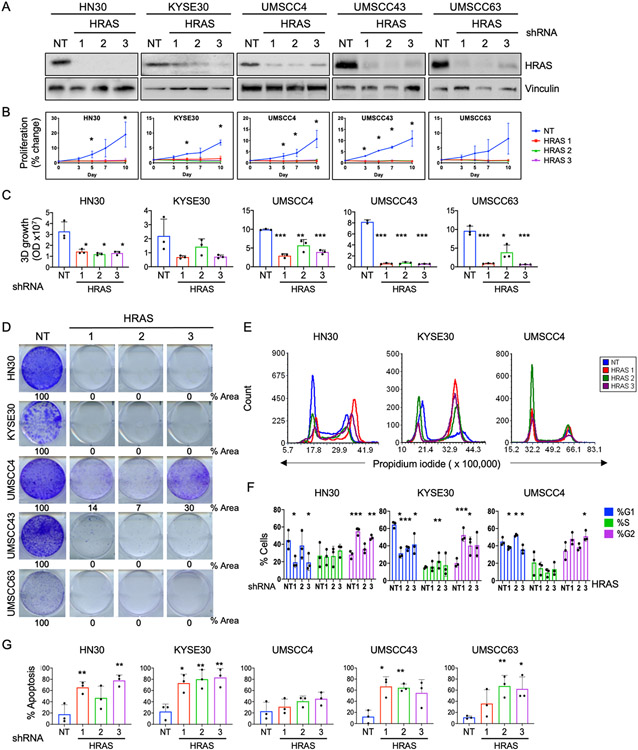
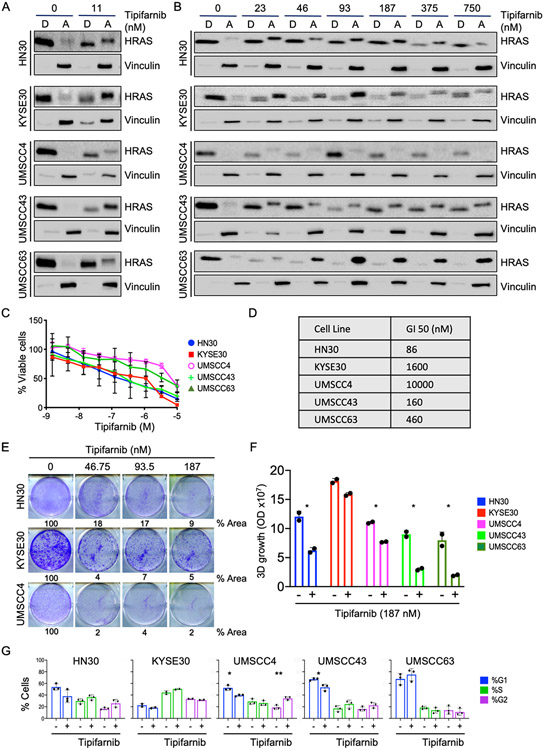
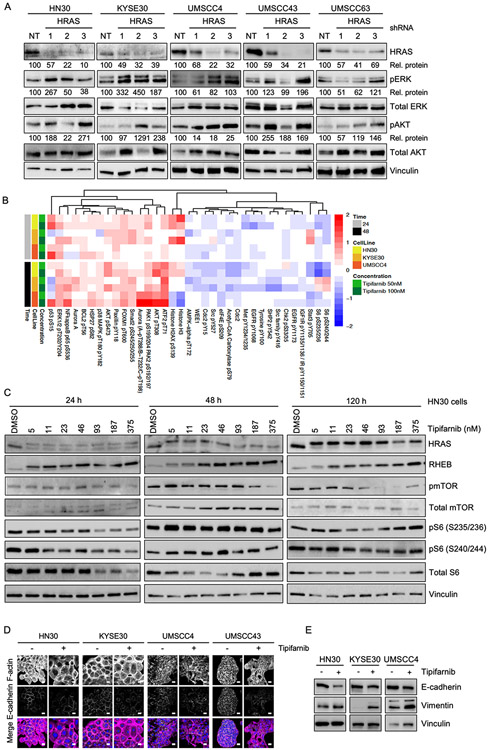
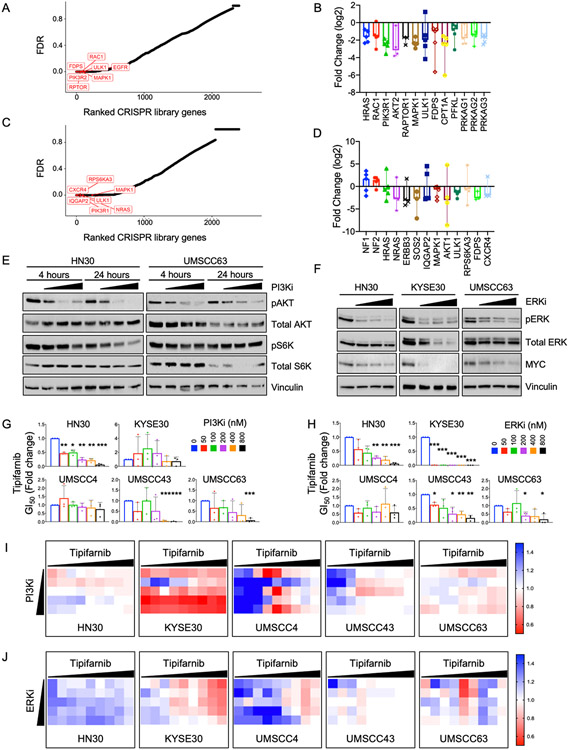
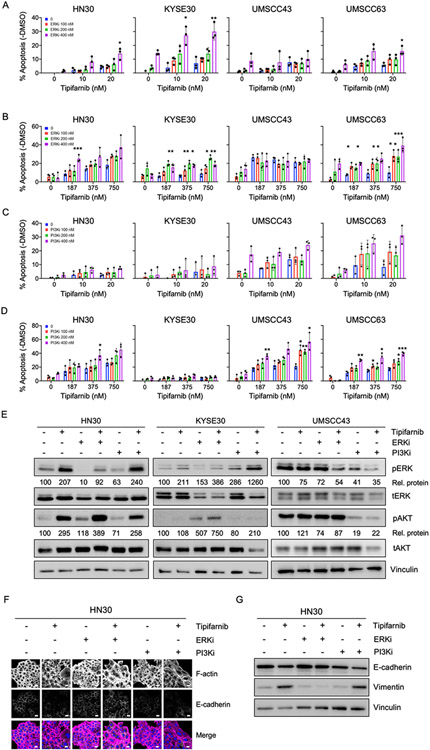
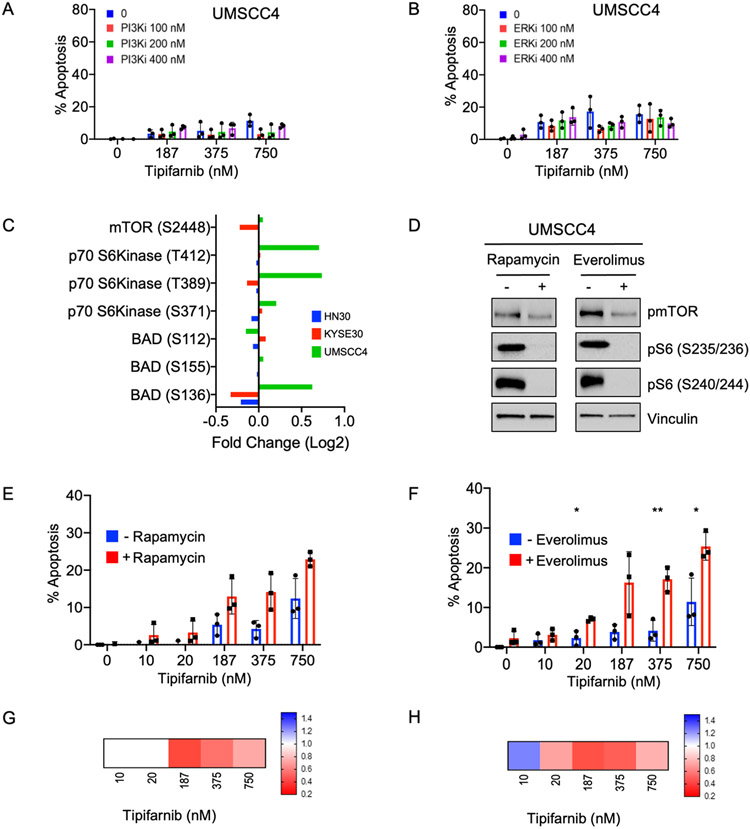
Human papilloma virus (HPV)-negative head and neck squamous cell carcinoma (HNSCC) is a common cancer worldwide with an unmet need for more effective, less toxic treatments. Currently, both the disease and the treatment of HNSCC cause significant mortality and morbidity. Targeted therapies hold new promise for patients with HPV-negative status whose tumors harbor oncogenic HRAS mutations. Recent promising clinical results have renewed interest in the development of farnesyltransferase inhibitors (FTIs) as a therapeutic strategy for HRAS-mutant cancers. With the advent of clinical evaluation of the FTI tipifarnib for the treatment of HRAS-mutant HNSCC, we investigated the activity of tipifarnib and inhibitors of HRAS effector signaling in HRAS-mutant HNSCC cell lines. First, we validated that HRAS is a cancer driver in HRAS-mutant HNSCC lines. Second, we showed that treatment with the FTI tipifarnib largely phenocopied HRAS silencing, supporting HRAS as a key target of FTI antitumor activity. Third, we performed reverse-phase protein array analyses to profile FTI treatment-induced changes in global signaling, and conducted CRISPR/Cas9 genetic loss-of-function screens to identify previously unreported genes and pathways that modulate sensitivity to tipifarnib. Fourth, we determined that concurrent inhibition of HRAS effector signaling (ERK, PI3K, mTORC1) increased sensitivity to tipifarnib treatment, in part by overcoming tipifarnib-induced compensatory signaling. We also determined that ERK inhibition could block tipifarnib-induced epithelial-to-mesenchymal transition, providing a potential basis for the effectiveness of this combination. Our results support future investigations of these and other combination treatments for HRAS mutant HNSCC.


Conflict of interest statement

Conflict of interest statement:

M. Pierobon and EF Petricoin III are inventors on US Government and University assigned patents and patent applications. As inventors, they are entitled to receive royalties as provided by US Law and George Mason University policy. They receive royalties from TheraLink Technologies and are consultants to and/or shareholders of Avant Diagnostics, Inc. EF Petricoin III is also consultant and shareholder of Perthera, Inc. CJ Der is a consultant/advisory board member for Mirati Therapeutics, Deciphera 950 Pharmaceuticals and Anchiano Therapeutics. CJ Der has received research funding support from Mirati Therapeutics and Deciphera Pharmaceuticals. CJ Der has consulted for Ribometrix, Jazz Therapeutics, SVB Leerink, Axon Advisors LLC, Third Bridge, Sanofi, SmartAnalyst, Turning Point Therapeutics and Eli Lilly. AD Cox has consulted for Eli Lilly and Mirati Therapeutics. The remaining authors declare no conflicts of interest.

Figures

Figure 1:
Figure 1:. HRAS mutant HNSCC cell lines are dependent on HRAS for their growth and survival
A) Western blots showing knockdown of HRAS protein. HRAS mutant HNSCC cell lines were transduced with anti-HRAS or nontargeting (NT) control shRNA and selected in puromycin for 72 h. B) Anchorage-dependent 2D proliferation assay following HRAS knockdown. Cells were seeded in triplicate in 12-well plates and viability evaluated by MTT after 10 days. Data represent average +/− SD of three biological replicates. P values are averages of the individual P value of each shHRAS compared to shNT for each time point. *P<0.05 C) Quantification of anchorage-independent 3D colonies formed after HRAS knockdown. Cells were grown in Matrigel for 2 weeks, then stained with alamarBlue. P values as in (B). *P<0.05, **P<0.01, ***P<0.001 D) Representative 2D clonogenic assays showing colony formation after HRAS knockdown. Cells were plated in 6-well plates after lentiviral shRNA transduction and puromycin selection. After 10 days, colonies were stained with crystal violet. E) Histograms showing cell cycle distribution after HRAS knockdown. After 72 h of shRNA transduction and selection, cells were stained with propidium iodide and subjected to flow cytometry. F) Quantification of data shown in (E). Data represent average +/− SD of three biological replicates. P values are averages of the individual P value of each shHRAS compared to shNT. *P<0.05, **P<0.01, ***P<0.001 G) Quantification of apoptosis after HRAS knockdown. After 5 days, cells were stained with Annexin V-FITC and propidium iodide and quantified by flow cytometry. Data represent average +/− SD of three biological replicates. P values as in (F).
Figure 2:
Figure 2:. FTI treatment phenocopies HRAS knockdown and inhibits growth of HRAS mutant HNSCC
A) Western blot showing distribution of HRAS into detergent ("D", membrane) and aqueous ("A", cytosol) phases. Indicated HRAS mutant cells were treated with FTI tipifarnib or DMSO vehicle control for 24 hr and subjected to Triton X-114 phase separation. Nonfarnesylated proteins migrate more slowly (upper bands) than farnesylated proteins (lower bands). B) Western blot showing variable changes in HRAS abundance upon tipifarnib treatment. Cells treated as in panel (A). C) AlamarBlue assay quantifying cell viability after tipifarnib treatment for 5 days. Data are average +/− SD of three biological replicates. D) GI50 of tipifarnib in HRAS mutant HNSCC cell lines in panel (C). E) Representative 2D clonogenic assay showing quantified growth inhibition (% plate area covered by cells) after treatment with tipifarnib for 10 days. F) Quantification of 3D colonies formed in Matrigel after treatment with tipifarnib (187 nM). Data are average of two technical replicates. P value: treatment versus DMSO control. *P<0.05 G) Quantification of cell cycle distribution after treatment with tipifarnib. Data are average +/− SD of three biological replicates. P value: treatment versus DMSO control. *P<0.05, **P<0.01
Figure 3:
Figure 3:. HRAS depletion and tipifarnib treatment can cause compensatory upregulation of ERK MAPK and AKT signaling pathways; induction of morphological changes
A) Western blot showing increased levels of pERK1/2 and pAKT in some cell lines after HRAS knockdown. Cells were transduced with 3 different anti-HRAS shRNAs or NT control and selected in puromycin for 72 h prior to blotting for phosphorylated and total ERK and AKT. Densitometry was used to quantitate ratios of phosphorylated to total proteins ("Rel. proteins"), normalized to NT control. B) Heatmap showing the top 35 differentially regulated proteins or phosphoproteins in the indicated cells treated with tipifarnib or DMSO vehicle for 24 or 48 h. Cell lysates were subjected to RPPA analysis. Red: increase; blue: decrease. C) Western blots of HN30 cells showing signaling downstream of HRAS and RHEB after 24, 48 or 120 h of treatment with tipifarnib at the indicated concentrations. D) Immunofluorescence images showing expression and distribution of F-actin and E-cadherin in cells treated with tipifarnib (200 nM) or DMSO vehicle. In the merge image, F-actin is shown in magenta, E-cadherin in green and the nucleus in blue. Scale bar = 20 μm. E) Western blots showing expression of E-cadherin and vimentin after treatment as in (D).
Figure 4.
Figure 4.. CRISPR-Cas9 loss-of-function (LOF) screen identifies known and novel targets to sensitize cells to tipifarnib treatment
A) False discovery rate (FDR) for each gene in the CRISPR library at the 2 week time point. Top hits are highlighted in red. B) Fold change of gRNA against indicated genes in the library after 2 weeks of treatment. Data represented as median with range. C) False discovery rate (FDR) for each gene in the CRISPR library at the 4 week time point. Top hits are highlighted in red. D) Fold change for gRNA against indicated genes in the library after 4 weeks of treatment. Data represented as median with range. E) Western blot showing target inhibition of PI3K signaling pathway by PI3K-alpha inhibitor alpelisib. Cells were treated for 4 or 24 h at 100, 200 and 400 nM. F) Western blot showing target inhibition of ERK MAPK pathway by ERK1/2 inhibitor SCH772984. Cells were treated for 48 h at 100, 200 and 400 nM. G) Fold change in tipifarnib GI50 when combined with indicated concentrations of PI3K-alpha inhibitor alpelisib. P values: combination versus tipifarnib alone. *P<0.05, **P<0.01, ***P<0.001 H) Fold change in tipifarnib GI50 when combined with indicated concentrations of ERK1/2 inhibitor SCH772984. P values: combination versus tipifarnib alone. *P<0.05, **P<0.01, ***P<0.001 I) Bliss scores quantifying synergy between tipifarnib (1.5 nM - 10 μM) and PI3K-alpha inhibitor (50 - 800 nM). J) Bliss scores quantifying synergy between tipifarnib (1.5 nM - 10 μM) and ERK1/2 inhibitor (50 - 800 nM).
Figure 5:
Figure 5:. Combination of FTI tipifarnib with ERKi or PI3Ki enhances apoptosis and induces EMT in HRAS mutant HNSCC
A-D) Quantification of apoptosis in cells treated with low (10-20 nM, panels A,C) or high doses (187-750 nM, panels B,D) of tipifarnib and 100-400 nM of ERKi (SCH772984) or PI3Ki (alpelisib) for five days. Annexin-FITC positive cells were quantified and negative control DMSO values were subtracted. Data represent average +/− SD of three independent replicates. P value: combination versus tipifarnib alone. *P<0.05, **P<0.01, ***P<0.001 E) Western blots showing target inhibition of ERK1/2 and AKT. Cells were treated for 24 h with tipifarnib (200 nM) and ERKi (400 nM) or PI3Ki (400 nM) in cell lines displaying differential sensitivity profiles to the combinations. Densitometry was used to quantitate ratios of phosphorylated to total proteins ("Rel. proteins"), normalized to DMSO control. F) Immunofluorescence images showing expression and distribution of F-actin and E-cadherin in response to the combinations or drugs alone, treated as in (E). In the merge image, F-actin is shown in magenta, E-cadherin in green and the nucleus in blue. Scale bar = 20 μm. G) Western blots showing expression of E-cadherin and vimentin in response to the combinations or drugs alone, treated as in (E).
Figure 6:
Figure 6:. Inhibition of mTOR/S6 activity is critical to cause cell death in response to tipifarnib treatment of refractory cells
A-B) Quantification of apoptosis in tipifarnib-refractory UMSCC4 cells. Cells were treated for 5 days with the indicated doses of tipifarnib and (A) the PI3Kalpha-selective inhibitor alpelisib or (B) the ERK1/2-selective inhibitor, SCH772984. Annexin-FITC positive cells were quantified and normalized to control. Data represent the average of three independent replicates; values above zero are shown. C) Fold change in mTOR and mTOR-regulated signaling showing increases in activity only in tipifarnib-refractory cells. Indicated cell lines were treated with tipifarnib and subjected to RPPA analysis as in Fig 3B. D) Western blot showing target inhibition of mTOR signaling. UMSCC4 cells were treated with mTORCi rapamycin (15 nM) or everolimus (25 nM) for 24 h. E-F) Apoptosis assays showing increased efficacy of tipifarnib in refractory cells in the presence of mTORCi. UMSCC4 cells were treated with tipifarnib alone or in combination with rapamycin or everolimus. Data represent the average +− SD of three independent replicates. *P<0.05, **P<0.01, ***P<0.001 G-H) Bliss scores quantifying synergy between tipifarnib (10-750 nM) and mTOR inhibitors rapamycin (15 nM) and everolimus (25 nM).

Similar articles

Cited by

References

    1. Cox AD, Fesik SW, Kimmelman AC, Luo J, Der CJ. Drugging the undruggable RAS: Mission possible? Nat Rev Drug Discov 2014;13:828–51 - PMC - PubMed
    1. Ahearn IM, Haigis K, Bar-Sagi D, Philips MR. Regulating the regulator: post-translational modification of RAS. Nat Rev Mol Cell Biol 2011;13:39–51 - PMC - PubMed
    1. End DW, Smets G, Todd AV, Applegate TL, Fuery CJ, Angibaud P, et al. Characterization of the antitumor effects of the selective farnesyl protein transferase inhibitor R115777 in vivo and in vitro. Cancer Res 2001;61:131–7 - PubMed
    1. Liu M, Bryant MS, Chen J, Lee S, Yaremko B, Lipari P, et al. Antitumor activity of SCH 66336, an orally bioavailable tricyclic inhibitor of farnesyl protein transferase, in human tumor xenograft models and wap-ras transgenic mice. Cancer Res 1998;58:4947–56 - PubMed
    1. Cox AD, Der CJ, Philips MR. Targeting RAS Membrane Association: Back to the Future for Anti-RAS Drug Discovery? Clin Cancer Res 2015;21:1819–27 - PMC - PubMed

Publication types

MeSH terms

Substances