. 2022 May 13;28(10):2131-2146.
doi: 10.1158/1078-0432.CCR-21-3145.

Single-cell Characterization of the Cellular Landscape of Acral Melanoma Identifies Novel Targets for Immunotherapy

Affiliations

Single-cell Characterization of the Cellular Landscape of Acral Melanoma Identifies Novel Targets for Immunotherapy

Jiannong Li et al. Clin Cancer Res. .

Abstract

Purpose: Acral melanoma is a rare subtype of melanoma that arises on the non-hair-bearing skin of the palms, soles, and nail beds. In this study, we used single-cell RNA sequencing (scRNA-seq) to map the transcriptional landscape of acral melanoma and identify novel immunotherapeutic targets.

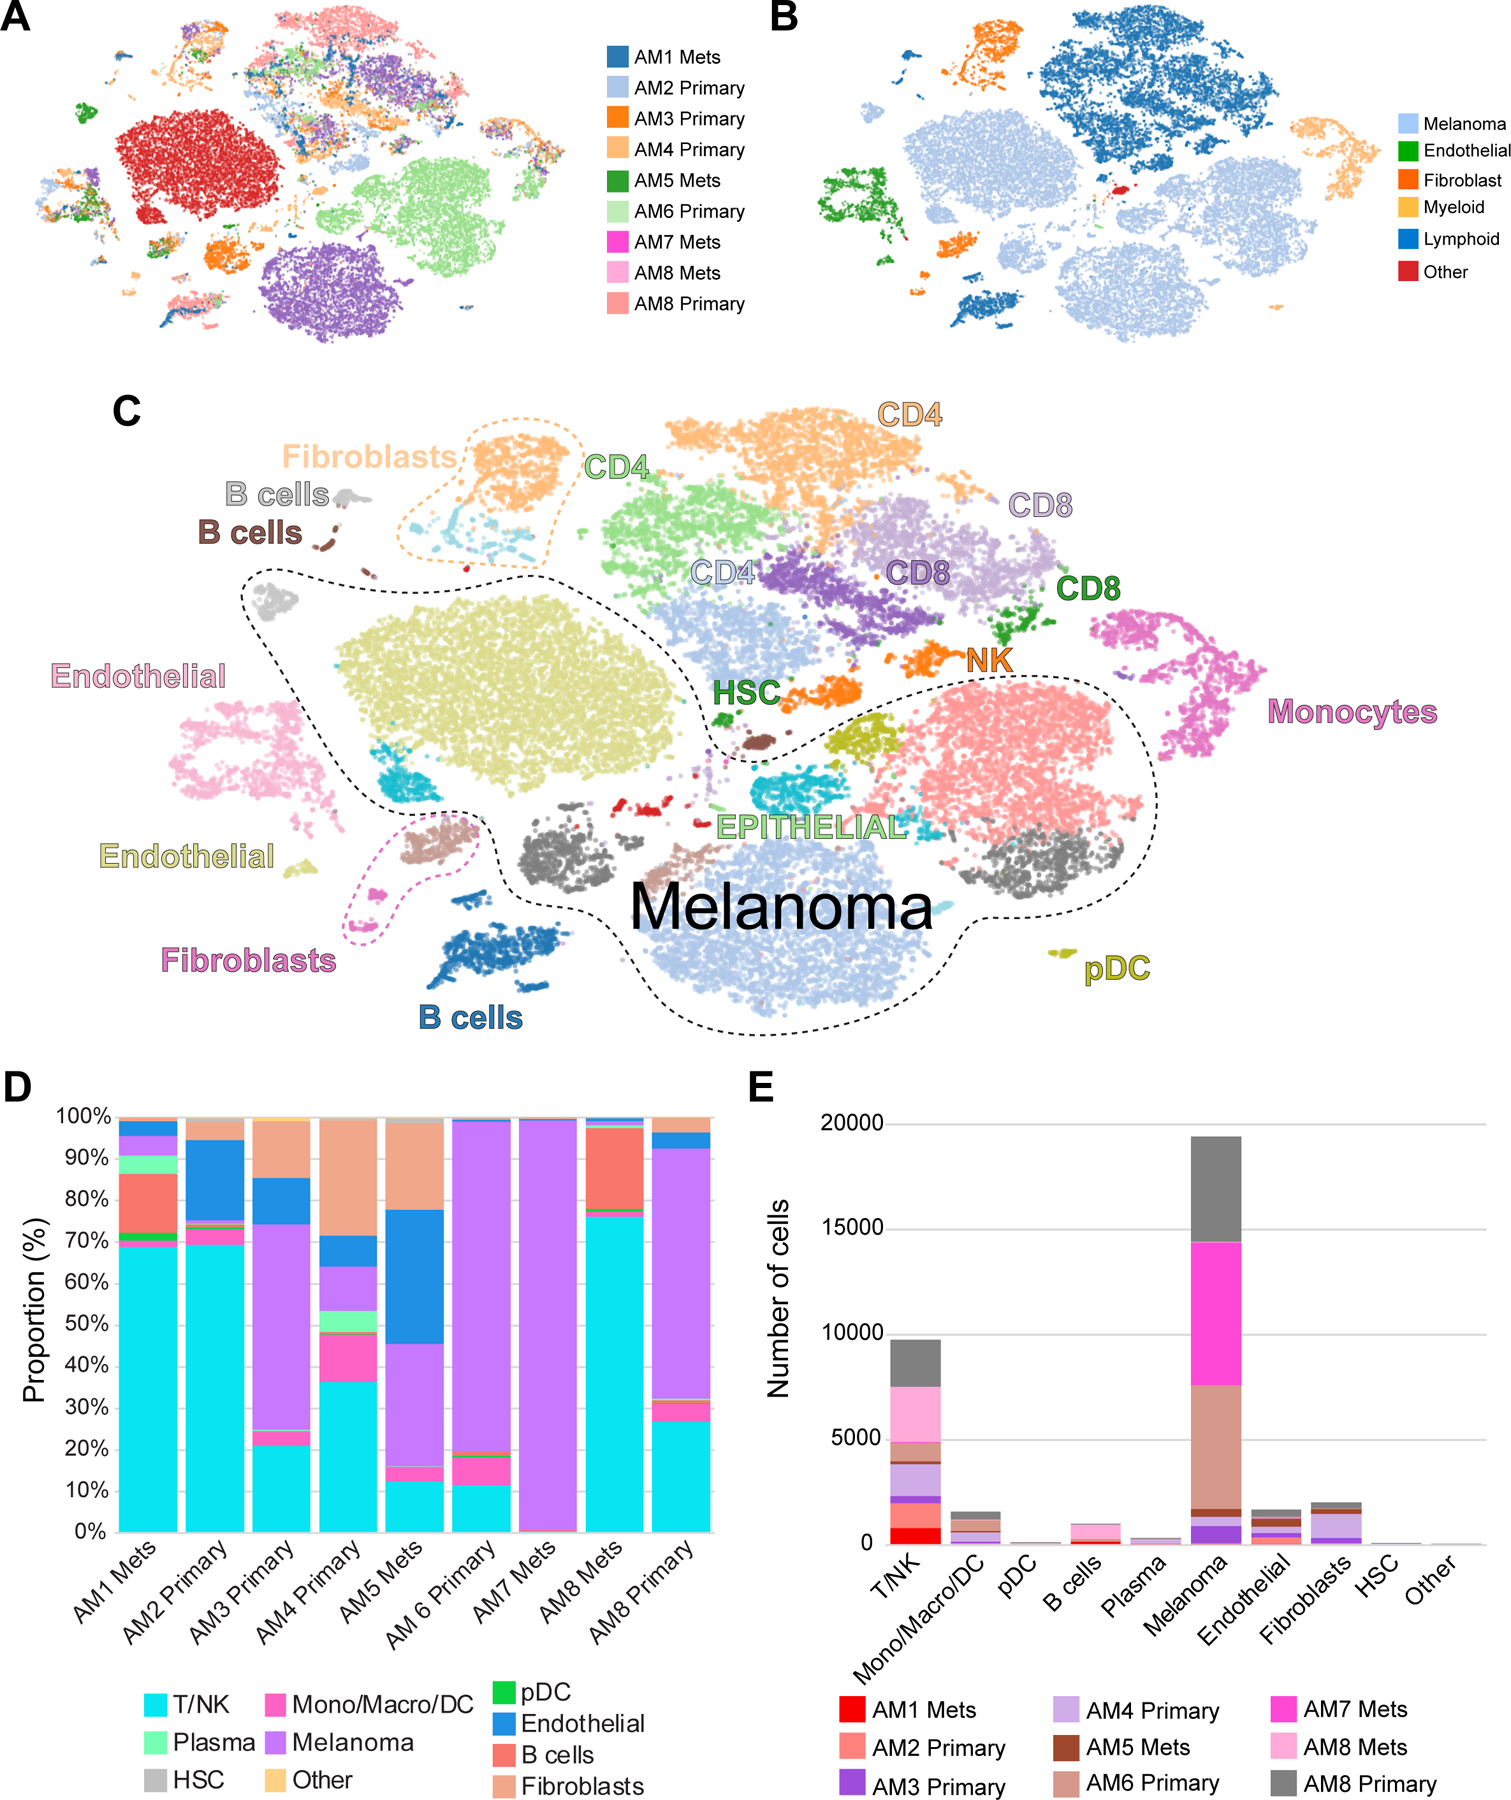
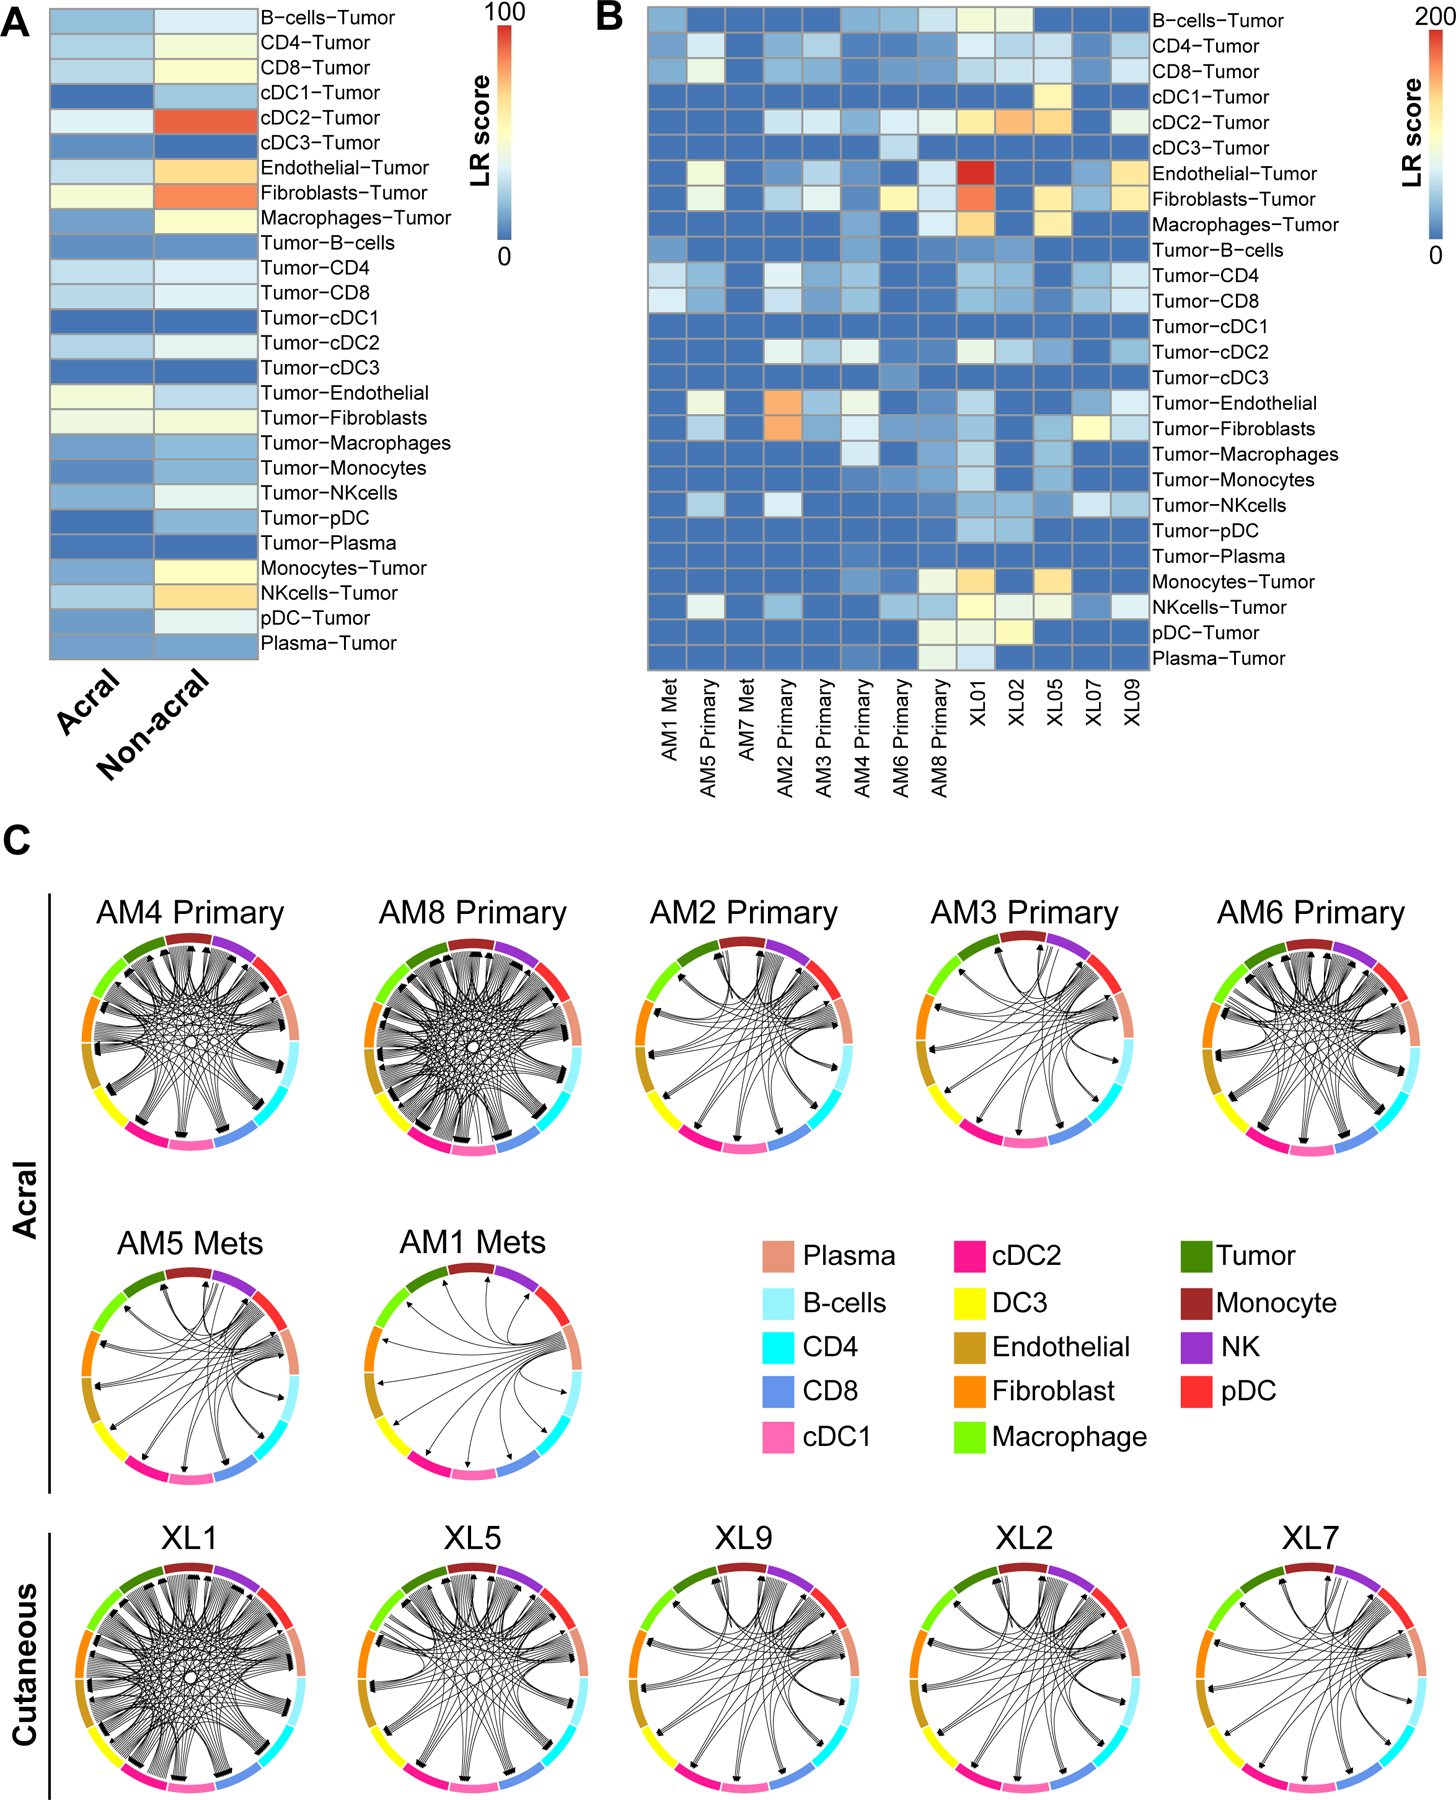
Experimental design: We performed scRNA-seq on nine clinical specimens (five primary, four metastases) of acral melanoma. Detailed cell type curation was performed, the immune landscapes were mapped, and key results were validated by analysis of The Cancer Genome Atlas (TCGA) and single-cell datasets. Cell-cell interactions were inferred and compared with those in nonacral cutaneous melanoma.

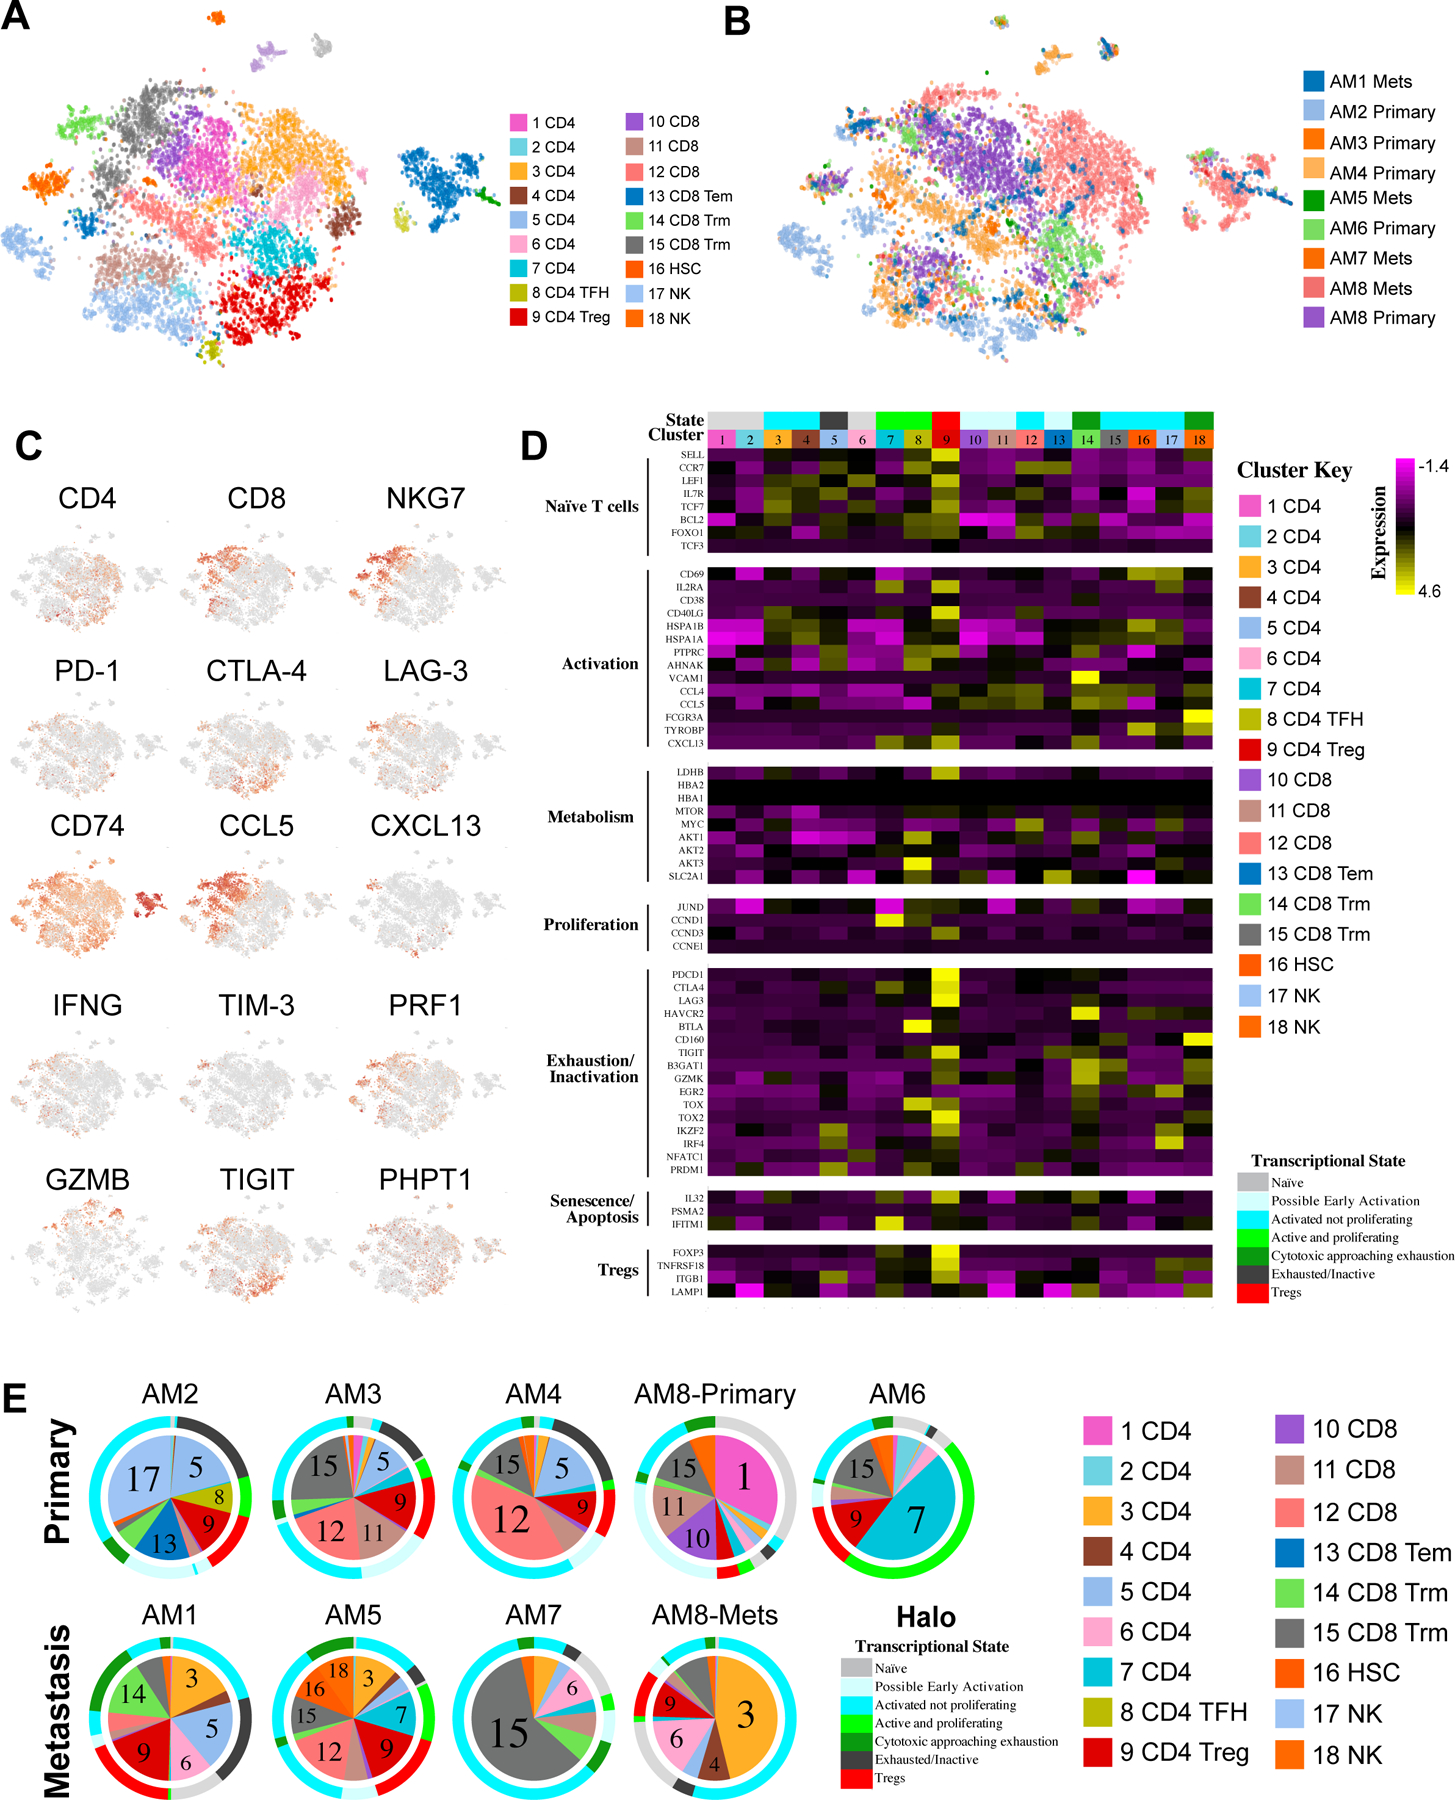
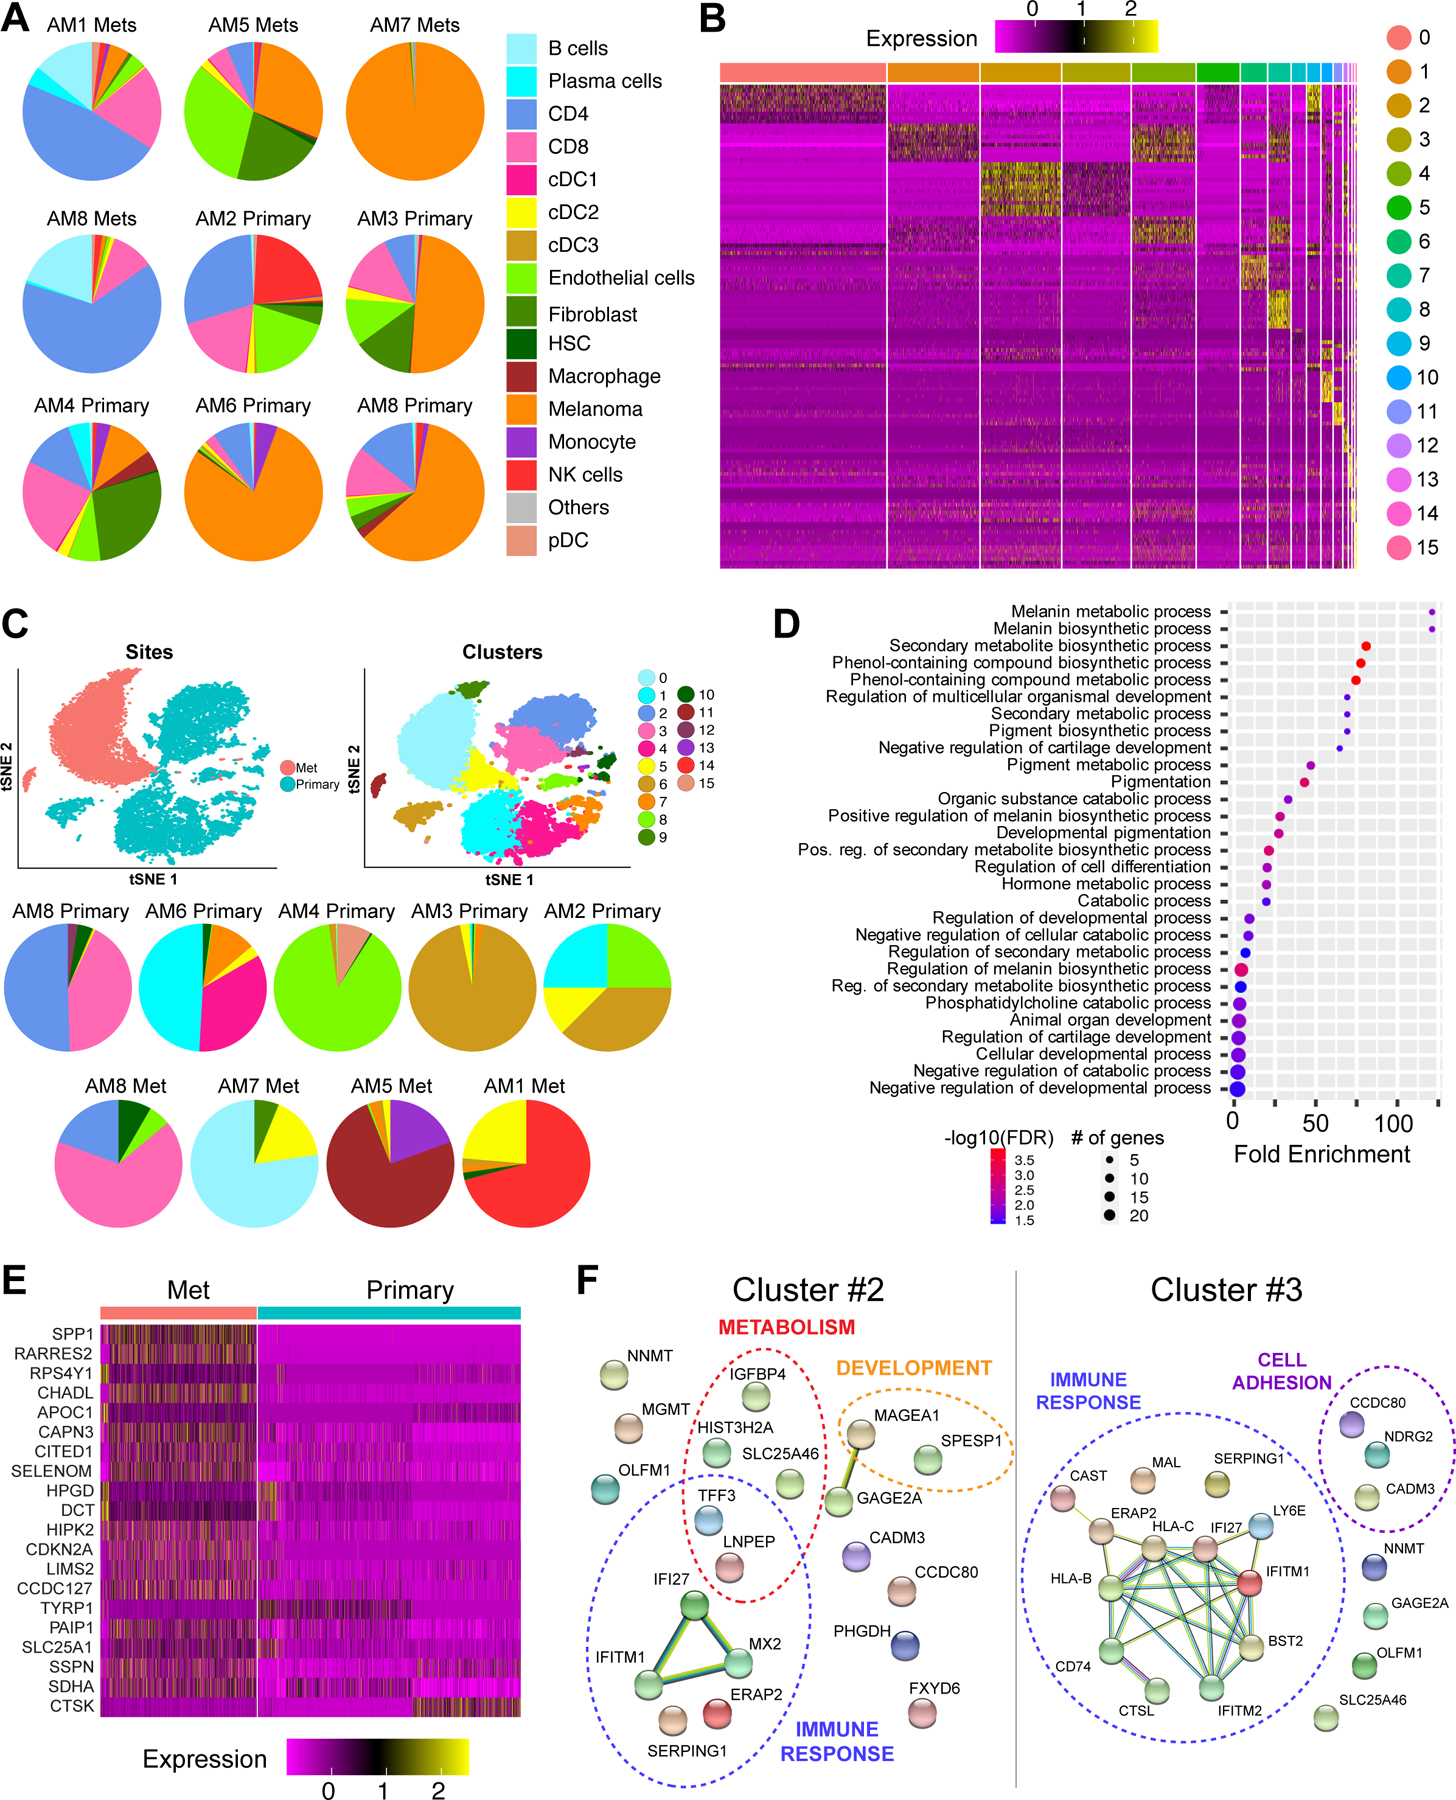
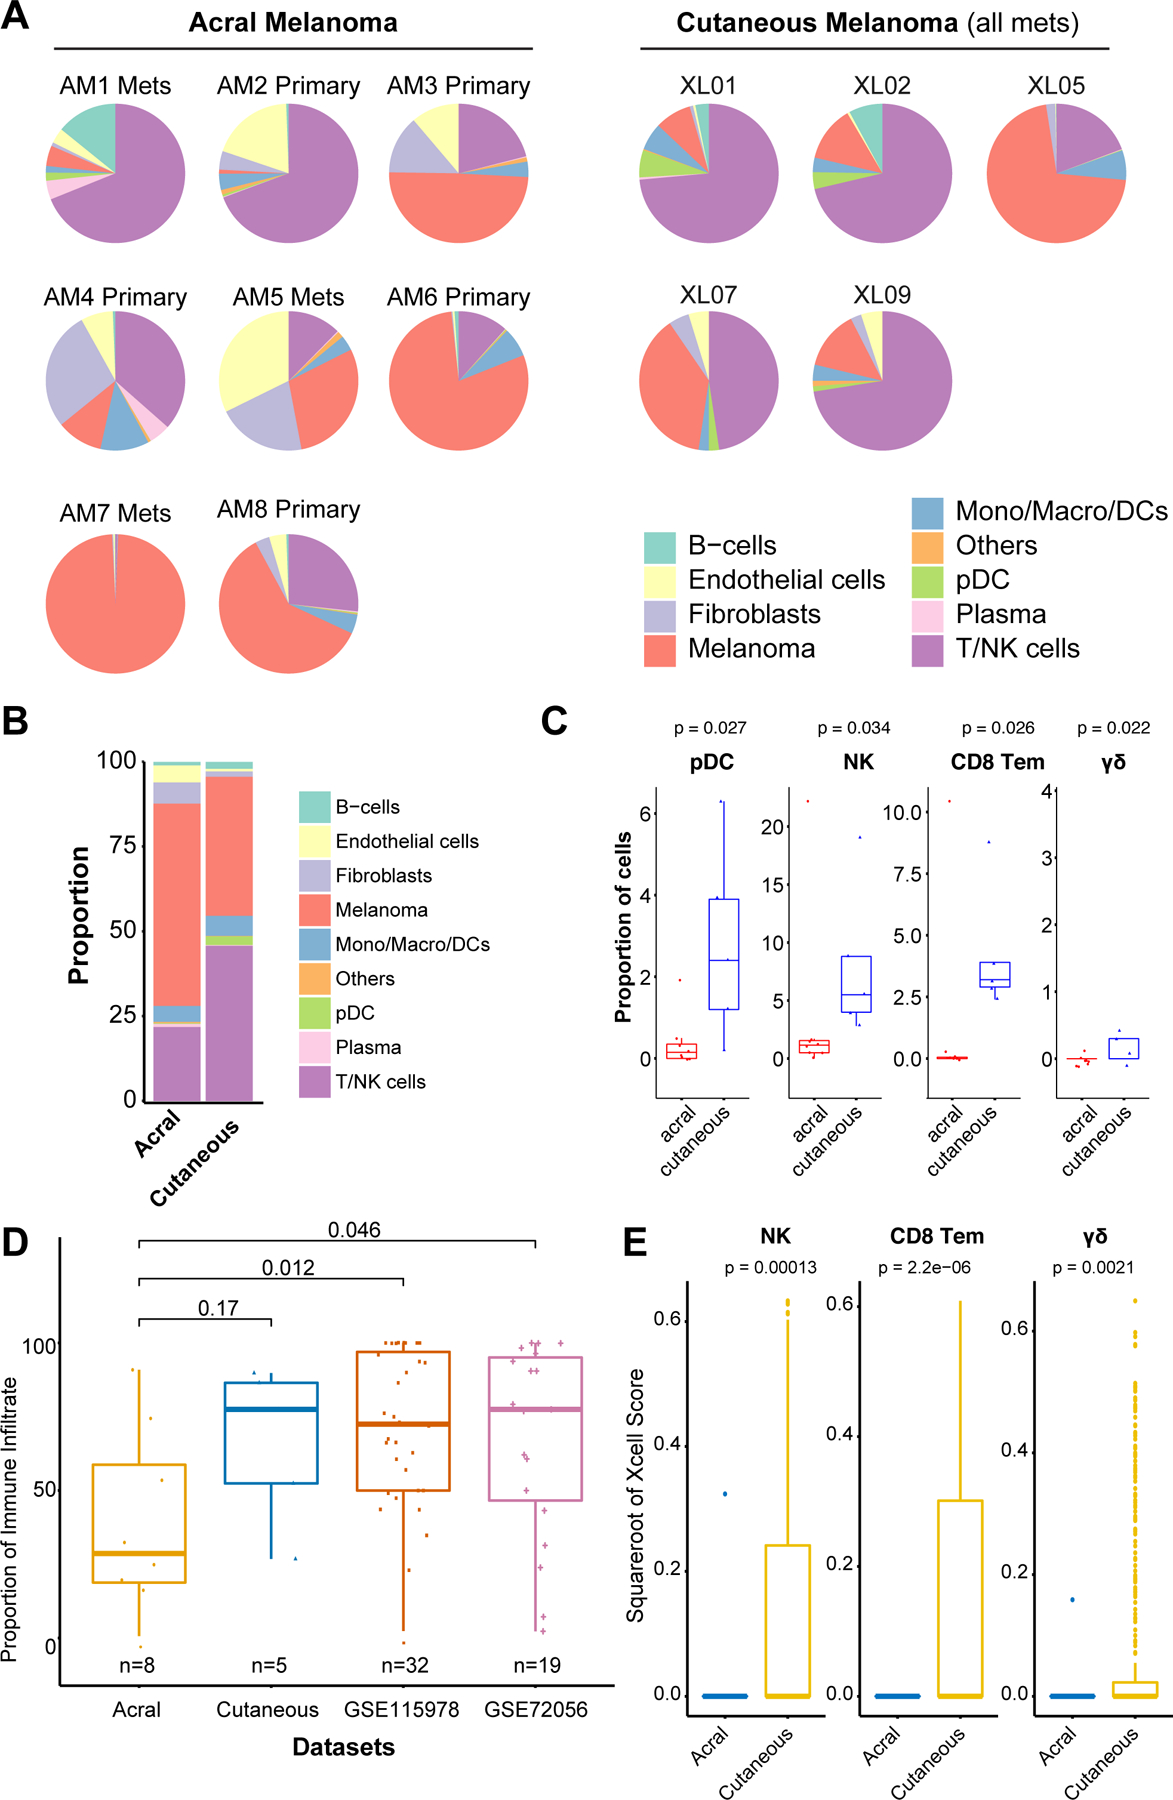
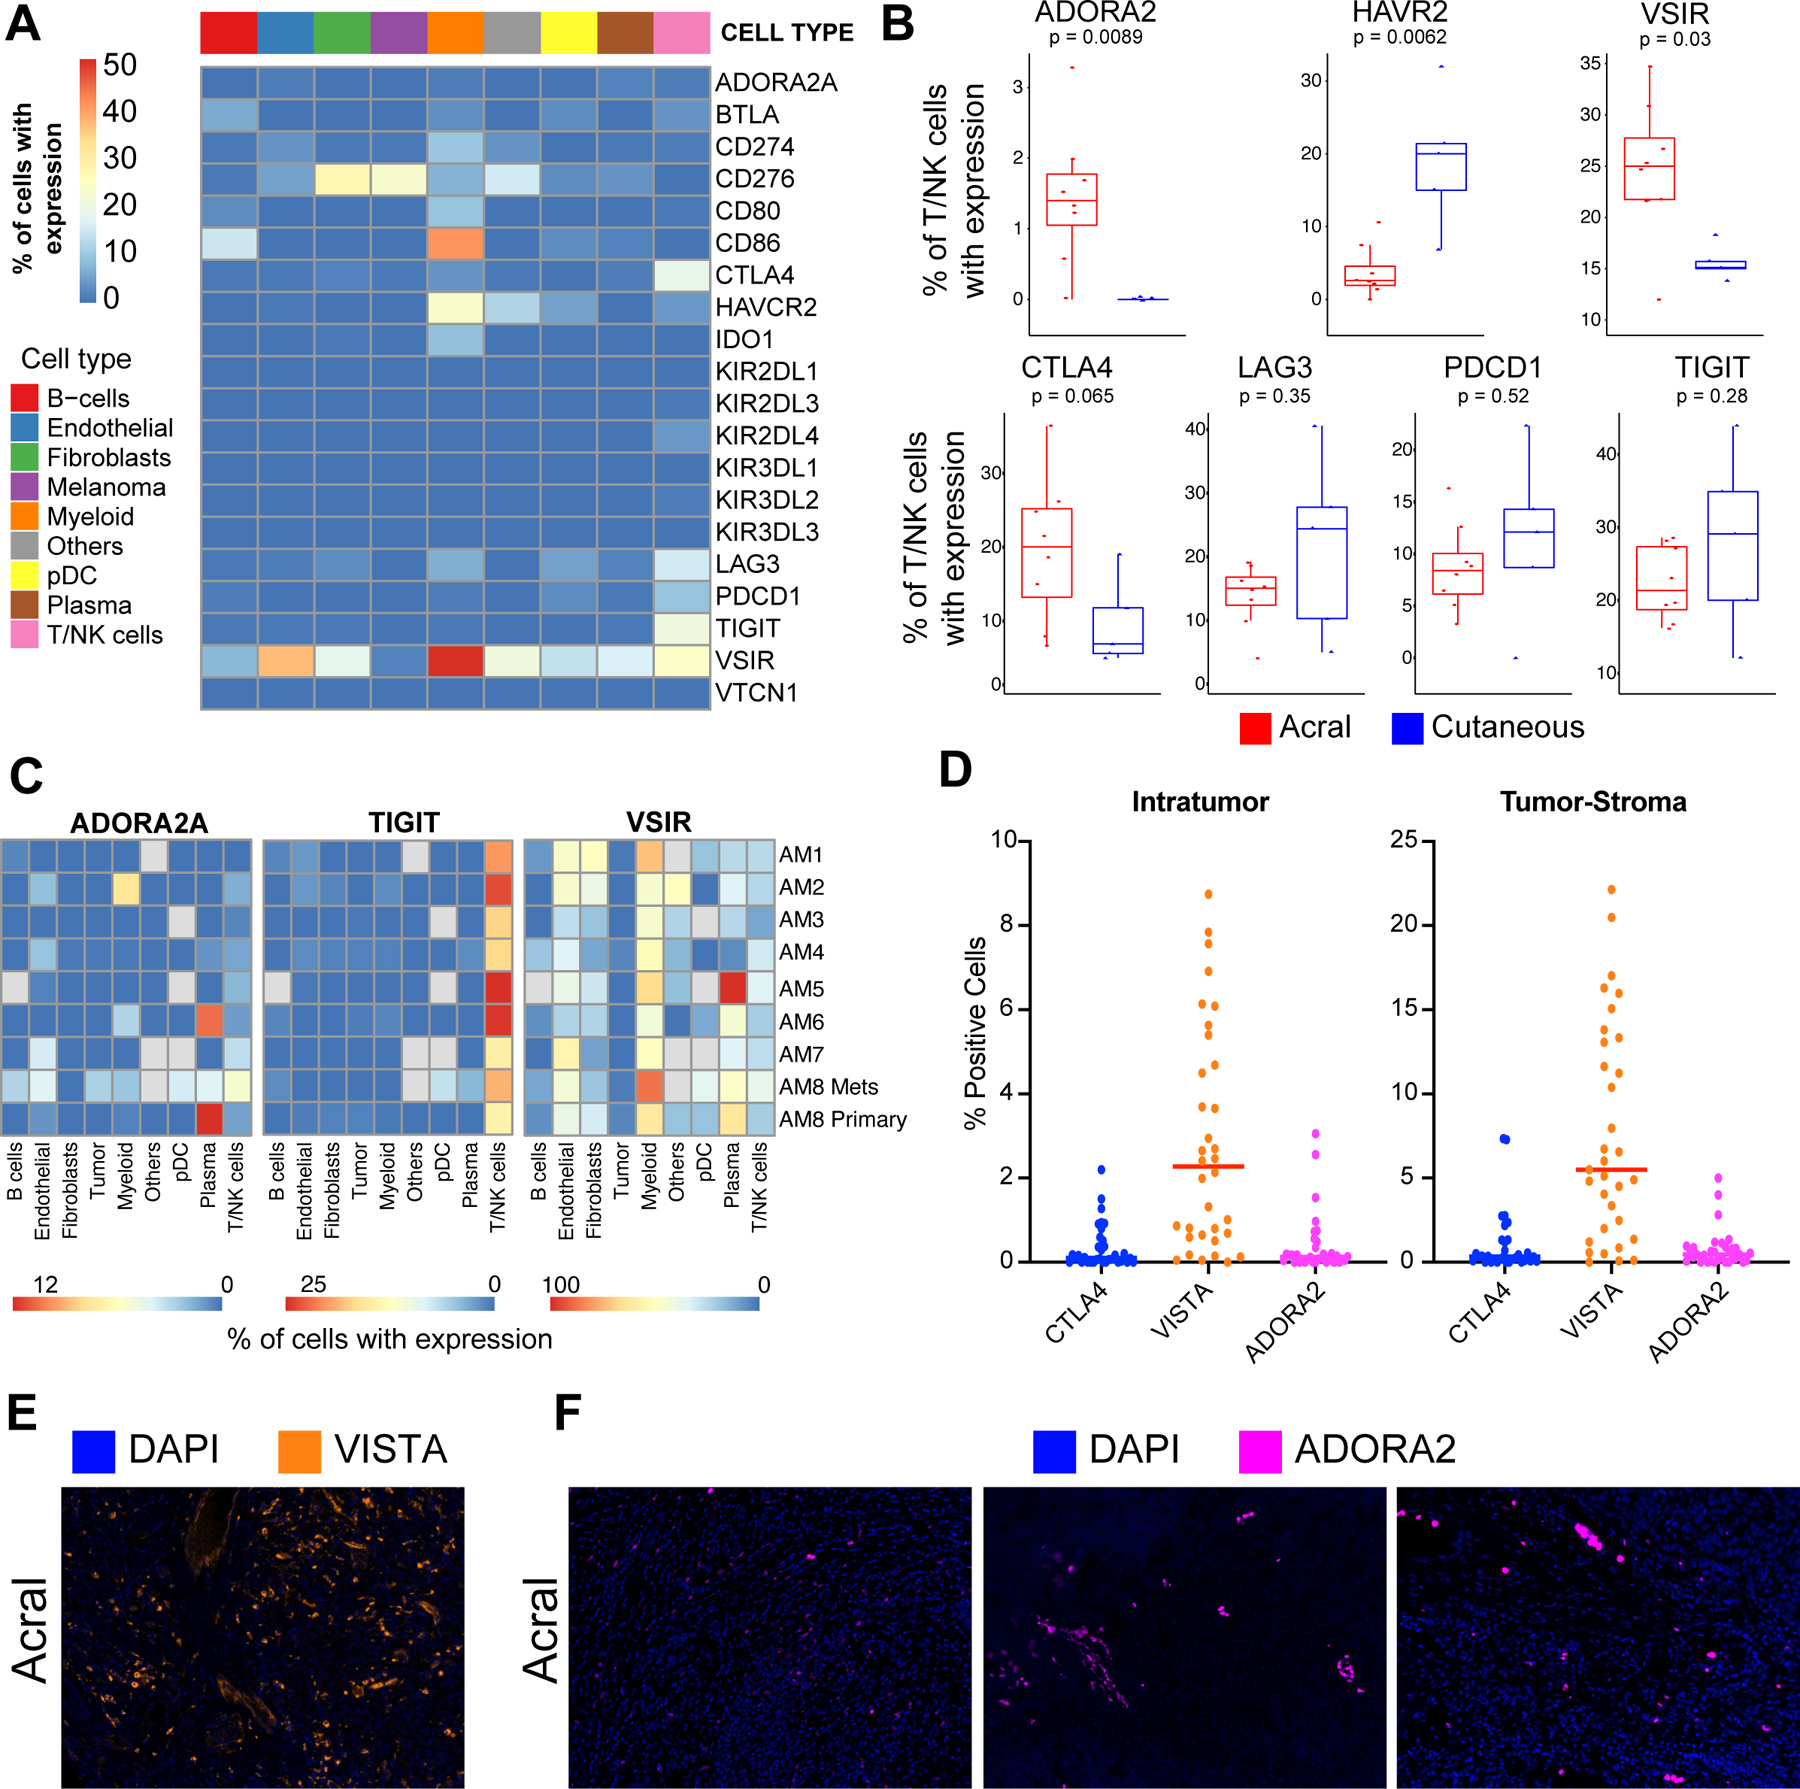
Results: Multiple phenotypic subsets of T cells, natural killer (NK) cells, B cells, macrophages, and dendritic cells with varying levels of activation/exhaustion were identified. A comparison between primary and metastatic acral melanoma identified gene signatures associated with changes in immune responses and metabolism. Acral melanoma was characterized by a lower overall immune infiltrate, fewer effector CD8 T cells and NK cells, and a near-complete absence of γδ T cells compared with nonacral cutaneous melanomas. Immune cells associated with acral melanoma exhibited expression of multiple checkpoints including PD-1, LAG-3, CTLA-4, V-domain immunoglobin suppressor of T cell activation (VISTA), TIGIT, and the Adenosine A2A receptor (ADORA2). VISTA was expressed in 58.3% of myeloid cells and TIGIT was expressed in 22.3% of T/NK cells.

Conclusions: Acral melanoma has a suppressed immune environment compared with that of cutaneous melanoma from nonacral skin. Expression of multiple, therapeutically tractable immune checkpoints were observed, offering new options for clinical translation.


Conflict of interest statement

Conflicts of interest:

Dr. Sarnaik is a co-inventor on a patent application with Provectus Biopharmaceuticals and has received consulting fees from Iovance Biotherapeutics, Guidepoint, Defined Health, Huron Consulting Group, KeyQuest Health Inc, and Gerson Lehrman Group and speaker fees from Physicians’ Educational Resource (PER) LLC, Medscape and Medstar Health. Dr. Sondak is a consultant for Bristol Myers Squibb, Eisai, Merck, Novartis, Regeneron and Replimune and receives research funding unrelated to this topic from Neogene Therapeutics. Dr. Koomen receives salary support from Bristol Myers Squibb unrelated to this work. Dr. Tarhini reports Consulting/Advisory Board Participation: Merck, Bristol Myers Squibb, Novartis, Genentech-Roche, Partner Therapeutics, Sanofi-Genzyme, Regeneron, Eisai and Clinigen. He also has support for contracted research from OncoSec, Clinigen, Genentech-Roche, Bristol Myers Squibb, Nektar Therapeutics, Sanofi-Genzyme, Regeneron, Navigate. Dr Khushalani is a paid advisor for Array Biopharma, Bristol Myers Squibb, EMD Serono, Genentech, HUYA Bioscience International, Nektar, Regeneron, Immunocore, Merck, Astra Zeneca, Incyte and Jounce. He receives research funding from HUYA Bioscience International, Regeneron, Merck, Amgen, Celgene, GlaxoSmithKline, Novartis, Replimune, and BMS. All other authors have no conflicts of interest.

Figures

Figure 1.
Figure 1.. Defining the cellular landscape of acral melanomas.
A, t-SNE plots showing cellular landscapes based on sample of origin. B, t-SNE plots showing cellular landscapes based on major cell types. C, t-SNE plots showing cellular landscapes based on detailed cell typing. D, Proportion of cells from major cell types identified from each sample. E, Number of cells from the major cell types identified in each sample.
Figure 2.
Figure 2.. The T and NK cell landscape of acral melanoma.
A, t-SNE analysis showing distribution of T and NK cell clusters across all samples. B, t-SNE analysis showing distribution of cells based on sample of origin. C, Expression of key T cell activation markers and immune checkpoints across all samples. D, Expression of T and NK cell markers associated with active/exhausted/proliferative transcriptional states across the subsets of T and NK cells. E, Pie charts show proportions of T and NK cell composition by sample. Colored halo indicates predicted activation/exhaustion/proliferative status of each T and NK cell sub-cluster based on gene-expression profiles across all samples.
Figure 3.
Figure 3.. Tumor cell heterogeneity in acral and cutaneous melanomas.
A, Pie charts show proportions of major cell subpopulations in each primary and metastatic sample. B, Unsupervised clustering identified 16 clusters of melanoma cells across all acral melanoma samples based on gene-expression profiles. C, t-SNE analysis (top) and pie charts (bottom) show melanoma heterogeneity across primary and metastatic samples. D, ShinyGO Gene Ontology enrichment analysis of genes differentially expressed between primary and metastatic acral melanoma samples, showing the major functional pathways affected. E, Heatmap shows genes differentially expressed in melanoma cells between primary and metastatic acral cutaneous melanoma samples. F, String analysis of top 20 differentially expressed genes associated with cluster 2 and cluster 5 of melanoma cells (ranked based on differential expression and proportion of cells expressing each marker). Each sphere represents a protein product of each gene marker and the lines represent known interactions among the protein products of each gene. Dotted lines group markers with known roles in similar biological processes.
Figure 4.
Figure 4.. Comparing immune landscapes between acral and non-acral cutaneous melanoma
A, Pie charts show proportions of major immune cell subpopulations in individual acral and cutaneous melanoma samples. B, The average proportion of the major immune cell subpopulations in acral and non-acral cutaneous melanoma sample cohorts. C, Boxplots showing proportion of immune cell subpopulations which are differentially represented between acral and non-acral cutaneous melanoma sample cohorts (Wilcoxon test). D, Heatmap of normalized xCell Scores from analysis of acral and non-acral cutaneous melanoma specimens in the TCGA dataset. F, Boxplots showing proportion of γδ T cells, NK cells and CD8 T effector memory cells in acral and non-acral cutaneous melanoma specimens in the TCGA dataset (Wilcoxon test).
Figure 5.
Figure 5.. Cell-cell interactions in cutaneous acral and non-acral melanomas.
A, Heatmap showing the mean LR scores from SingleCellSignalR cell-cell interaction analysis of acral and non-acral cutaneous melanoma specimens. B, Heatmap showing the LR scores from SingleCellSignalR analysis of individual acral and non-acral cutaneous melanoma specimens. C, Circos plots showing the mean cell-cell interactions in non-acral cutaneous and acral melanoma samples.
Figure 6.
Figure 6.. Immune checkpoint expression in acral and non-acral cutaneous melanomas.
A, Heatmap showing the average expression of immune checkpoint receptors across major immune cell populations in acral melanoma samples. B, Boxplots showing expression of major immune checkpoints between acral and non-acral cutaneous melanoma sample cohorts (Wilcoxon test). C, Heatmaps showing proportion of cells expressing ADORA2, TIGIT and VISTA across cell types in individual samples of acral melanoma. D, Quantification of immunofluorescent staining of ADORA2, VISTA and CTLA4 checkpoints in acral melanomas, showing number of cells positive for each marker according to location within the tumor. E, Representative images of the immunofluorescent staining of VISTA in acral melanoma samples. F, Representative images of the immunofluorescent staining of ADORA2 in acral melanoma samples.

References

    1. Chen YA, Teer JK, Eroglu Z, Wu JY, Koomen JM, Karreth FA, et al. Translational pathology, genomics and the development of systemic therapies for acral melanoma. Semin Cancer Biol 2020;61:149–57 doi 10.1016/j.semcancer.2019.10.017. - DOI - PMC - PubMed
    1. Bradford PT, Goldstein AM, McMaster ML, Tucker MA. Acral lentiginous melanoma: incidence and survival patterns in the United States, 1986–2005. Arch Dermatol 2009;145(4):427–34 doi 10.1001/archdermatol.2008.609. - DOI - PMC - PubMed
    1. Smalley KSM, Teer JK, Chen YA, Wu JY, Yao J, Koomen JM, et al. A Mutational Survey of Acral Nevi. JAMA Dermatol 2021;157(7):831–5 doi 10.1001/jamadermatol.2021.0793. - DOI - PMC - PubMed
    1. Newell F, Wilmott JS, Johansson PA, Nones K, Addala V, Mukhopadhyay P, et al. Whole-genome sequencing of acral melanoma reveals genomic complexity and diversity. Nat Commun 2020;11(1):5259 doi 10.1038/s41467-020-18988-3. - DOI - PMC - PubMed
    1. Liang WS, Hendricks W, Kiefer J, Schmidt J, Sekar S, Carpten J, et al. Integrated genomic analyses reveal frequent TERT aberrations in acral melanoma. Genome Res 2017;27(4):524–32 doi 10.1101/gr.213348.116. - DOI - PMC - PubMed

Publication types

Substances