. 2022 Mar 5;22(1):78.
doi: 10.1186/s12890-022-01867-6.

Lung damage created by high tidal volume ventilation in rats with monocrotaline-induced pulmonary hypertension

Affiliations

Lung damage created by high tidal volume ventilation in rats with monocrotaline-induced pulmonary hypertension

Masako Kawai et al. BMC Pulm Med. .

Abstract

Background: Rats with chronic hypoxia-induced non-inflammatory pulmonary hypertension (PH) are resistant to ventilator-induced lung injury. We investigated the effect of high tidal volume ventilation in another model of PH, monocrotaline (MCT)-induced PH, which is a type of inflammatory PH.

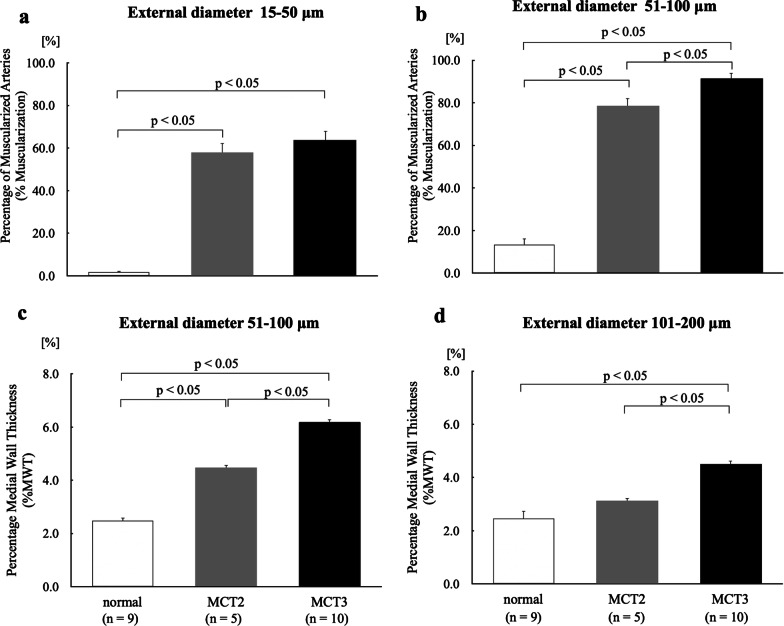
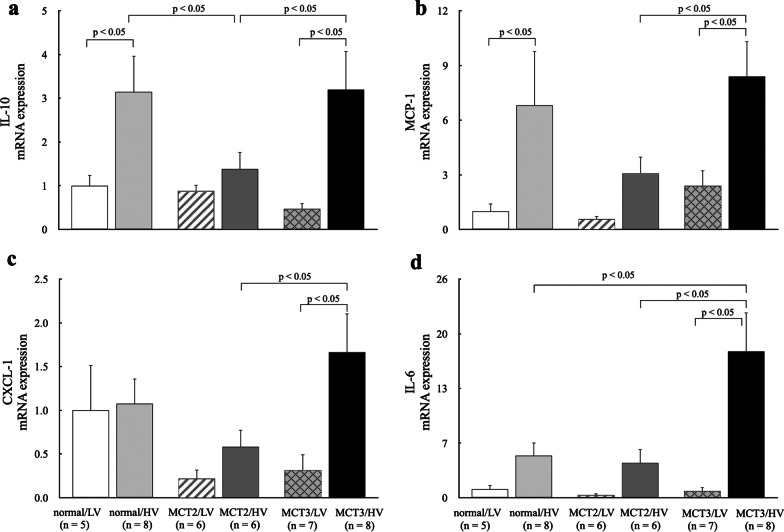
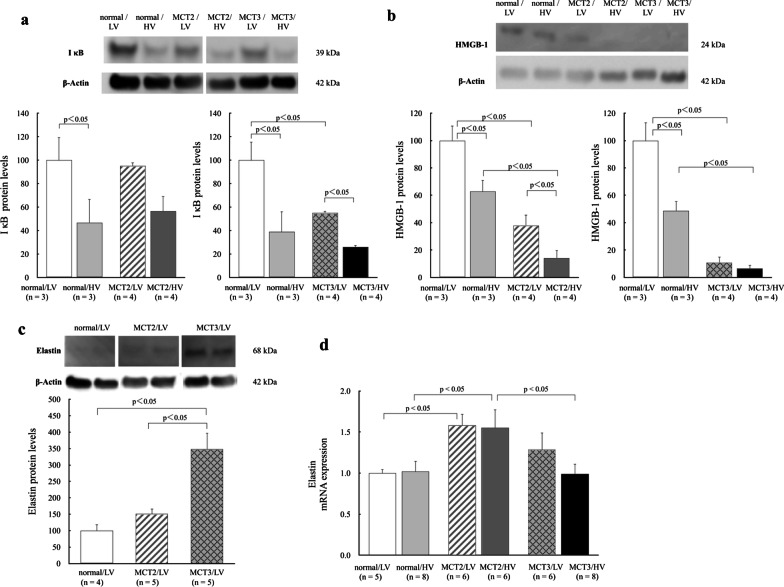
Methods: PH was induced in rats by subcutaneous injection with 60 mg/kg MCT. Normal control rats, rats at 2 weeks after MCT injection (MCT2), and rats at 3 weeks after MCT injection (MCT3) were ventilated with low tidal volume (LV, 6 mL/kg) or high tidal volume (HV, 35 mL/kg) for 2 h with room air without positive end-expiratory pressure. Arterial oxygen pressure (PaO2) and Evans blue dye (EBD) extravasation were measured. Hypertensive pulmonary vascular remodeling was assessed morphometrically by the percentage of muscularized peripheral pulmonary arteries (%Muscularization) and the media wall thickness to external diameter ratio, namely percentage medial wall thickness (%MWT). To assess inflammation, lung IκB protein and cytokine mRNA expression levels were assessed.

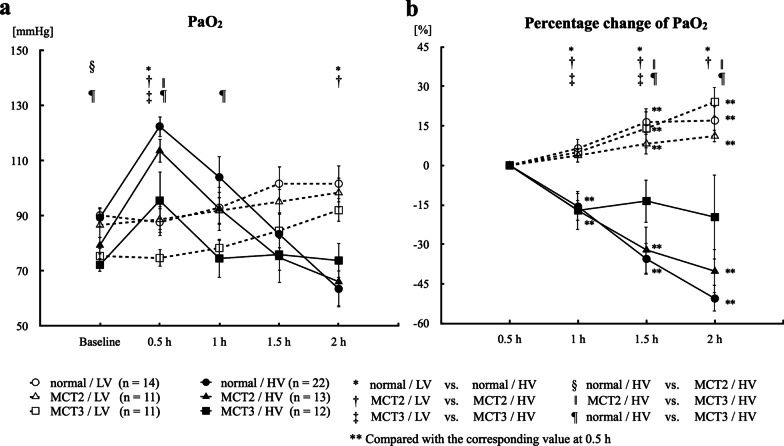
Results: Baseline mean pulmonary arterial pressure was significantly higher in MCT rats (normal, 15.4 ± 0.5 mmHg; MCT2, 23.7 ± 0.9; and MCT3, 34.5 ± 1.5). After 2-h ventilation, PaO2 was significantly lower in the HV groups compared with the LV groups in normal and MCT2 rats, but not in MCT3 rats. Impairment of oxygenation with HV was less in MCT3 rats compared with normal and MCT2 rats. Among the HV groups, MCT3 rats showed significantly lower levels of EBD extravasation than normal and MCT2 rats. HV significantly downregulated IκB protein expression in normal and MCT3 rats and increased IL-6, MCP-1, CXCL-1 (MIP-1), and IL-10 mRNA levels in MCT3 rats. %Muscularization, %MWT, and the expression of lung elastin were significantly higher in MCT3 rats than in normal and MCT2 rats.

Conclusion: We found that HV-associated damage might be reduced in MCT-induced PH rats compared with normal rats. The results of this and earlier studies suggest that hypertensive pulmonary vascular structural changes might be protective against the occurrence of ventilator-induced lung injury, irrespective of the etiology of PH.

Keywords: Mechanical ventilation; Monocrotaline; Pulmonary hypertension; Ventilator-induced lung injury.


Conflict of interest statement

The authors declare that they have no competing interests.

Figures

Fig. 1
Fig. 1
Arterial oxygen pressure (PaO2) and percentage change of PaO2. a PaO2. b Percentage change of PaO2 at 1, 1.5, and 2 h, taking the value at 0.5 h as a reference. MCT2: rats at 2 weeks after monocrotaline injection; MCT3: rats at 3 weeks after monocrotaline injection; LV: low tidal volume (6 mL/kg); HV: high tidal volume (35 mL/kg); Baseline: immediately after the assignment of experimental tidal volume; 0.5, 1, 1.5, and 2 h: time after the assignment of experimental tidal volume (6 or 35 mL/kg). Bars indicate mean ± standard error. n = number of rats
Fig. 2
Fig. 2
Evans blue dye (EBD) extravasation and the percentage of lung water content. a EBD extravasation, an estimate of protein permeability. b The lung dry-to-wet weight ratio, an estimate of lung water content. MCT2: rats at 2 weeks after monocrotaline injection; MCT3: rats at 3 weeks after monocrotaline injection; LV: low tidal volume (6 mL/kg); HV: high tidal volume (35 mL/kg); a.u.: arbitrary units. Bars indicate mean ± standard error. n = number of rats
Fig. 3
Fig. 3
Mean pulmonary arterial pressure (mPAP), peak inspiratory airway pressure (PIP), and RV/ (LV + S) ratio. a mPAP. b PIP. c right ventricular weight (RV)/left ventricular plus septal weight (LV + S) ratio (RV/[LV + S] ratio), an estimate of right ventricular hypertrophy. MCT2: rats at 2 weeks after monocrotaline injection; MCT3: rats at 3 weeks after monocrotaline injection; LV: low tidal volume (6 mL/kg); HV: high tidal volume (35 mL/kg); Baseline: immediately after the assignment of experimental tidal volume; 0.5, 1, 1.5, and 2 h: time after assignment of experimental tidal volume (6 or 35 mL/kg); −0 h (6 mL) (b): PIP before the assignment of experimental tidal volume while all rats were ventilated with a tidal volume of 6 mL/kg; + 2 h (6 mL) (b): PIP when returning to 6 mL/kg from 35 mL/kg after the end of 2-h ventilation. Bars indicate mean ± standard error. n = number of rats
Fig. 4
Fig. 4
Light micrographs of peripheral pulmonary arteries and muscularized arteries. a, b, c Peripheral pulmonary arteries. There was no apparent muscle layer in the peripheral pulmonary arteries of normal rats (a). Monocrotaline (MCT)-induced new muscularization of normally non-muscularized arteries (b, c). Arrows b, c denote new muscularization in MCT rats. d, e, f Muscularized arteries with an external diameter of 51–100 μm. g, h, i Muscularized arteries with an external diameter of 101–200 μm. e, f, h, i MCT-induced medial hypertrophy of small muscularized arteries. Medial wall thickness was high in small muscularized arteries with an external diameter of 101–200 μm i in MCT3 rats. Arrows denote the muscle layer. j, k, l The numbers of macrophages and neutrophils in MCT-injected rats were increased in MCT2 (k) and MCT3 (l) rats as compared with the normal group (j). MCT2: rats at 2 weeks after MCT injection; MCT3: rats at 3 weeks after MCT injection
Fig. 5
Fig. 5
Vascular structural changes at 2 and 3 weeks after monocrotaline injection. a Percentage of muscularized arteries (%Muscularization) of peripheral pulmonary arteries with an external diameter of 15–50 μm. b %Muscularization of peripheral pulmonary arteries with an external diameter of 51–100 μm. c Percentage medial wall thickness (%MWT) of muscularized arteries with an external diameter of 51–100 μm. d %MWT of muscularized arteries with an external diameter of 101–200 μm. MCT2: rats at 2 weeks after monocrotaline injection; MCT3: rats at 3 weeks after monocrotaline injection. Bars indicate mean ± standard error. n = number of rats
Fig. 6
Fig. 6
Real-time PCR analysis of cytokine and chemokine mRNA levels in lung tissue in rats. a Interleukin (IL)-10. b Monocyte chemotactic protein-1 (MCP-1). c Chemokine CXCL-1/KC (MIP-1). d IL-6. MCT2: rats at 2 weeks after monocrotaline injection; MCT3: rats at 3 weeks after monocrotaline injection; LV: low tidal volume (6 mL/kg); HV: high tidal volume (35 mL/kg). Bars indicate mean ± standard error. n = number of rats
Fig. 7
Fig. 7
Western blotting analysis of IκB, high-mobility group box 1 (HMGB-1), and elastin in lung tissue. a IκB. b HMGB-1. c Elastin. d Elastin mRNA. The lung samples of normal groups were selected randomly from the pooled samples of 9-week-old to 10-week-old rats. MCT2: rats at 2 weeks after monocrotaline injection; MCT3: rats at 3 weeks after monocrotaline injection; LV: low tidal volume (6 mL/kg); HV: high tidal volume (35 mL/kg). Average intensity of normal/LV was taken as 100%. Sample intensity was calculated as a percentage of the average (relative intensity). Bars indicate mean ± standard error. n = number of rats.

Similar articles

Cited by

References

    1. Curley GF, Laffey JG, Zhang H, Slutsky AS. Biotrauma and ventilator-induced lung injury: clinical implications. Chest. 2016;150(5):1109–1117. - PubMed
    1. Tremblay LN, Slutsky AS. Ventilator-induced lung injury: from the bench to the bedside. Intensive Care Med. 2006;32(1):24–33. - PubMed
    1. Slutsky AS, Ranieri VM. Ventilator-induced lung injury. N Engl J Med. 2014;370(10):980. - PubMed
    1. Dreyfuss D, Soler P, Saumon G. Mechanical ventilation-induced pulmonary edema. Interaction with previous lung alterations. Am J Respir Crit Care Med. 1995;151(5):1568–1575. - PubMed
    1. Chiumello D, Pristine G, Slutsky AS. Mechanical ventilation affects local and systemic cytokines in an animal model of acute respiratory distress syndrome. Am J Respir Crit Care Med. 1999;160(1):109–116. - PubMed