. 2022 May:149:204-216.
doi: 10.1016/j.neunet.2022.02.002. Epub 2022 Feb 18.

Significance of event related causality (ERC) in eloquent neural networks

Affiliations

Significance of event related causality (ERC) in eloquent neural networks

Anna Korzeniewska et al. Neural Netw. 2022 May.

Abstract

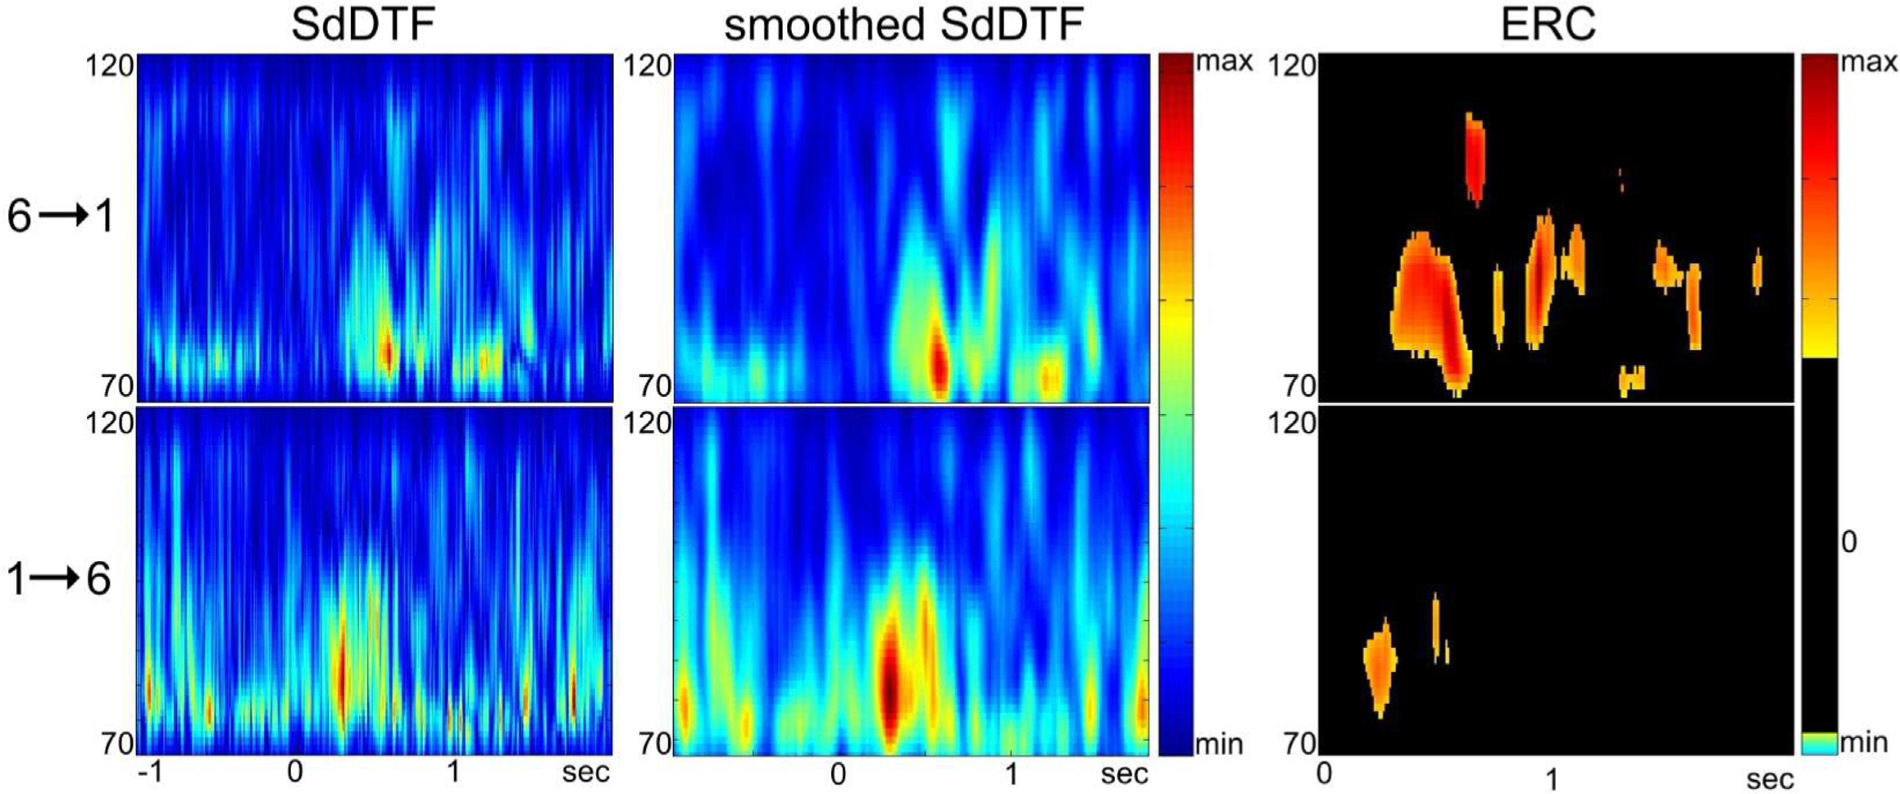
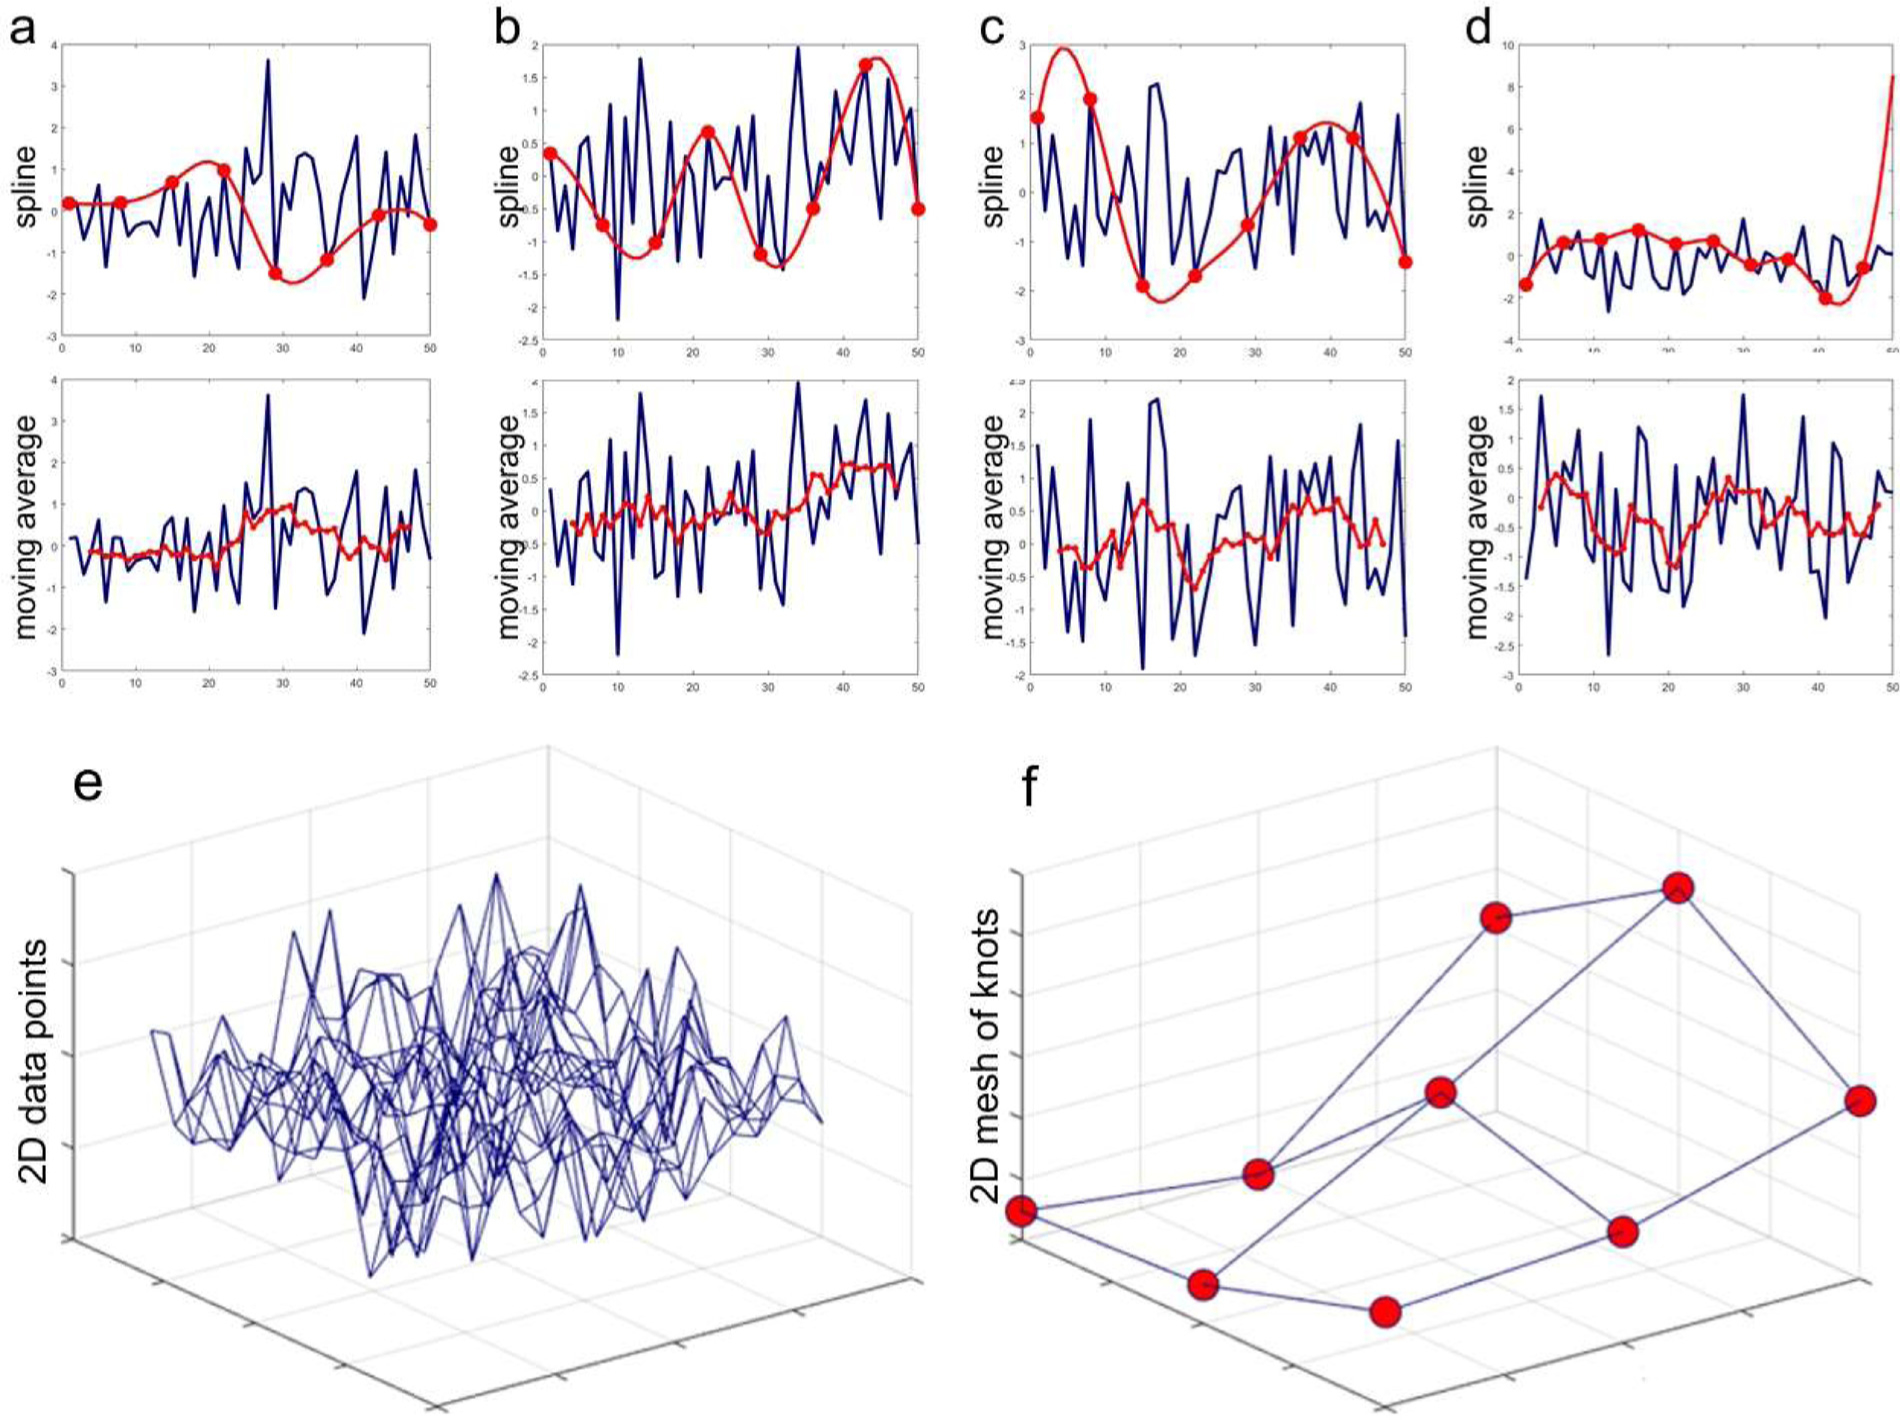
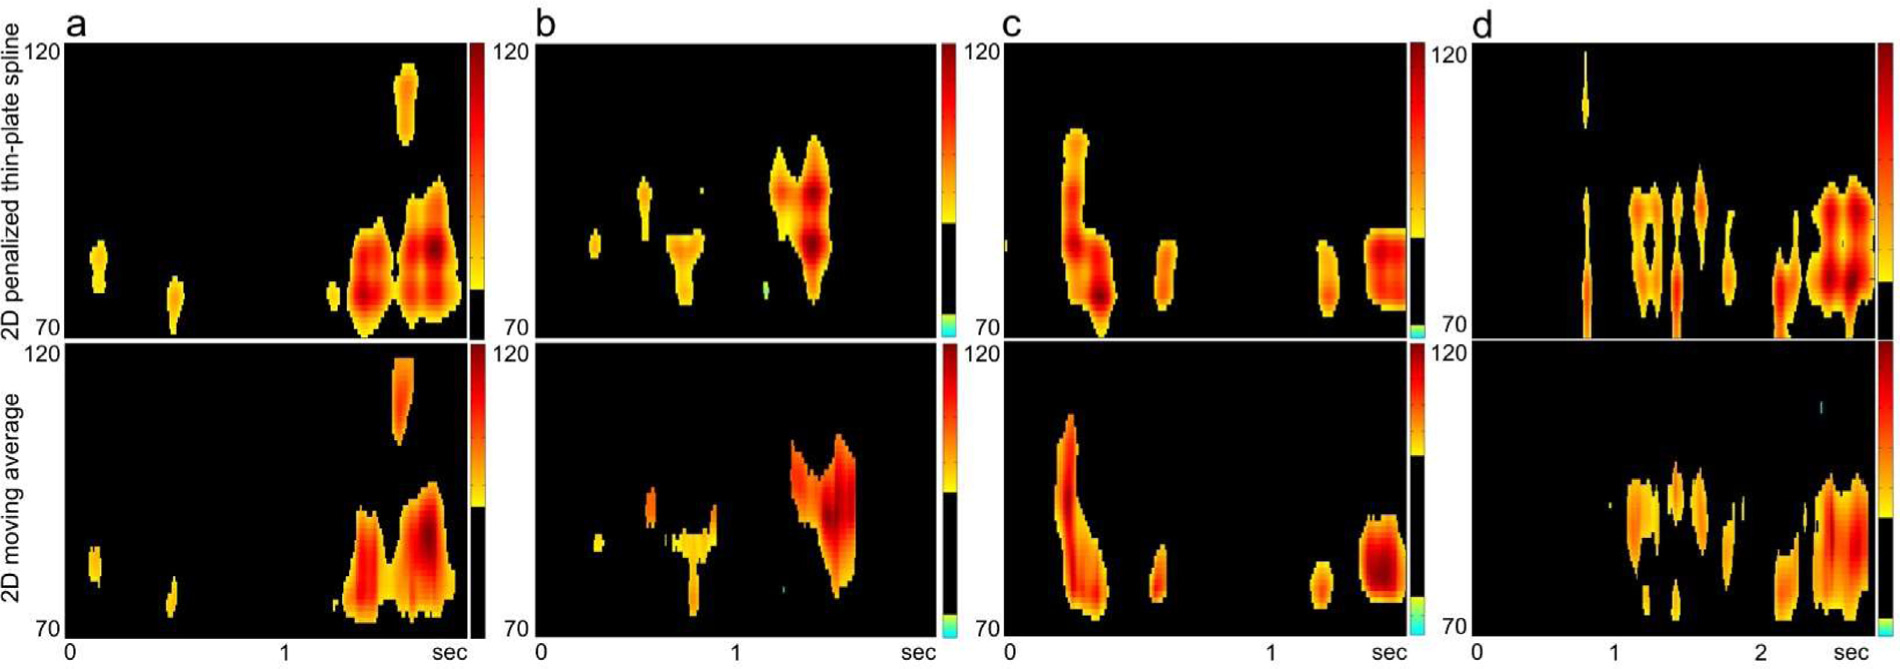
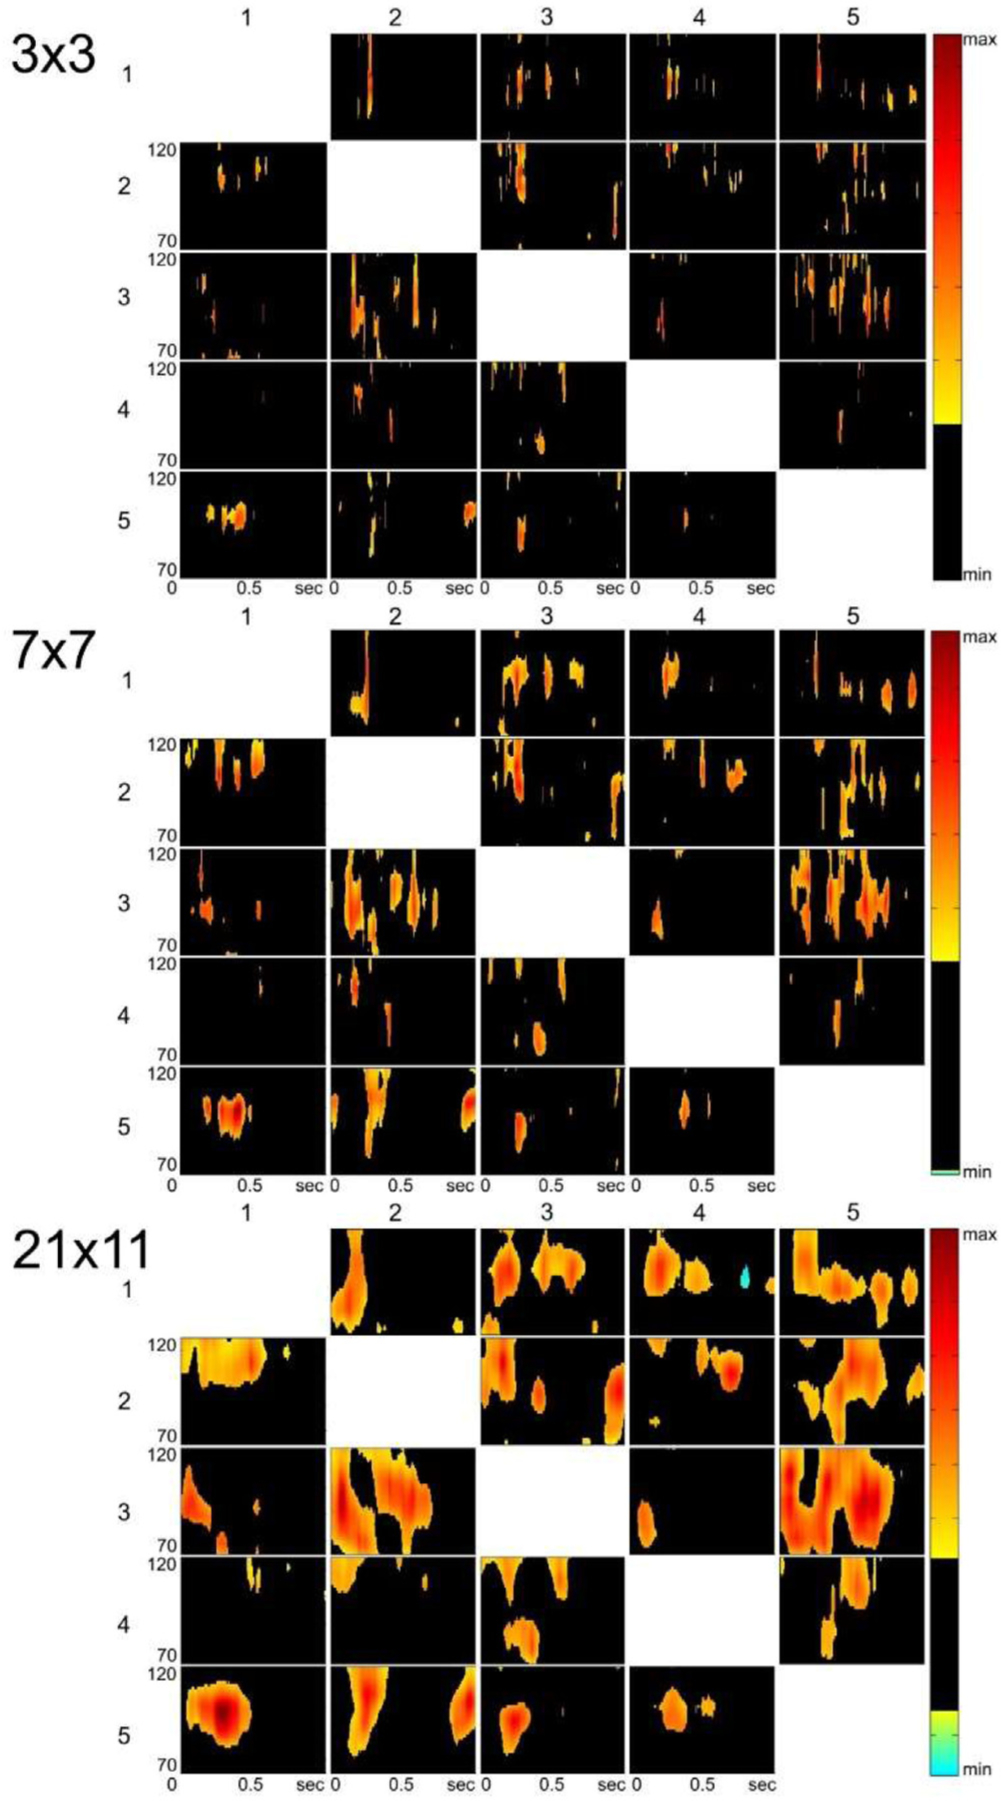
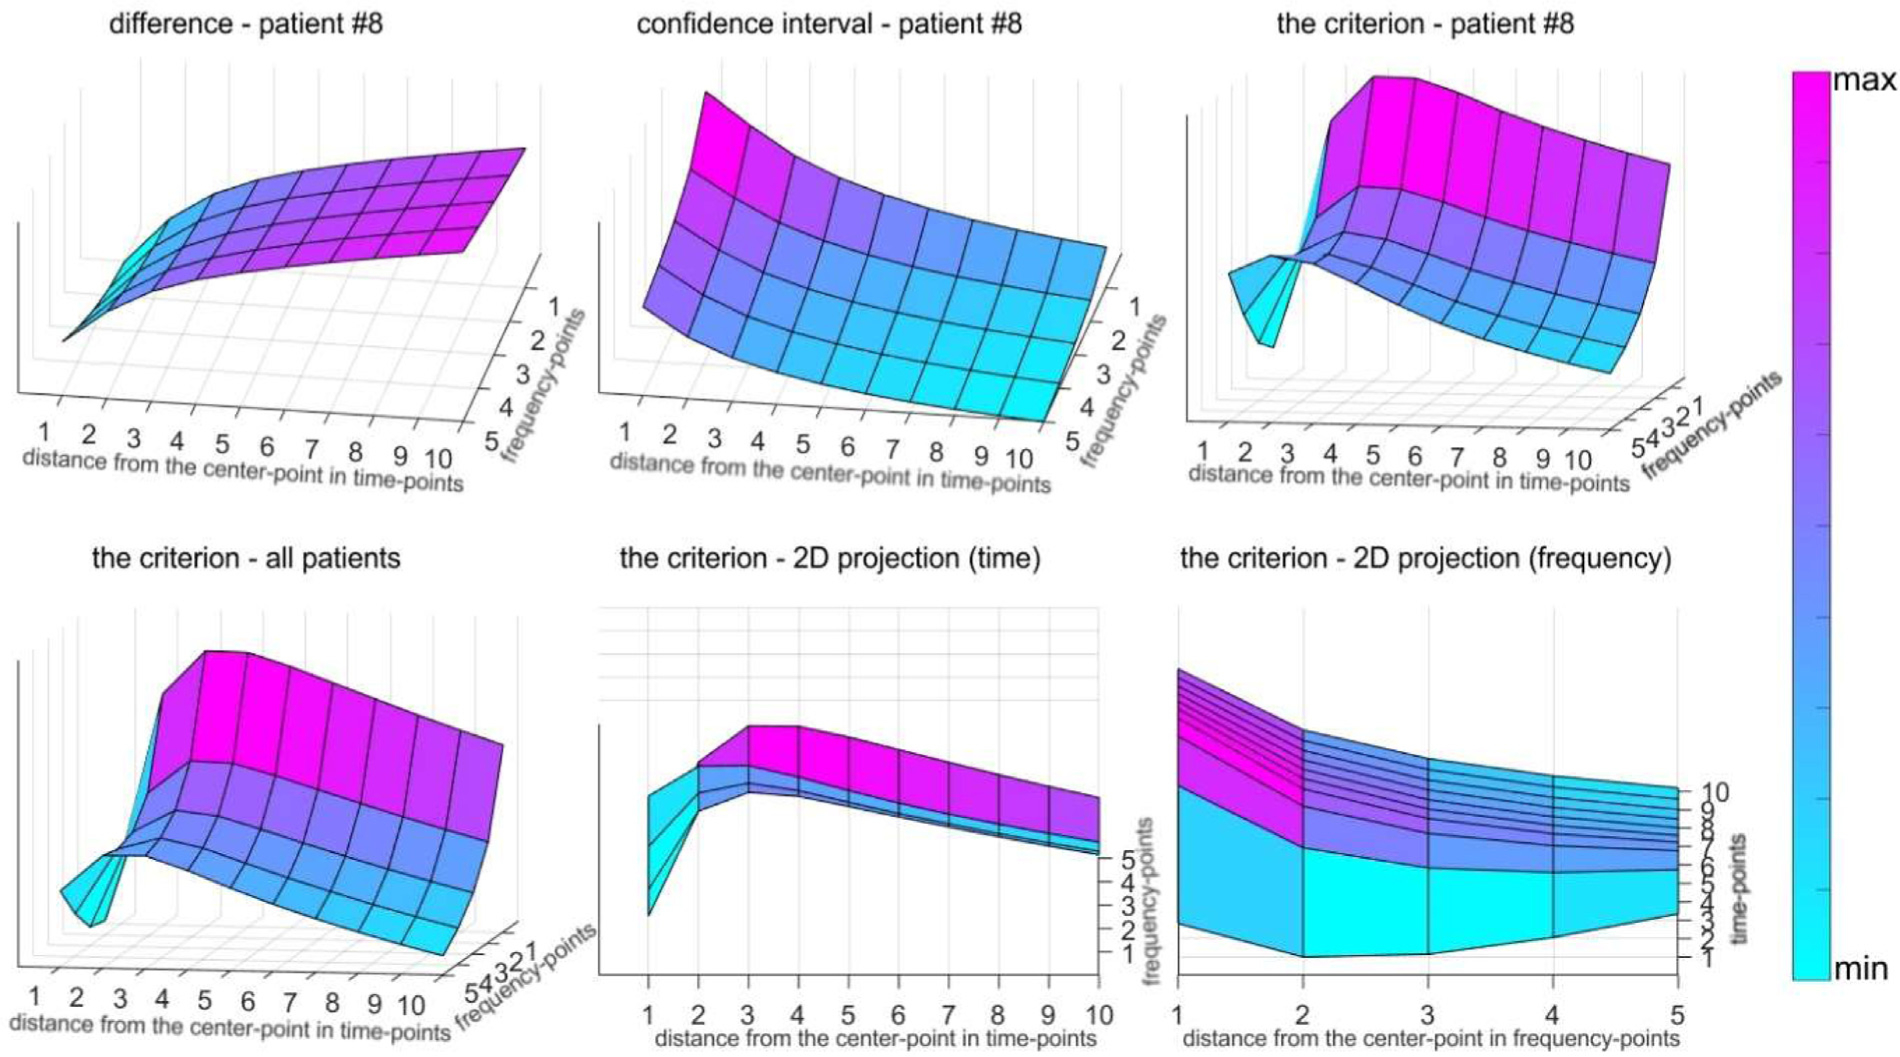
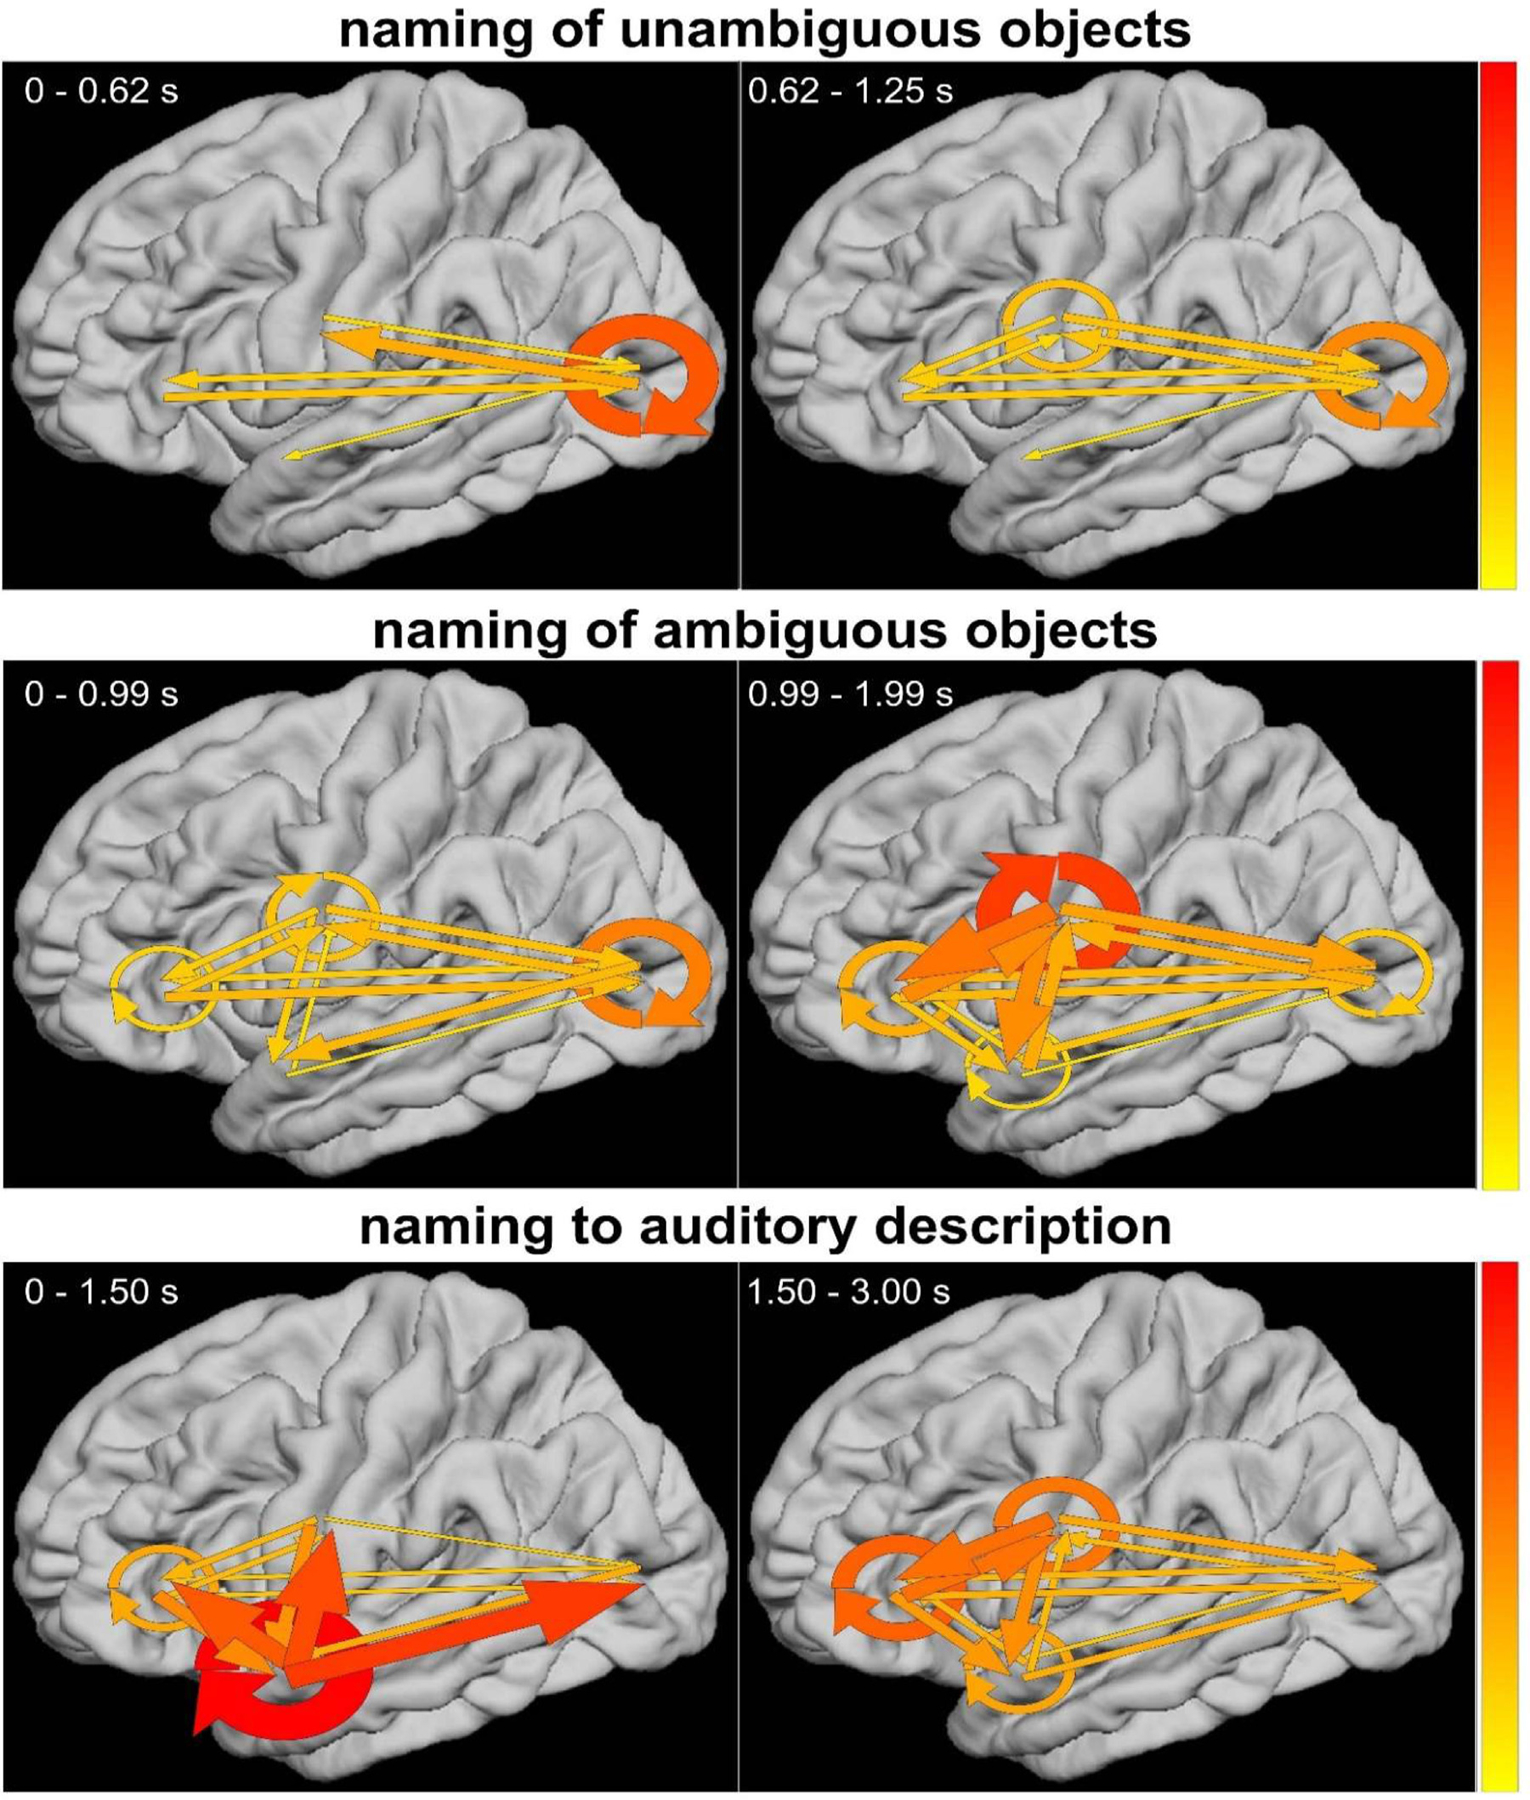
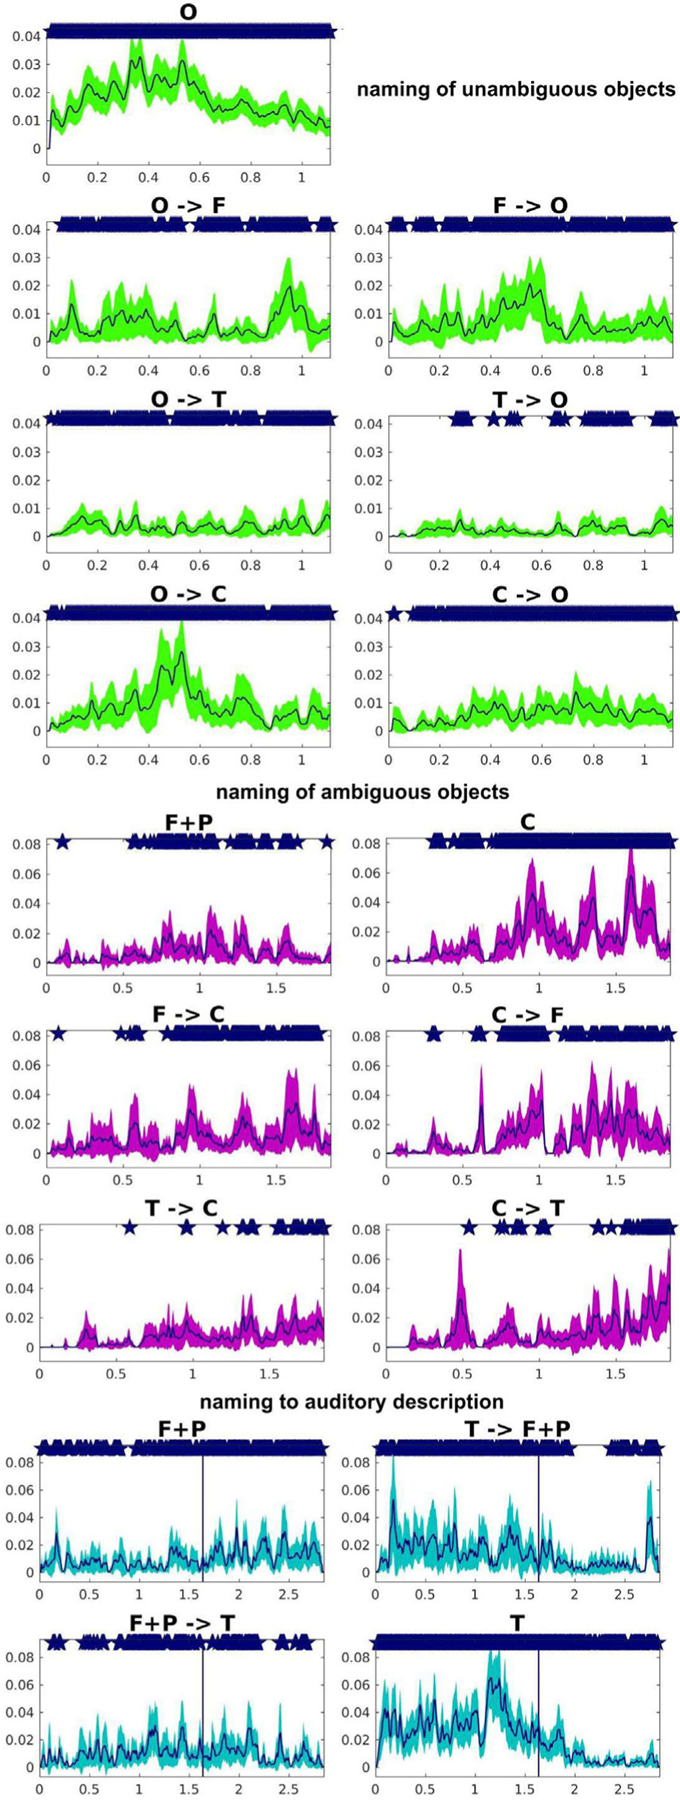
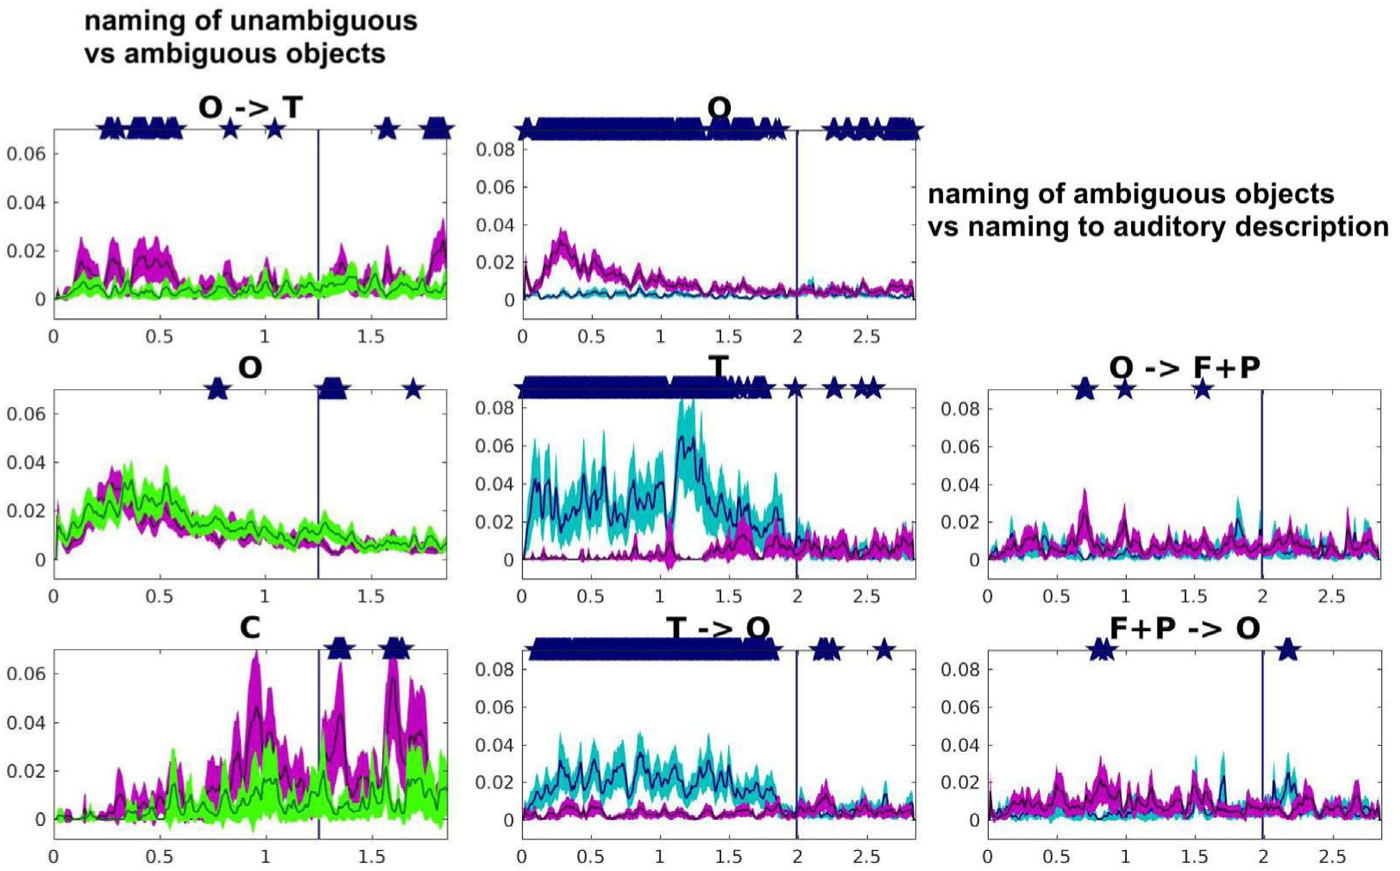
Neural activity emerges and propagates swiftly between brain areas. Investigation of these transient large-scale flows requires sophisticated statistical models. We present a method for assessing the statistical confidence of event-related neural propagation. Furthermore, we propose a criterion for statistical model selection, based on both goodness of fit and width of confidence intervals. We show that event-related causality (ERC) with two-dimensional (2D) moving average, is an efficient estimator of task-related neural propagation and that it can be used to determine how different cognitive task demands affect the strength and directionality of neural propagation across human cortical networks. Using electrodes surgically implanted on the surface of the brain for clinical testing prior to epilepsy surgery, we recorded electrocorticographic (ECoG) signals as subjects performed three naming tasks: naming of ambiguous and unambiguous visual objects, and as a contrast, naming to auditory description. ERC revealed robust and statistically significant patterns of high gamma activity propagation, consistent with models of visually and auditorily cued word production. Interestingly, ambiguous visual stimuli elicited more robust propagation from visual to auditory cortices relative to unambiguous stimuli, whereas naming to auditory description elicited propagation in the opposite direction, consistent with recruitment of modalities other than those of the stimulus during object recognition and naming. The new method introduced here is uniquely suitable to both research and clinical applications and can be used to estimate the statistical significance of neural propagation for both cognitive neuroscientific studies and functional brain mapping prior to resective surgery for epilepsy and brain tumors.

Keywords: Granger causality; Information flow; Multivariate autoregressive model; Neural networks interactions; Short-time direct directed transfer function; Time–frequency analysis.


Conflict of interest statement

Declaration of Competing Interest The authors declare that they have no known competing financial interests or personal relationships that could have appeared to influence the work reported in this paper.

Figures

Fig. 1.
Fig. 1.
Time–frequency planes of SdDTF (zkl (f, t), left panels), its estimate smoothed using 2D moving average (zk,l(f,t)¯), nine time-points by seven frequency-points around the given SdDTF point, middle panels), and ERC, i.e., statistically significant SdDTF, as compared to baseline epoch (here [−1 0] sec, right panel), for direct flows between two channel #1 and channel #6 of a MVAR model. In each plane the horizontal axis represents time in seconds, the vertical axis represents frequency, and the color scale (min–max, right of the panel) represents the value of calculated functions. ERCs color scale (min–max, right of the panel) represents the change in post-stimulus SdDTF value as compared to pre-stimulus baseline; increase in SdDTF (increase in neural propagation, yellow–red), decrease (blue–green). Black indicates time–frequency points with no significant difference between SdDTF after stimulus and SdDTFs for baseline.
Fig. 2.
Fig. 2.
Examples of visual stimuli. Top panel — unambiguous, bottom — ambiguous set (for example, the picture at bottom-left was named as ‘bird’, ‘plane’ or ‘bug’, the picture at bottom-right was named as ‘snail’, ‘whistle’, or ‘measure’).
Fig. 3.
Fig. 3.
Examples of the disadvantages of fitting data by splines. Data-points in navy blue, the fits in red. Top panel — fitting by one-dimensional spline. Middle panel — fitting by moving average. Bottom panel — an example of two-dimensional data (left) and the knots of 2D-mesh (right) for knots in every 7th data-point i.e., 7 × 7 mesh.
Fig. 4.
Fig. 4.
Examples ERC calculated with 2D penalized thin-plate spline (knots every 7th data-point if frequency and every 9th data-point in time — top panel) and ERC calculated with 2D moving average (window size 7 × 9 data-points — bottom panel). In each column (a, b, c, or d), both time–frequency planes show ERC obtained from the same MVAR model with the only difference of smoothing approach. In each plane the horizontal axis represents time in seconds, the vertical axis represents frequency, and the color scale (min–max, right of the panel) represents the change in neural activity flow as compared to the baseline (increase; yellow–red, decrease; blue–green). Black color indicates time–frequency points with no significant difference.
Fig. 5.
Fig. 5.
Examples of ERC calculated using 2D moving average of different size of smoothing window. ERC calculated for the same data, and the same MVAR model, with 2D moving average over a square 3 time points by 3 points in frequency (top panel), a square 7 by 7 points (central panel), and a rectangle 21 by 11 points (bottom panel). Each plot (each time–frequency plane) shows ERC for direct flows from the channel named above the plot to the channel named to the left of the plot. In each plane the horizontal axis represents time in seconds, the vertical axis represents frequency, and the color scale (min–max, right of the panel) represents the change in neural activity flow as compared to the baseline (increase; yellow–red, decrease; blue–green). Black color indicates time–frequency points with no significant difference.
Fig. 6.
Fig. 6.
An example of performance of a bivariate smoothing model, dependently on the number of data-points included in 2D moving average (window size), for ERC containing 20 channels (K =20) recorded during naming of ambiguous objects. Top panel shows results in patient #8. Top-left: the difference between the ERC values and the values of 2D moving average. Top-middle; confidence interval. Top-right: the criterion Wm,n¯. X and Y axes represent window size by distances from the center-point of the window of 2D moving average, in time-points and frequency-points accordingly. Colorscale (min–max) at the right. Bottom panel shows the criterion Wm,n¯ averaged over all patients (bottom-left) and their projections on time-plane (bottom-middle), and on frequency-plane (bottom-right).
Fig. 7.
Fig. 7.
Results of event-related causality (ERC) estimated with 2D moving average of window size 7 × 7 time–frequency points, averaged across all patients. Naming of unambiguous objects (top panel), ambiguous objects (middle panel), and naming to auditory description (bottom panel). The task interval starting at stimulus onset and ending at speech onset is divided in half with the first half in the left column and the second half in the right column. Both width and color (thin-yellow: weak; thick-red: strong) of arrows represent intensity of high-gamma activity propagation, using a single colorscale across all plots. Linear arrows: propagation between regions of interest (ROIs). Circular arrows: propagation within ROIs. Top 90% of propagations depicted to reduce complexity of the figure.
Fig. 8.
Fig. 8.
Time-course of group level significance in event-related causality (ERC) for selected high-gamma activity propagations. Top-green, naming of unambiguous objects (propagations that did not reach the level of group significance at any time-point are not shown). Middle-purple, naming of ambiguous objects (similarly, as for unambiguous objects, all increases in propagations from and into occipital–temporal region were significant at the group level for almost all time-points; they are not shown here to reduce the size of the figure — available upon request). Bottom-cyan, naming to auditory description (only increases in frontal-parietal and temporal propagations are shown). The color shaded areas depict confidence intervals. The vertical lines mark the end of question/description. All plots start at stimulus onset, and end at response onset. X-axis represents time, Y-axis represents ERC averaged over all patients. Asterisks depict time-points of group significance.
Fig. 9.
Fig. 9.
Group level comparisons of ERC between tasks: naming of unambiguous visual objects (green), naming of ambiguous visual objects (purple), and naming to auditory description (cyan). Vertical lines mark mean response onset in the shorter task, while the end of the plot marks the mean response onset of the longer task. X-axis represents time, Y-axis represents ERC averaged over all patients. Asterisks depict time-points with statistically significant differences between tasks in ERC across all patients.

Similar articles

Cited by

References

    1. Akaike H (1974). New look at statistical-model identification. IEEE Transactions on Automatic Control, AC19(6), 716–723.
    1. Altes RA (1980). Detection, estimation, and classification with spectrograms. The Journal of the Acoustical Society of America, 67(4), 1232–1246. 10.1121/1.384165. - DOI
    1. Asano E, Juhász C, Shah A, Sood S, & Chugani HT (2009). Role of subdural electrocorticography in prediction of long-term seizure outcome in epilepsy surgery. Brain: A Journal of Neurology, 132(Pt 4), 1038–1047. 10.1093/brain/awp025. - DOI - PMC - PubMed
    1. Baddeley, null (2000). The episodic buffer: a new component of working memory? Trends in Cognitive Sciences, 4(11), 417–423. 10.1016/s1364-6613(00)01538-2. - DOI - PubMed
    1. Bar M, Kassam KS, Ghuman AS, Boshyan J, Schmid AM, Schmidt AM, et al. (2006). Top-down facilitation of visual recognition. Proceedings of the National Academy of Sciences of the United States of America, 103(2), 449–454. 10.1073/pnas.0507062103. - DOI - PMC - PubMed