. 2022 May;600(9):2127-2146.
doi: 10.1113/JP282371. Epub 2022 Mar 20.

Exercise training remodels subcutaneous adipose tissue in adults with obesity even without weight loss

Affiliations

Exercise training remodels subcutaneous adipose tissue in adults with obesity even without weight loss

Cheehoon Ahn et al. J Physiol. 2022 May.

Abstract

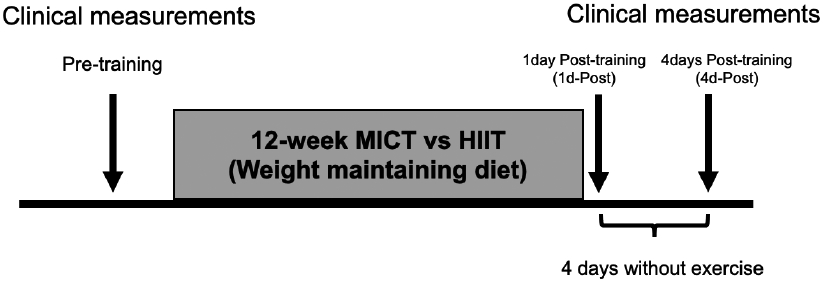
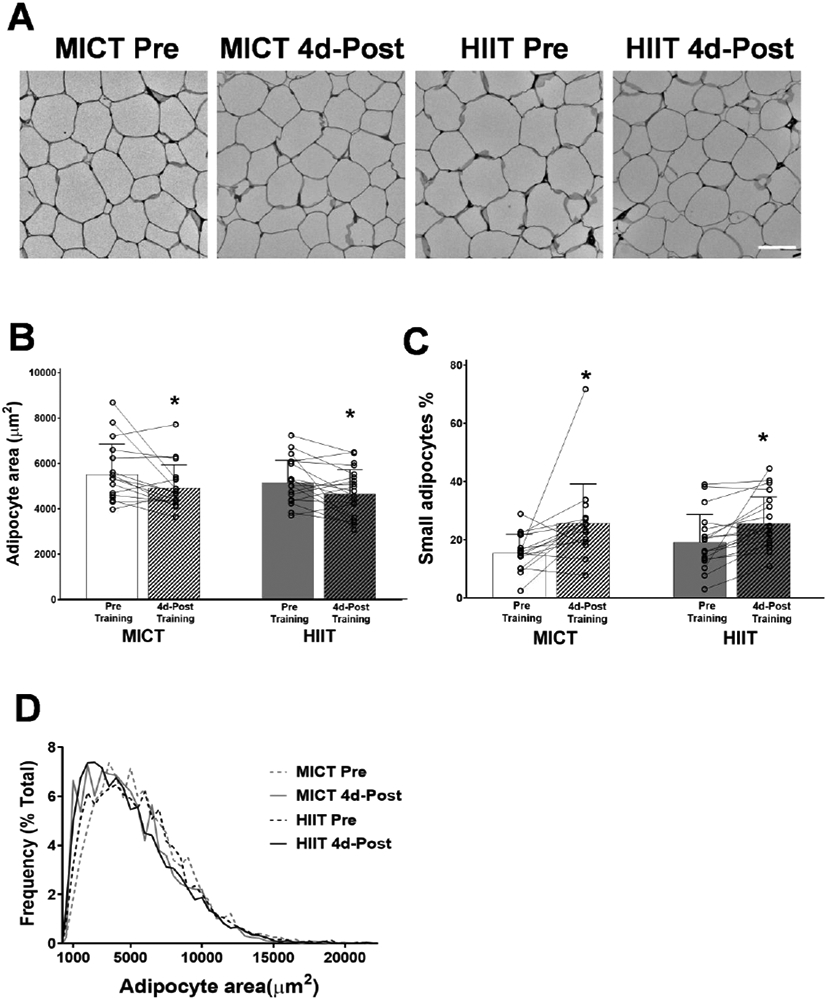
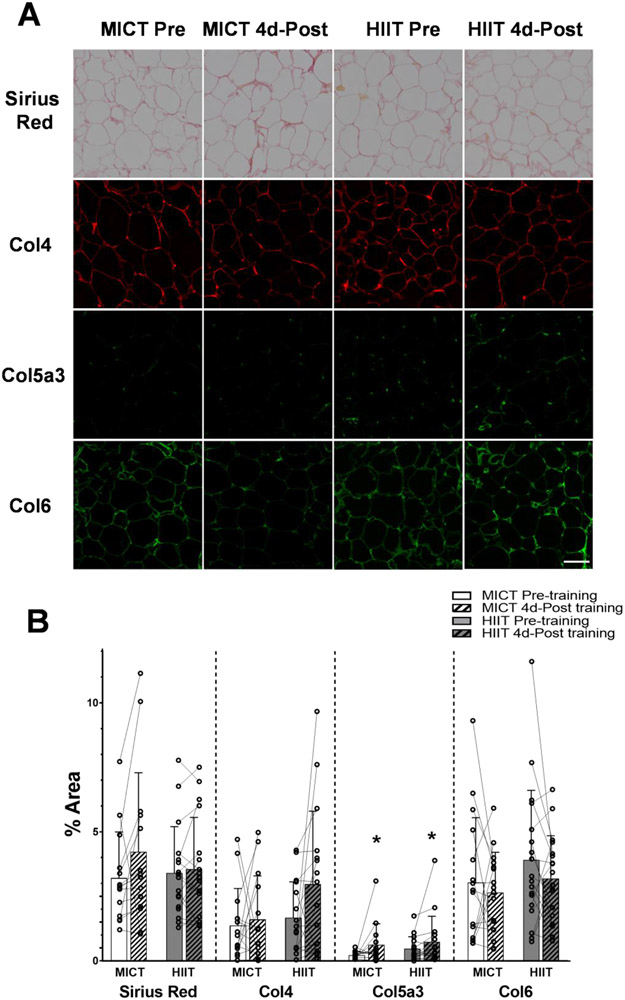
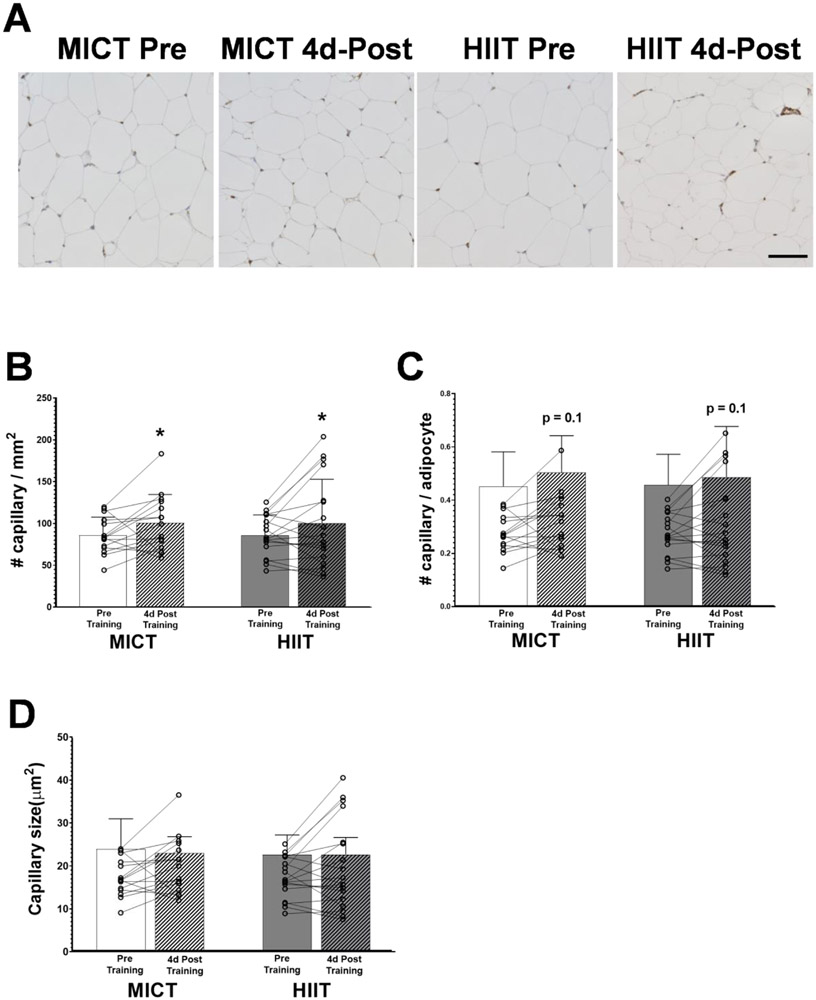
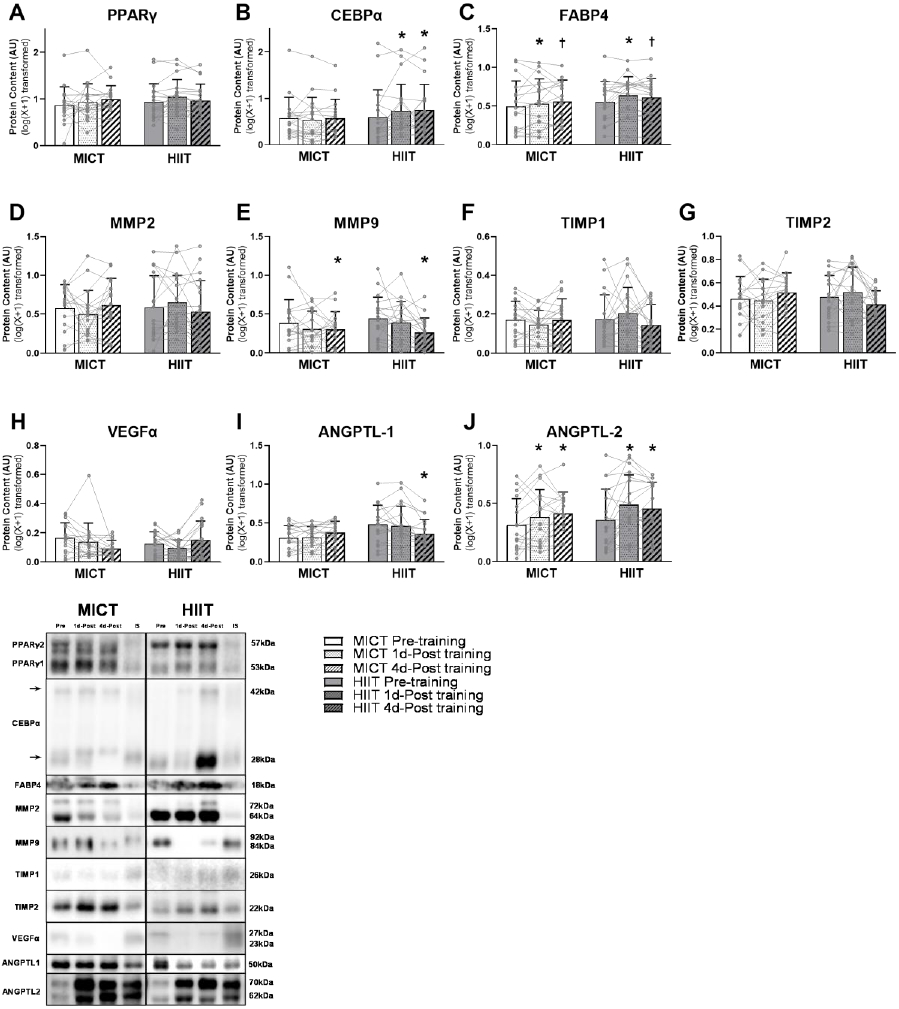
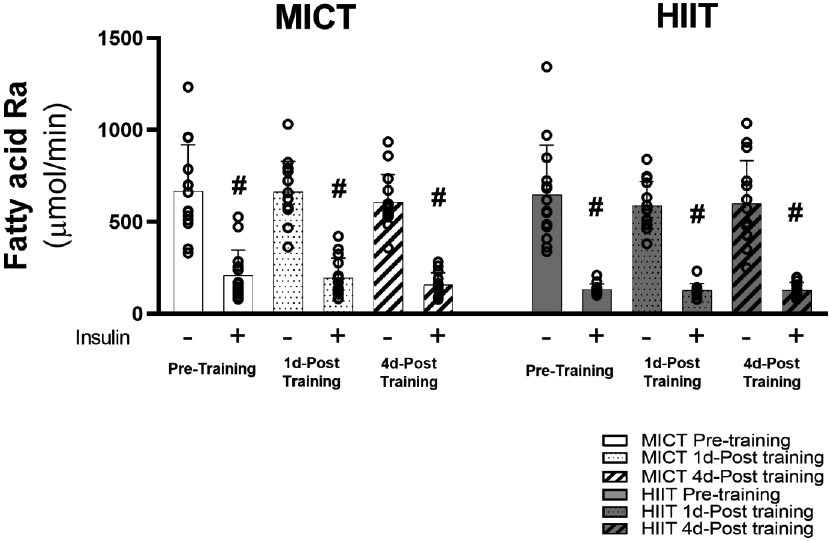
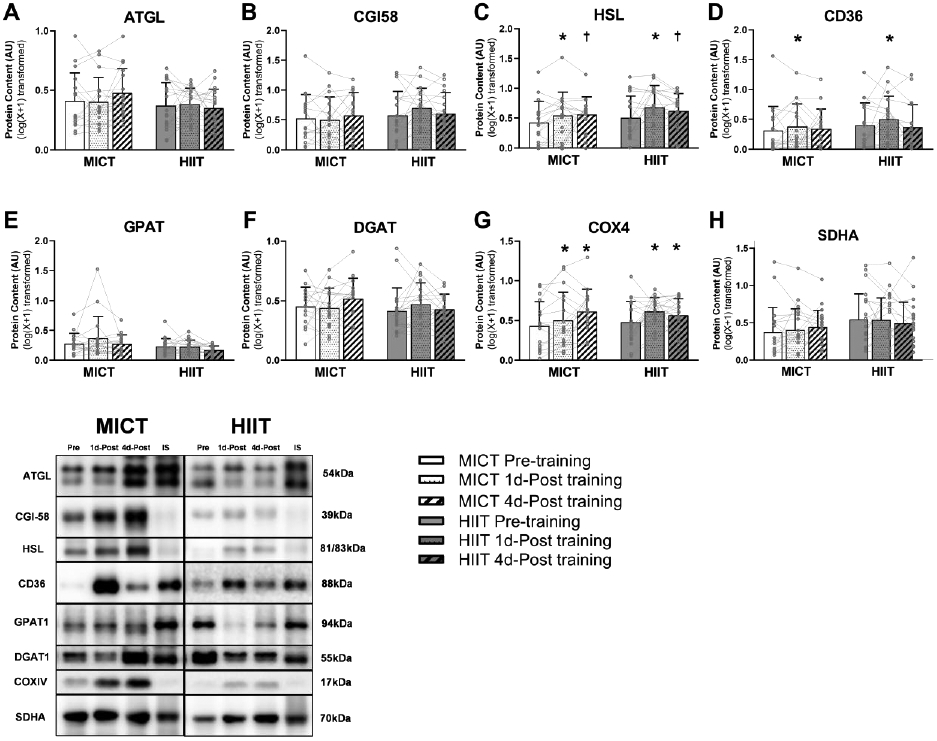
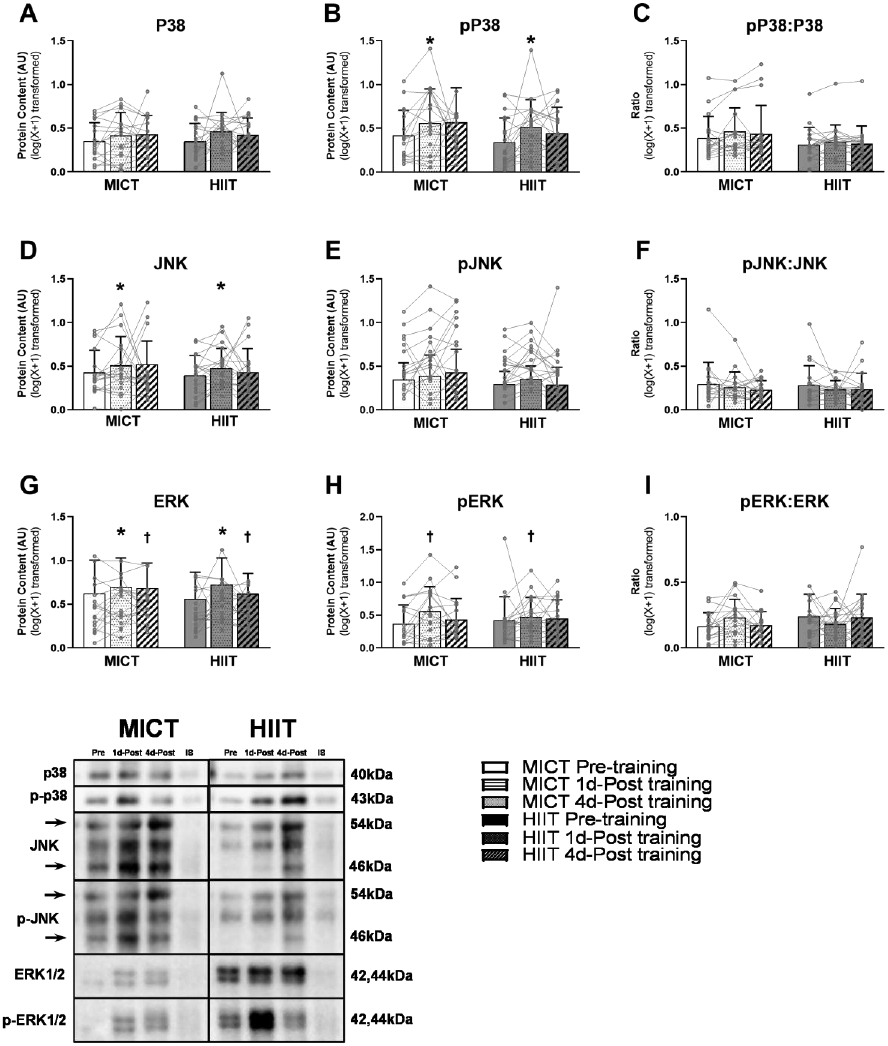
Excessive adipose tissue mass underlies much of the metabolic health complications in obesity. Although exercise training is known to improve metabolic health in individuals with obesity, the effects of exercise training without weight loss on adipose tissue structure and metabolic function remain unclear. Thirty-six adults with obesity (body mass index = 33 ± 3 kg · m-2 ) were assigned to 12 weeks (4 days week-1 ) of either moderate-intensity continuous training (MICT; 70% maximal heart rate, 45 min; n = 17) or high-intensity interval training (HIIT; 90% maximal heart rate, 10 × 1 min; n = 19), maintaining their body weight throughout. Abdominal subcutaneous adipose tissue (aSAT) biopsy samples were collected once before and twice after training (1 day after last exercise and again 4 days later). Exercise training modified aSAT morphology (i.e. reduced fat cell size, increased collagen type 5a3, both P ≤ 0.05, increased capillary density, P = 0.05) and altered protein abundance of factors that regulate aSAT remodelling (i.e. reduced matrix metallopeptidase 9; P = 0.02; increased angiopoietin-2; P < 0.01). Exercise training also increased protein abundance of factors that regulate lipid metabolism (e.g. hormone sensitive lipase and fatty acid translocase; P ≤ 0.03) and key proteins involved in the mitogen-activated protein kinase pathway when measured the day after the last exercise session. However, most of these exercise-mediated changes were no longer significant 4 days after exercise. Importantly, MICT and HIIT induced remarkably similar adaptations in aSAT. Collectively, even in the absence of weight loss, 12 weeks of exercise training induced changes in aSAT structure, as well as factors that regulate metabolism and the inflammatory signal pathway in adults with obesity. KEY POINTS: Exercise training is well-known to improve metabolic health in obesity, although how exercise modifies the structure and metabolic function of adipose tissue, in the absence of weight loss, remains unclear. We report that both 12 weeks of moderate-intensity continuous training (MICT) and 12 weeks of high-intensity interval training (HIIT) induced modifications in adipose tissue structure and factors that regulate adipose tissue remodelling, metabolism and the inflammatory signal pathway in adults with obesity, even without weight loss (with no meaningful differences between MICT and HIIT). The modest modifications in adipose tissue structure in response to 12 weeks of MICT or HIIT did not lead to changes in the rate of fatty acid release from adipose tissue. These results expand our understanding about the effects of two commonly used exercise training prescriptions (MICT and HIIT) on adipose tissue remodelling that may lead to advanced strategies for improving metabolic health outcomes in adults with obesity.

Keywords: adipose tissue; exercise training; high-intensity interval training.


Figures

Figure 1.
Figure 1.. Schematic of study design.
Figure 2.
Figure 2.. Changes in adipocyte cell size in response to training
A) Representative images of H&E stained aSAT. White scale bar refers to 100μm. B) Mean adipocyte area. C) Proportion of smaller adipocytes (1000μm2 ≤ area ≤ 3000μm2). C) Frequency distribution of adipocyte area. Sample sizes were MICT n = 16 and HIIT = 18. *Significant main effect of training status (p < 0.05). ** Significant main effect of training status (p < 0.01). There were no significant effects of training group or training group x training status interactions.
Figure 3.
Figure 3.. Adaptation of aSAT fibrosis and ECM proteins in response to training.
A) Representative staining images of Sirius Red, Col4, Col5a3, and Col6 in aSAT section. White scale bar refers to 100μm. B) Abundance of ECM proteins quantified from histology images. Sample sizes were MICT n = 14 and HIIT n = 17 for Sirius Red, MICT n = 14 and HIIT n = 16 for Col4 and Col5a3, and MICT n = 16 and HIIT n = 18 for Col6. *Significant main effect of training status (p<0.05). There were no significant effects of training group or training group x training status interactions.
Figure 4.
Figure 4.. aSAT capillarization in response to training.
A) Representative staining images of vWF in aSAT section. Capillaries are visible as dark-brown puncta. Black scale bar refers to 100μm. B) Number of capillaries per field area (mm2). C) Number of capillaries per adipocytes. D) Mean capillary cross-sectional area (μm2). *Significant main effect of training status (p≤0.05). Sample sizes were MICT n = 15 and HIIT = 18. There were no significant effects of training group or training group x training status interactions.
Figure 5.
Figure 5.. Adaptations in aSAT remodeling factors in response to exercise training.
(A~C) Protein expression of factors/markers involved in adipogenesis. (D~G) Protein expression of ECM regulators. (H~J) Protein expression of angiogenic regulators. *Significant main effect of training status, with post-hoc analysis identifying a significant difference compared with Pre-training (p<0.05). † Trend of main effect of training status, with post-hoc analysis identifying a trend of difference compared with Pre-training (0.05
Figure 6.
Figure 6.. Whole body fatty acid mobilization rate in response to exercise training.
Sample sizes were MICT n = 14 and HIIT = 14. Fatty acid rate of appearance in the systemic circulation after over-night fasting and insulin-stimulated conditions. #Significant main effect of insulin (p<0.001). There were no significant main effects of training group, training status, or training group x training status interactions.
Figure 7.
Figure 7.. Adaptations in aSAT metabolic factors in response to exercise training.
(A~C) Protein expression of lipolytic enzymes. D). Protein expression of fatty acid trafficking protein. (E and F) Protein expression of esterific enzymes. (G and H) Protein expression of mitochondrial markers. *Significant main effect of training status, with post-hoc analysis identifying a significant difference compared with Pre-Training (p<0.05). † Trend of main effect of training status, with post-hoc analysis identifying a trend of difference compared with Pre-Training (0.05
Figure 8.
Figure 8.. Adaptations in aSAT MAPK proteins in response to exercise training.
Protein expression of A) total P38 and B) phosphorylated P38. C) The activity of P38 was measured by normalizing the abundance of phosphorylated P38 by total P38. Protein expression of D) total JNK and E) phosphorylated JNK. F) The activity of JNK was measured by normalizing the abundance of phosphorylated JNK by total JNK. Protein expression of G) total ERK and H) phosphorylated ERK. I) The activity of ERK was measured by normalizing the abundance of phosphorylated ERK by total ERK. *Significant main effect of training status, with post-hoc analysis identifying a significant difference compared with Pre-Training (p<0.05). † Trend of main effect of training status, with post-hoc analysis identifying a trend of difference compared with Pre-Training (0.05

Comment in

References

    1. Américo ALV, Muller CR, Vecchiatto B, Martucci LF, Fonseca-Alaniz MH & Evangelista FS. (2019). Aerobic exercise training prevents obesity and insulin resistance independent of the renin angiotensin system modulation in the subcutaneous white adipose tissue. PloS one 14. - PMC - PubMed
    1. Arner E, Westermark PO, Spalding KL, Britton T, Rydén M, Frisén J, Bernard S & Arner P. (2010). Adipocyte turnover: relevance to human adipose tissue morphology. Diabetes 59, 105–109. - PMC - PubMed
    1. Camp HS & Tafuri SR. (1997). Regulation of Peroxisome Proliferator-activated Receptor γ Activity by Mitogen-activated Protein Kinase*. Journal of Biological Chemistry 272, 10811–10816. - PubMed
    1. Chen X-H, Zhao Y-P, Xue M, Ji C-B, Gao C-L, Zhu J-G, Qin D-N, Kou C-Z, Qin X-H & Tong M-L. (2010). TNF-α induces mitochondrial dysfunction in 3T3-L1 adipocytes. Molecular and cellular endocrinology 328, 63–69. - PubMed
    1. Chun T-H. (2012). Peri-adipocyte ECM remodeling in obesity and adipose tissue fibrosis. Adipocyte 1, 89–95. - PMC - PubMed

Publication types