. 2022 Jun 1:317:123547.
doi: 10.1016/j.fuel.2022.123547. Epub 2022 Feb 12.

Characterization of Compositional Variability in Petroleum Substances

Affiliations

Characterization of Compositional Variability in Petroleum Substances

Alina T Roman-Hubers et al. Fuel (Lond). .

Abstract

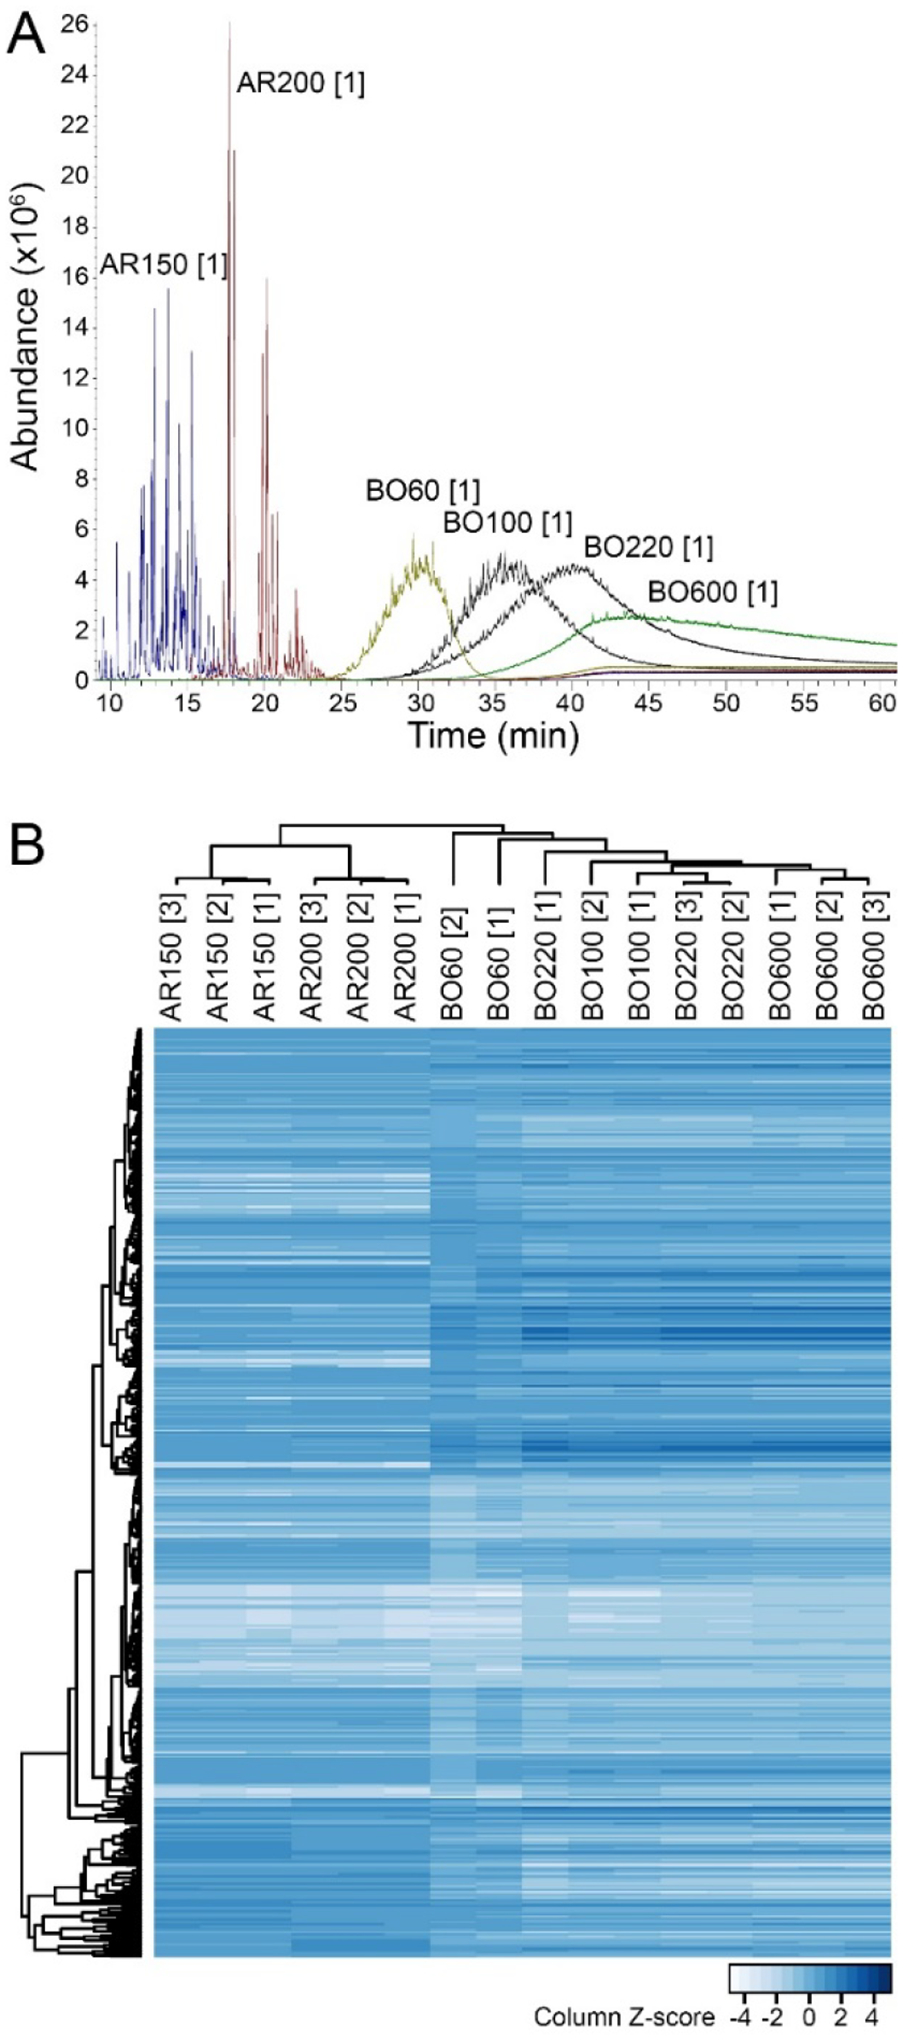
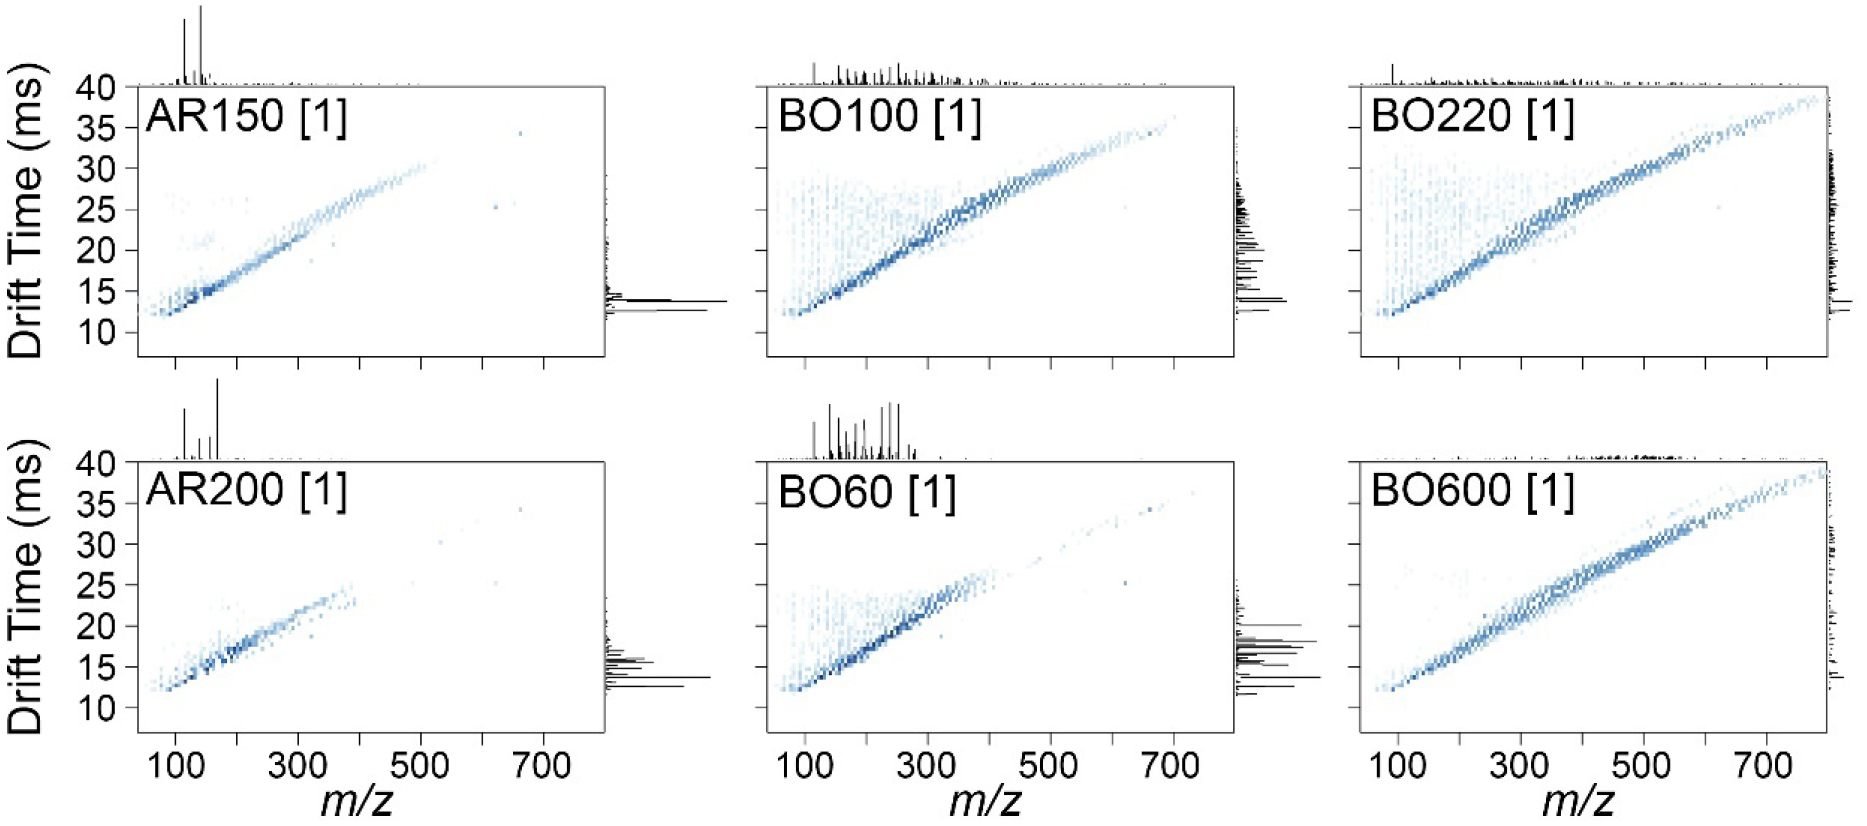
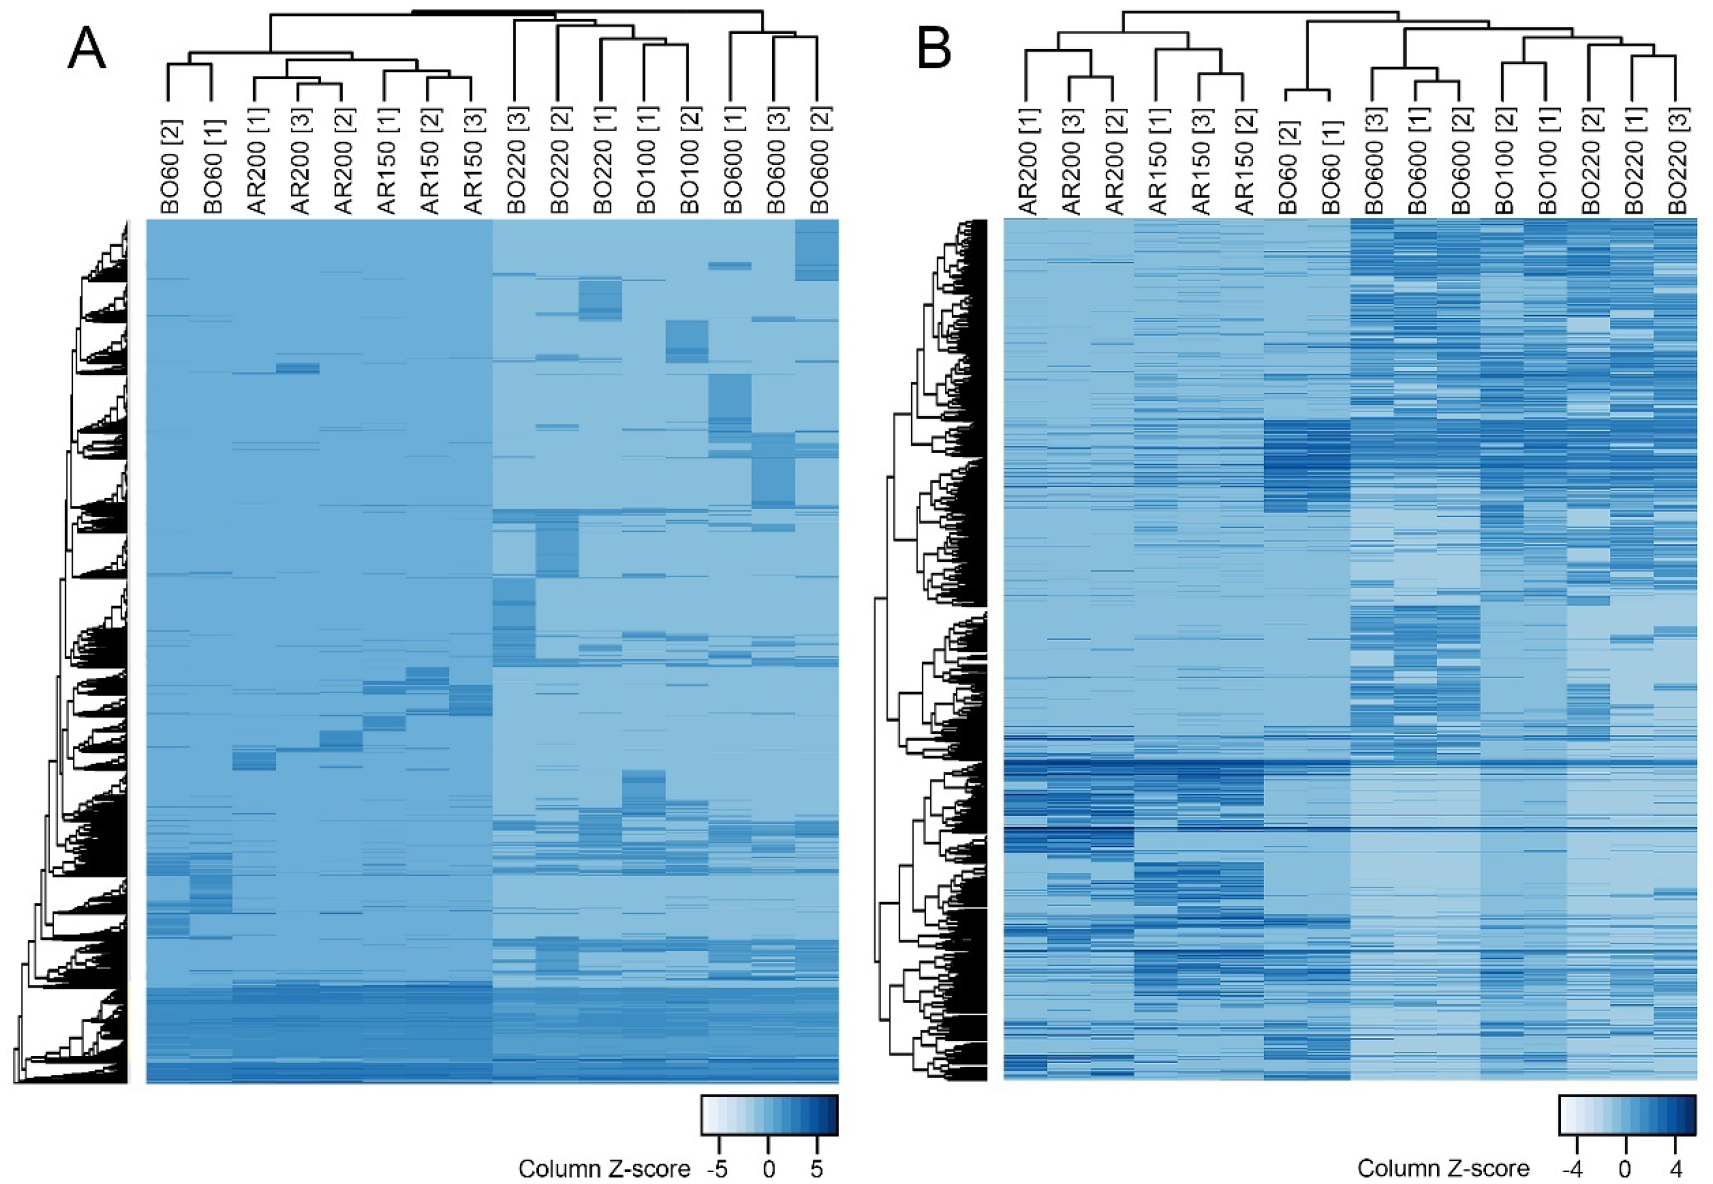
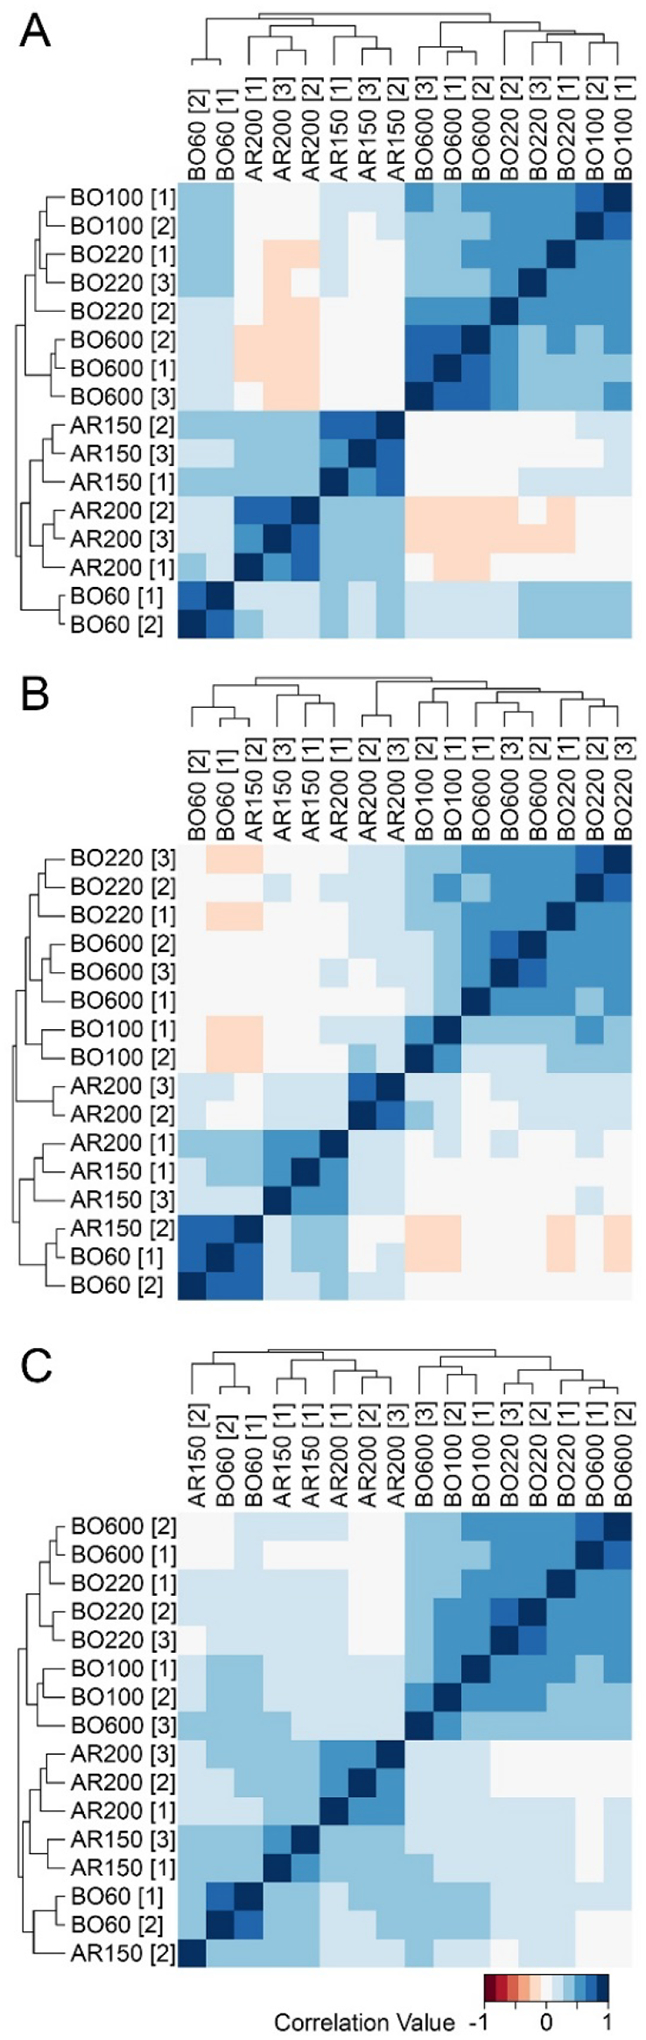
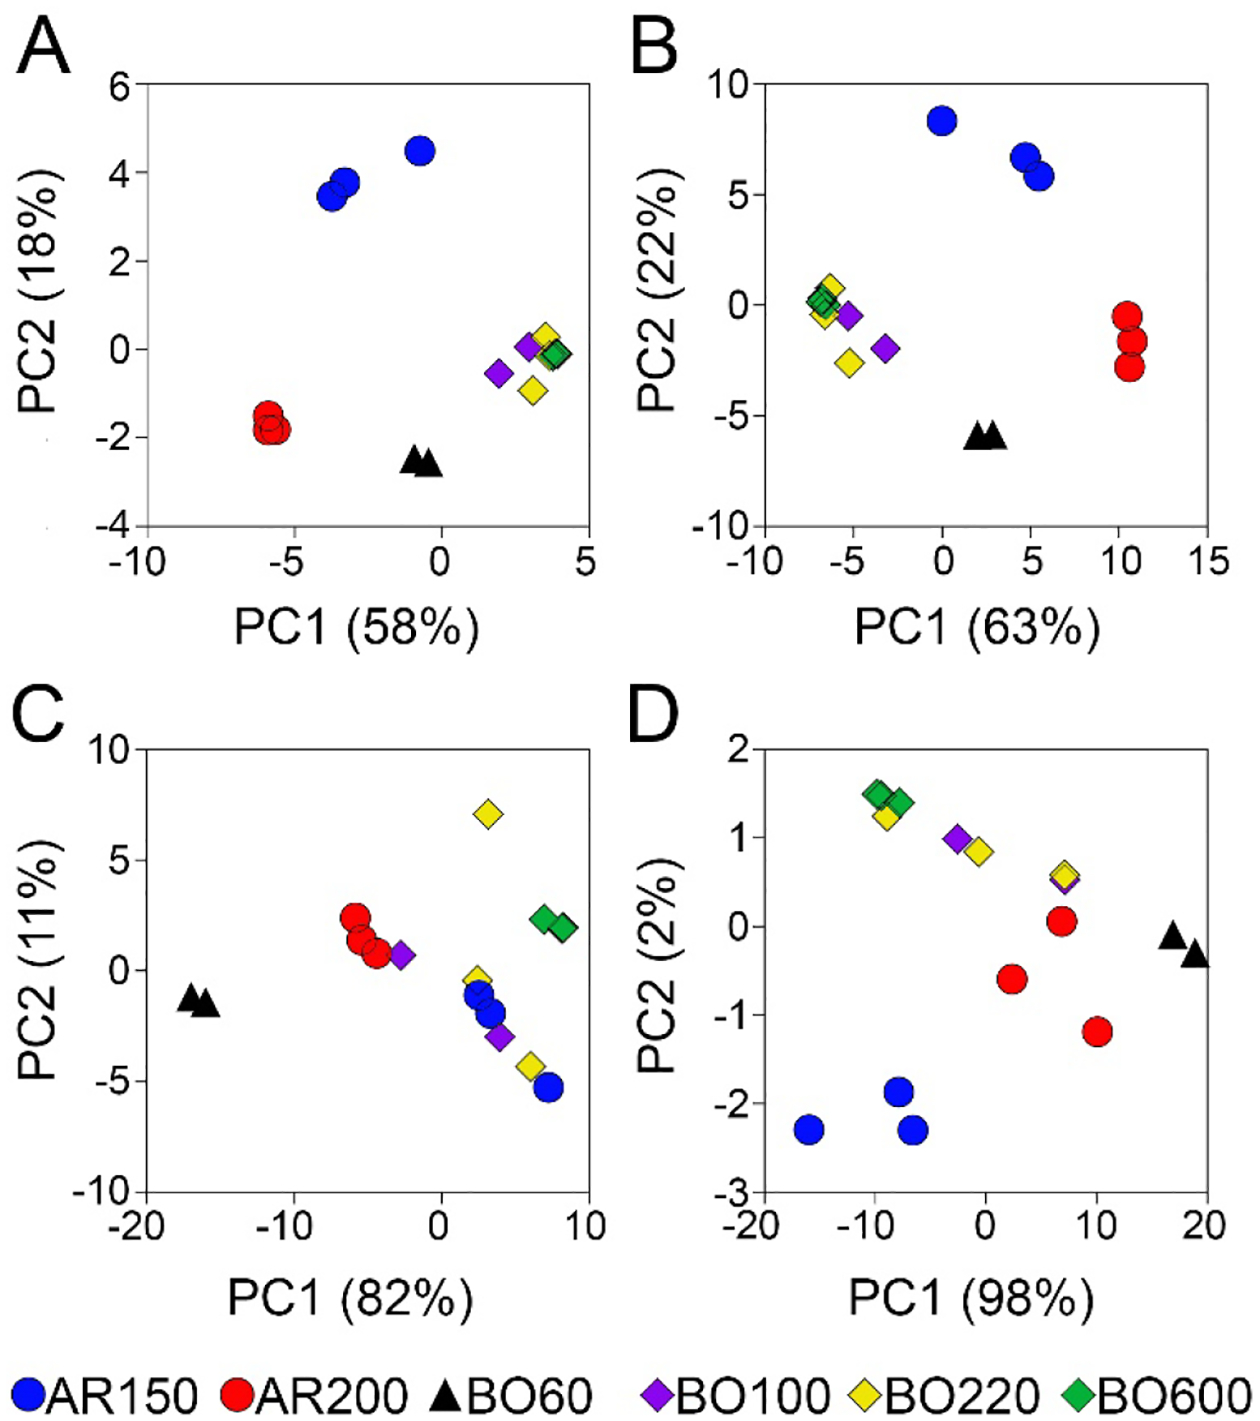
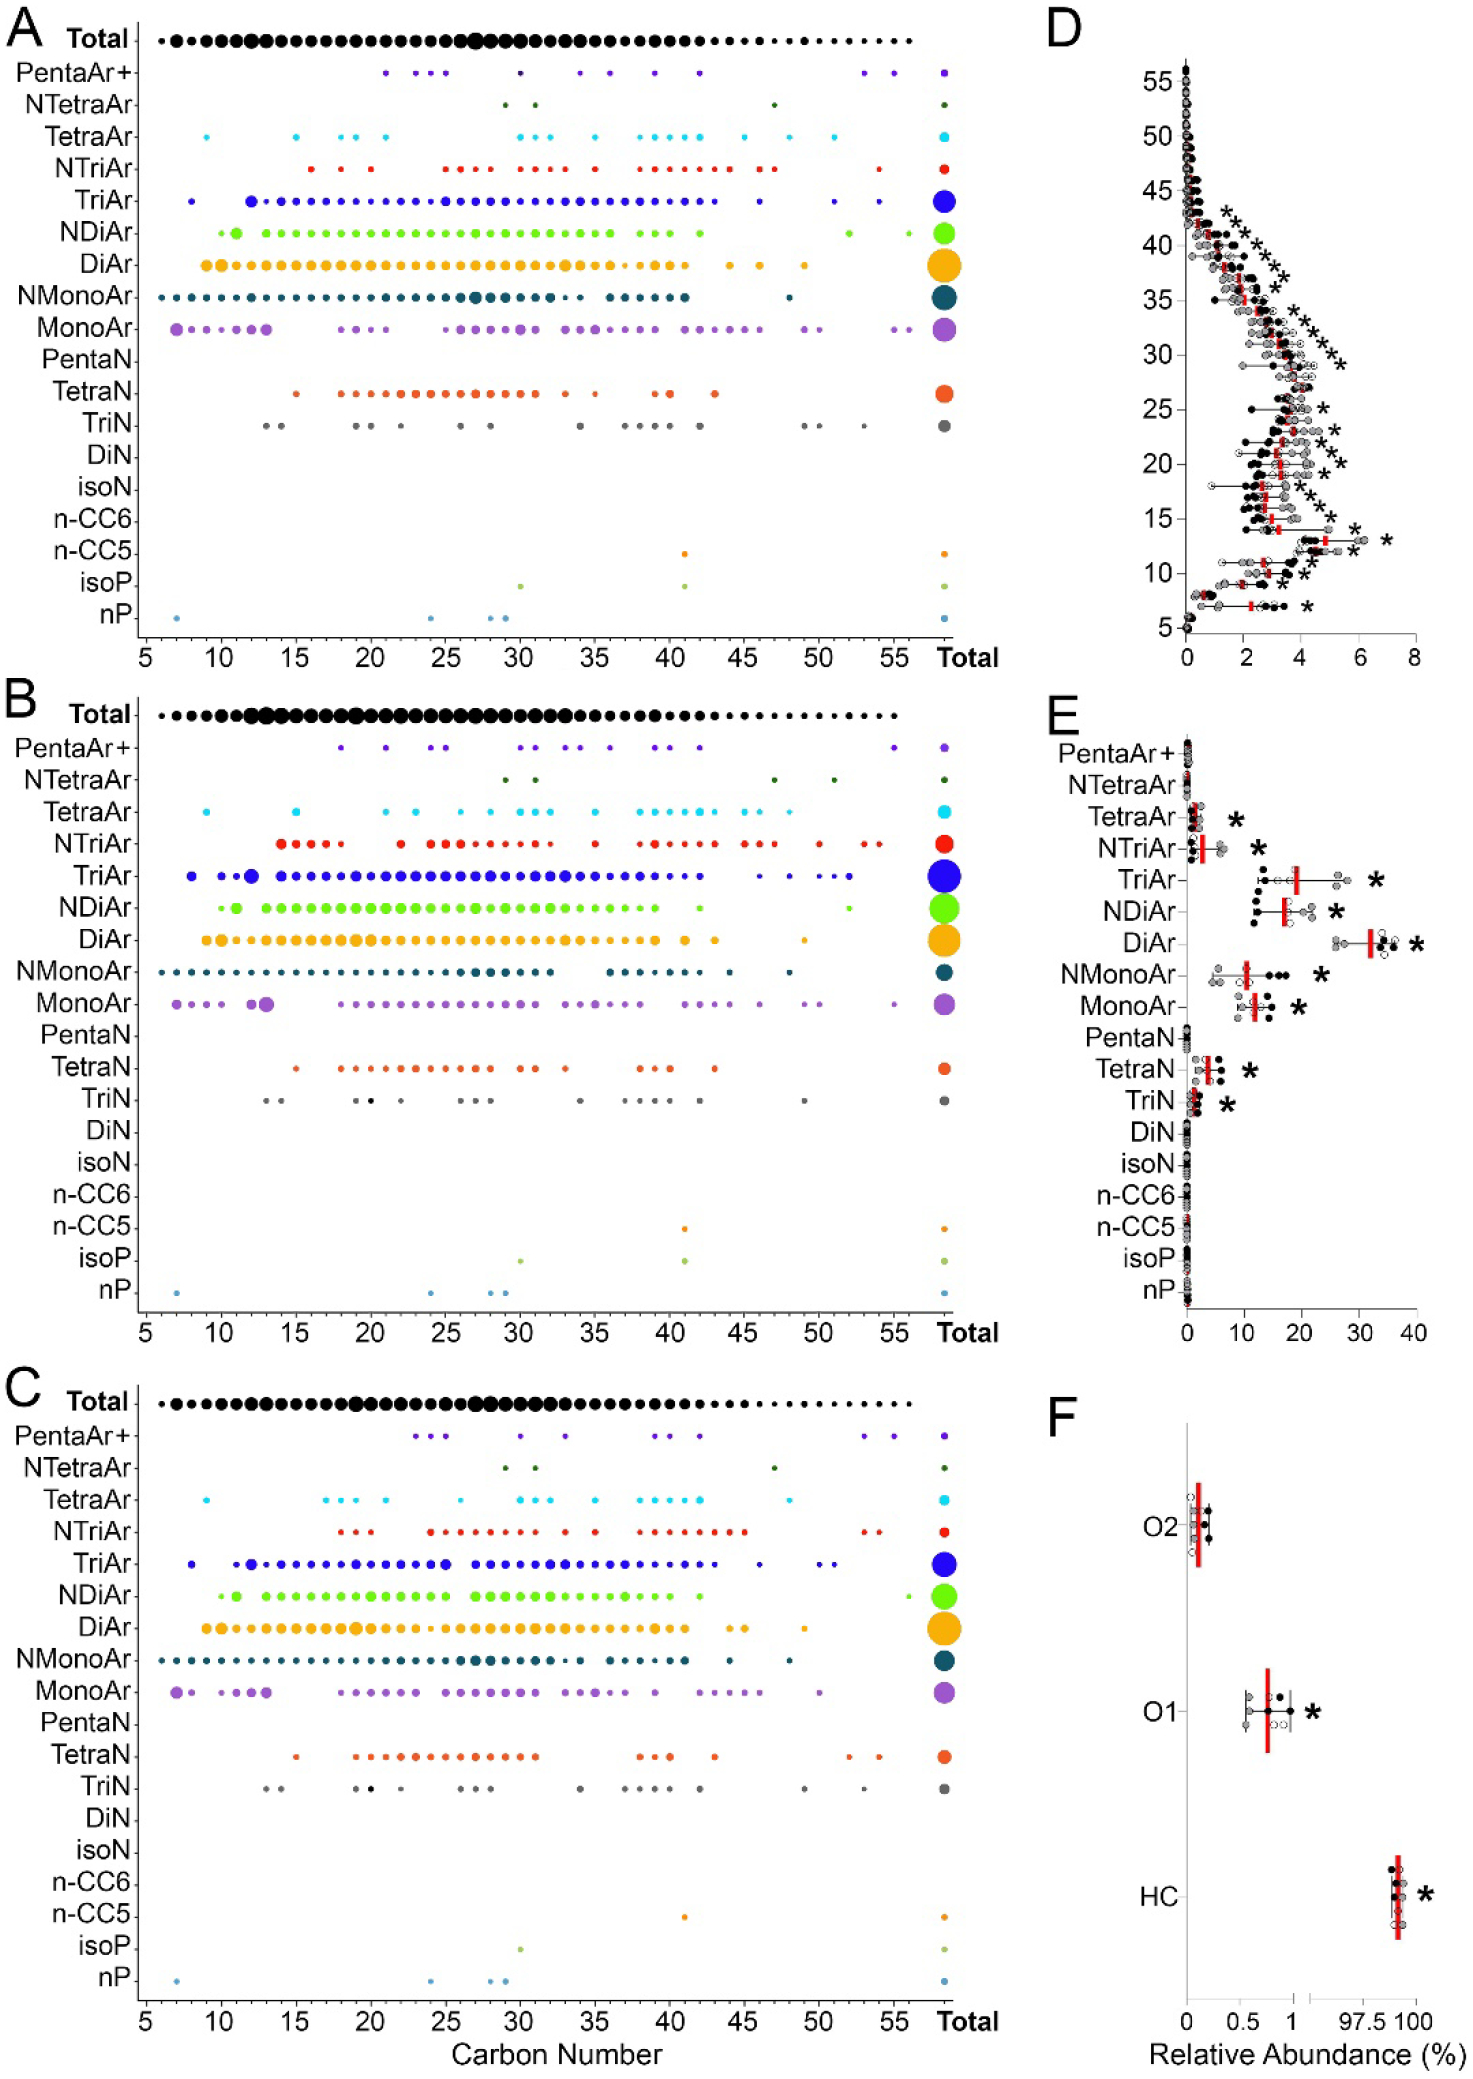
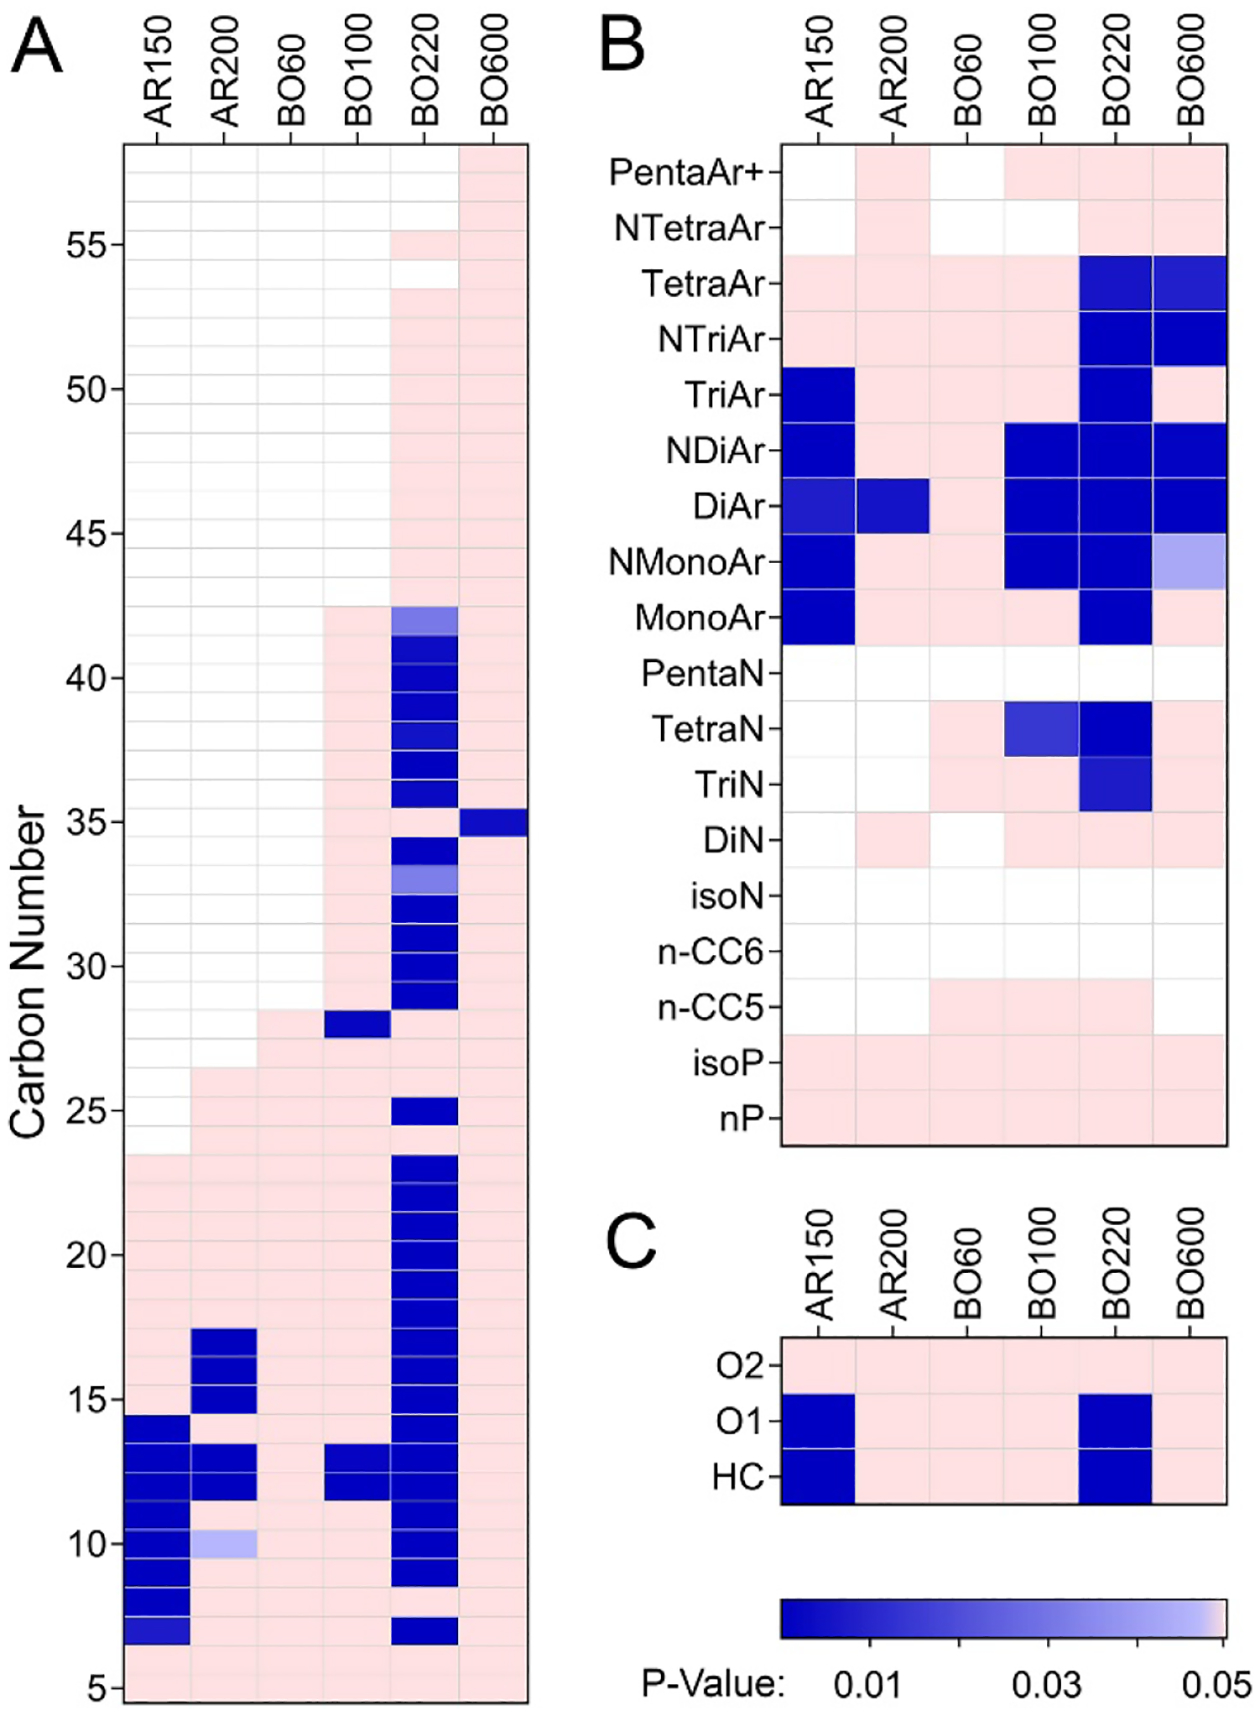
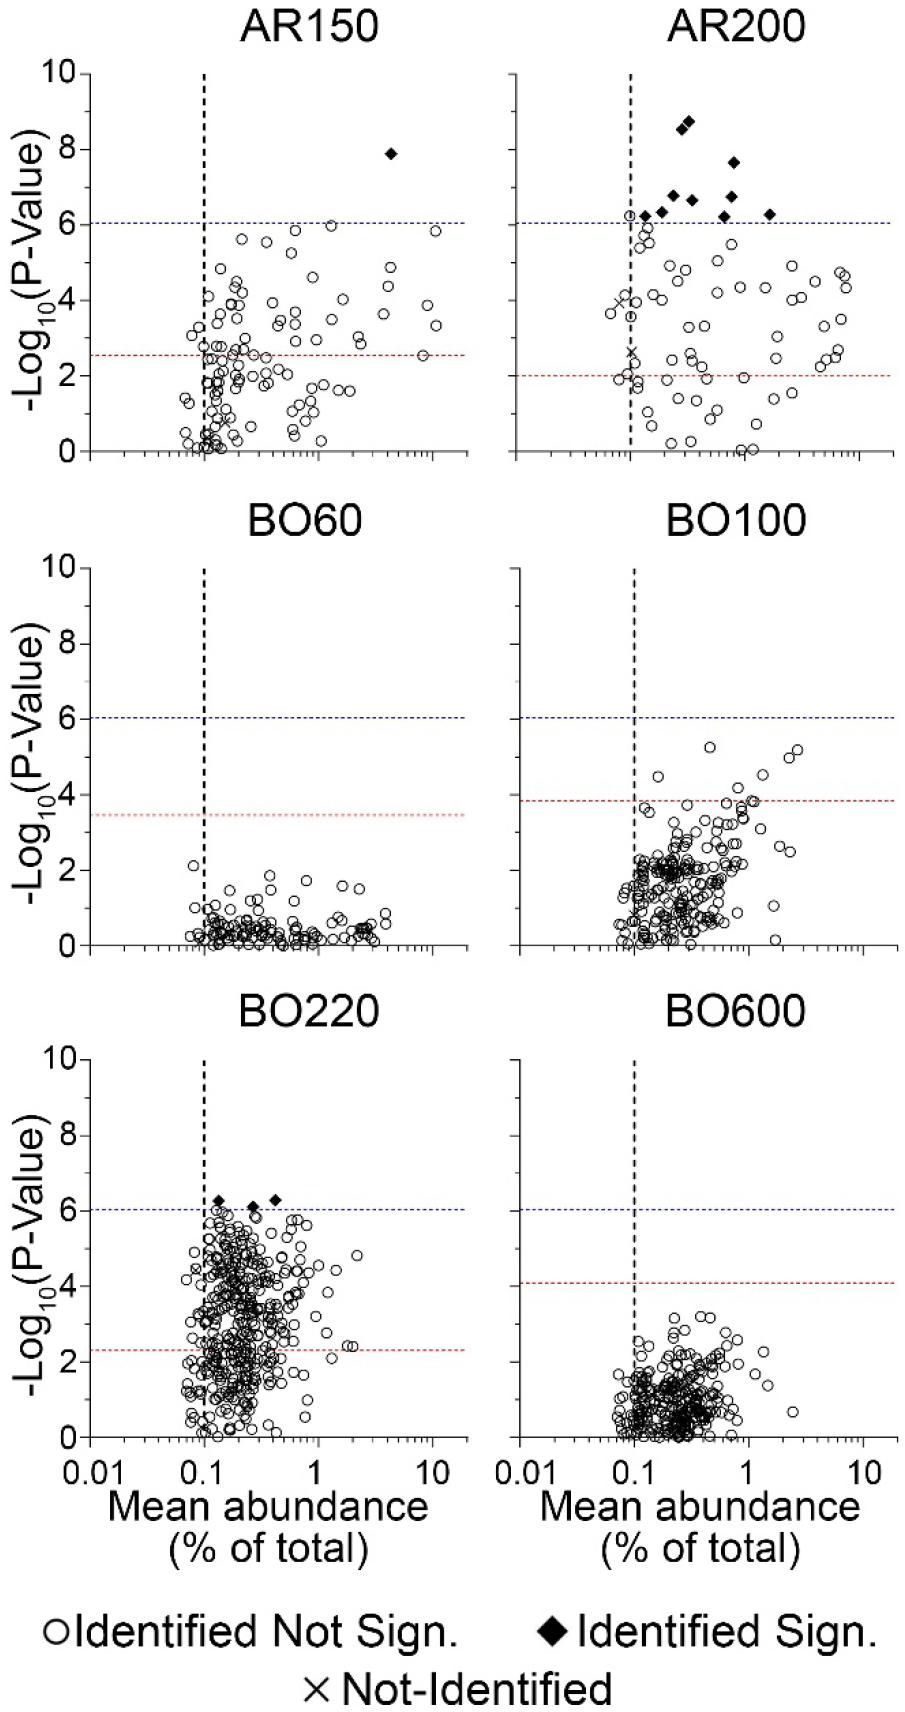
In the process of registration of substances of Unknown or Variable Composition, Complex Reaction Products or Biological Materials (UVCBs), information sufficient to enable substance identification must be provided. Substance identification for UVCBs formed through petroleum refining is particularly challenging due to their chemical complexity, as well as variability in refining process conditions and composition of the feedstocks. This study aimed to characterize compositional variability of petroleum UVCBs both within and across product categories. We utilized ion mobility spectrometry (IMS)-MS as a technique to evaluate detailed chemical composition of independent production cycle-derived samples of 6 petroleum products from 3 manufacturing categories (heavy aromatic, hydrotreated light paraffinic, and hydrotreated heavy paraffinic). Atmospheric pressure photoionization and drift tube IMS-MS were used to identify structurally related compounds and quantified between- and within-product variability. In addition, we determined both individual molecules and hydrocarbon blocks that were most variable in samples from different production cycles. We found that detailed chemical compositional data on petroleum UVCBs obtained from IMS-MS can provide the information necessary for hazard and risk characterization in terms of quantifying the variability of the products in a manufacturing category, as well as in subsequent production cycles of the same product.


Conflict of interest statement

Declaration of interests The authors declare that they have no known competing financial interests or personal relationships that could have appeared to influence the work reported in this paper.

Figures

Figure 1.
Figure 1.. GC-MS full scan analysis of petroleum UVCB products included in this study.
(A) Superimposed GC-MS total ion chromatograms (time vs. abundance) for representative samples (see Table 1 for sample annotations). Individual chromatograms for each sample are shown in Supplemental Figure 1. (B) Hierarchical clustering analysis of the average abundance of the detected compound ion fragments in a mass range of 40–500 amu in 10,127 scans (see Supplemental Table 2 for the raw data). Both samples (columns) and features (rows) were clustered (Spearman correlation, average linkage method). Feature abundance was z-scaled for each sample with lower abundance features indicated by light blue and higher abundance features indicated by dark blue colors.
Figure 2.
Figure 2.. Representative nested IMS-MS spectra (APPI+ ion mode) for petroleum UVCB products included in this study.
Representative samples (see Table 1 for sample annotations) are shown, data for other samples are shown in Supplemental Figure 2. Individual features are shown as dots in the 2D scatterplot where x-axes are m/z, y-axes are drift time, and feature intensities are indicated by the color intensity. The density histograms of the features are shown at the top (for m/z) or on the right (for drift time) of each plot.
Figure 3.
Figure 3.. Unsupervised hierarchical clustering of petroleum UVCB products using IMS-MS data.
Shown are heatmaps (illustrating relative feature abundance) that were products of hierarchical clustering analysis (Spearman correlation, average linkage method) for 16 samples (see Table 1 for sample annotations) analyzed in one of the experimental runs. Technical replicates of each sample were averaged for each feature. (A) Full dataset (Supplemental Table 3A; 55,466 features). (B) Filtered dataset (Supplemental Table 4A; 1,530 features).
Figure 4.
Figure 4.. Inter- and intra-laboratory reproducibility of grouping petroleum UVCB products using untargeted IMS-MS analyses conducted in independent experiments.
The samples were analyzed using an identical experimental protocol either at Texas A&M on the same instrument but by a different operator (A and B) or at NC State University by another operator and instrument, but the same model of IMS-MS platform (C). Correlation values are listed in Supplemental Table 7 and shown using a color gradient as indicated in the legend at the bottom of the figure.
Figure 5.
Figure 5.. The Principal Component Analysis grouping of petroleum UVCB products.
(A) Grouping based on the relative abundance of all features with assigned molecular formulas (Supplemental Table 5). (B) Grouping based on the carbon chain length distribution (Supplemental Table 8). (C) Grouping based on the hydrocarbon class (Supplemental Table 8). (D) Grouping based on the heteroatom profile (Supplemental Table 9). Colors represent individual samples of the same product as indicated in the legend at the bottom of the figure.
Figure 6.
Figure 6.. Hydrocarbon block matrix for samples from independent manufacturing cycles of product BO220.
(A–C) Dot plots representing the relative abundance (each sample is scaled to 100%) of the constituents in different hydrocarbon blocks (hydrocarbon class vs carbon chain length) in three independent samples (see Supplemental Tables 8–9 for data on each product). (D–F) Relative abundance distribution for the carbon chain length (D), hydrocarbon class (E) and heteroatom content (F) where symbols represent individual technical replicates (same color) of the samples from independent manufacturing cycles (shades of gray). Red vertical lines are mean and whiskers are min-max range. Asterisks (*) denote blocks with statistically significant (padj-value <0.05, Supplemental Table 10) variability among samples of product BO220 from independent manufacturing cycles.
Figure 7.
Figure 7.. Variability in hydrocarbon blocks (A–B) and heteroatom content (C) for independent manufacturing cycles of petroleum UVCB products.
Heatmaps show whether relative abundance of the constituents in different hydrocarbon blocks or heteroatom classes were significantly variable (padj<0.05, see Supplemental Table 9) among samples from independent manufacturing cycles. Colors represent significance (see legend at the bottom of the figure, white indicates that there were no constituents in that hydrocarbon block).
Figure 8.
Figure 8.. Identification of the individual features that are both abundant and significantly variable among samples from independent manufacturing cycles of each petroleum UVCB product.
The scatted plots show features that were present in each product based on their relative abundance (x-axis) and significance in variability (y-axis, p-values were converted to −Log10 values). Vertical dotted lines indicate the 0.1% relative abundance threshold. Horizontal lines indicate product-specific (red dotted line corresponding to the p-value at false discovery rate of 5%) and global (across all samples, −Log10(p-value) = 6.05, blue dotted lines) thresholds for multiple-corrected significance values. Black diamonds indicate features that were exceeding both global variability significance and abundance thresholds (see Table 2 for the complete list). Open circles (features with molecular formulae assigned) and “x” symbols (no molecular formulae assigned) indicate features that were not significant based on the global variability significance threshold.

Similar articles

Cited by

References

    1. Kaiser MJ, A review of refinery complexity applications, Pet Sci, 14 (2017) 167–194.
    1. Salvito D, Fernandez M, Jenner K, Lyon DY, de Knecht J, Mayer P, MacLeod M, Eisenreich K, Leonards P, Cesnaitis R, Leon-Paumen M, Embry M, Deglin SE, Improving the Environmental Risk Assessment of Substances of Unknown or Variable Composition, Complex Reaction Products, or Biological Materials, Environ Toxicol Chem, 39 (2020) 2097–2108. - PMC - PubMed
    1. CONCAWE, REACH – Analytical characterisation of petroleum UVCB substances, in, Brussels, Belgium, 2012.
    1. Clark CR, McKee RH, Freeman JJ, Swick D, Mahagaokar S, Pigram G, Roberts LG, Smulders CJ, Beatty PW, A GHS-consistent approach to health hazard classification of petroleum substances, a class of UVCB substances, Regulatory toxicology and pharmacology : RTP, 67 (2013) 409–420. - PubMed
    1. ECHA, Guidance for identification and naming of substances under REACH and CLP, in, European Chemical Agency, Helsinki, Finland, 2017.

LinkOut - more resources