

doi: 10.1016/j.jue.2021.103328.
Epub 2021 Feb 12.
JUE Insight: Measuring movement and social contact with smartphone data: a real-time application to COVID-19
Affiliations
- PMID: 35250113
- PMCID: PMC8886508
- DOI: 10.1016/j.jue.2021.103328
Item in Clipboard
JUE Insight: Measuring movement and social contact with smartphone data: a real-time application to COVID-19
J Urban Econ.
2022 Jan.
Abstract
Tracking human activity in real time and at fine spatial scale is particularly valuable during episodes such as the COVID-19 pandemic. In this paper, we discuss the suitability of smartphone data for quantifying movement and social contact. These data cover broad sections of the US population and exhibit pre-pandemic patterns similar to conventional survey data. We develop and make publicly available a location exposure index that summarizes county-to-county movements and a device exposure index that quantifies social contact within venues. We also investigate the reliability of smartphone movement data during the pandemic.
© 2021 Elsevier Inc. All rights reserved.
Figures
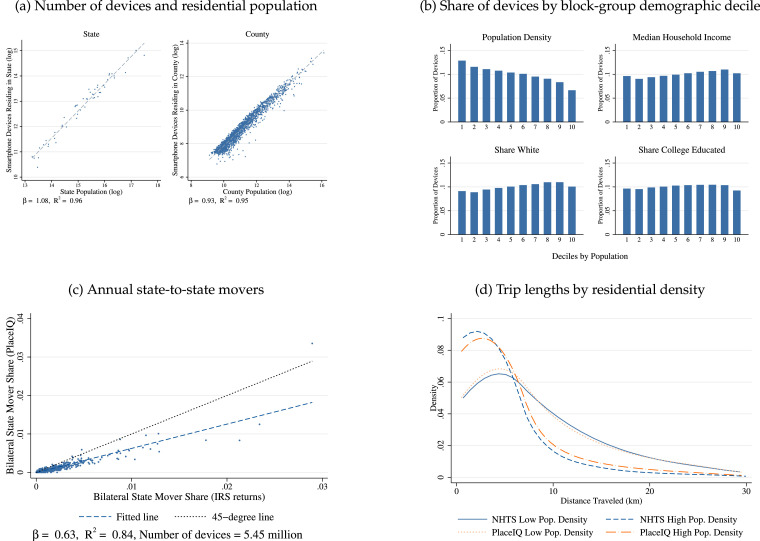
Spatial and Demographic Balance of Device Populations. Notes: Panel A compares the number of devices residing in a geographic unit as of March 1, 2020 (vertical axis) to the Census’s estimated 2019 residential population (horizontal axis) for all states, and for the 2,018 counties in the DEX and LEX. Panel B depicts the share of devices residing in block groups as of March 1, 2020 in each within-county decile of population density, median household income, share of white residents, and share of residents over 25 years with a bachelor’s degree or higher. These block group characteristics are from the 2014–2018 American Community Survey. Panel C compares state-to-state residential changes in 2017–2018 IRS Migration Data to 2019 PlaceIQ data. The horizontal axis is the share of tax filers in state who filed in state the previous year. The vertical axis is the share of devices residing in state in the last week of 2019 that resided in state in the first week of 2019. Non-movers () are excluded. Panel D depicts a kernel density plot of trip length in kilometers, for trips from home to a commercial venue in the PlaceIQ data from November 2, 2019 through February 1, 2020 and in the 2017 NHTS, for residents of block groups in the top and bottom quartile of the population-density distribution.
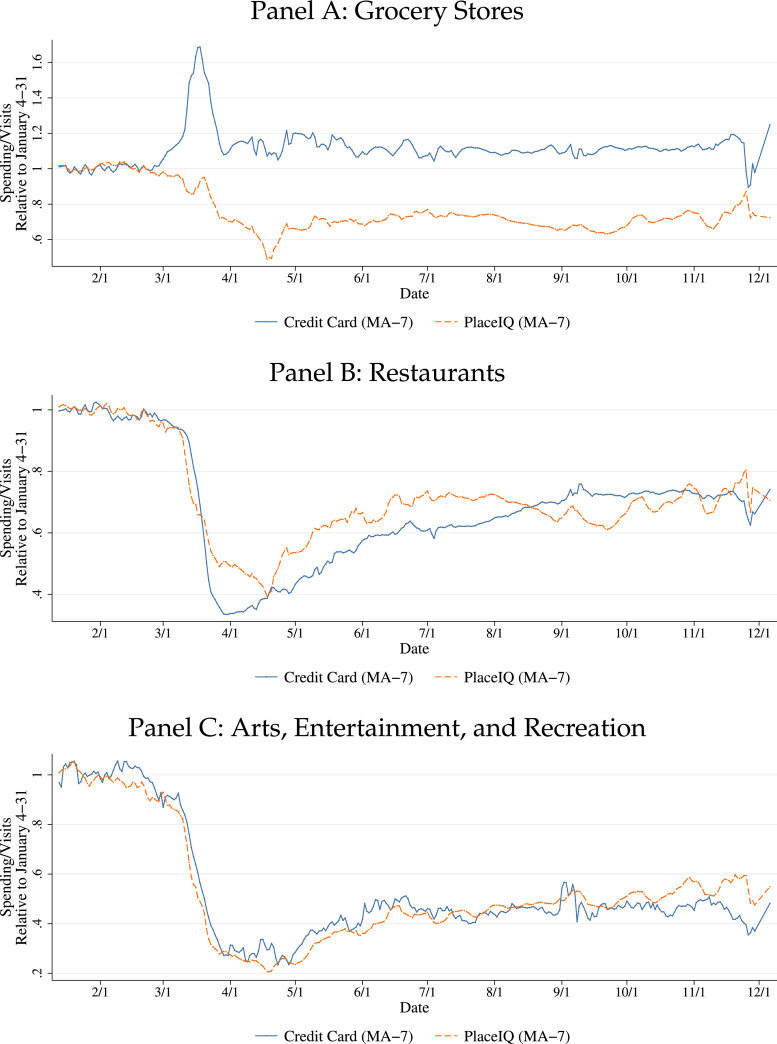
Smartphone visits and Affinity expenditures Notes : This figure depicts total smartphone visits to grocery stores, restaurants, and arts, entertainment, and recreation (A&E). A&E includes visits to movie theaters, museums, nightclubs, bars, theme parks, and theatres. Credit card data for the same categories comes from Affinity Solutions (Chetty et al., 2020). Both series depict 2020 values relative to 2019 values normalized to the January 4–31 average and smoothed using a 7-day moving average.
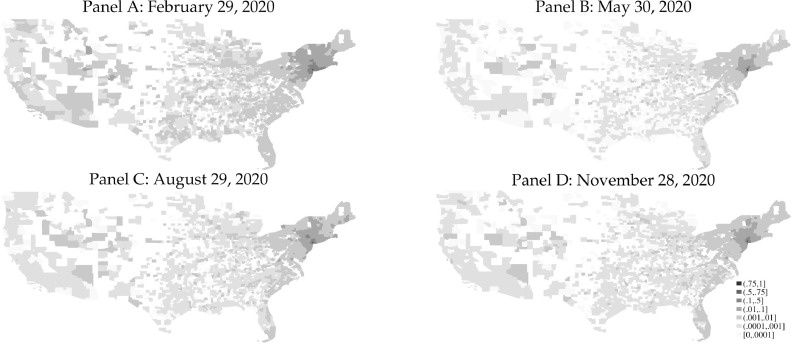
County-Level Exposure to New York County (Manhattan). Notes : Each panel of this figure depicts, for each of 2,018 counties, the share of devices pinging in that county that had pinged in New York, New York during the previous 14 days. The four panels depicts this for four Saturdays in 2020. Using the notation of Section 3, the four panels depict for equal to February 29, May 30, August 29, and November 28, of 2020, where 36061 is the FIPS code for New York County.
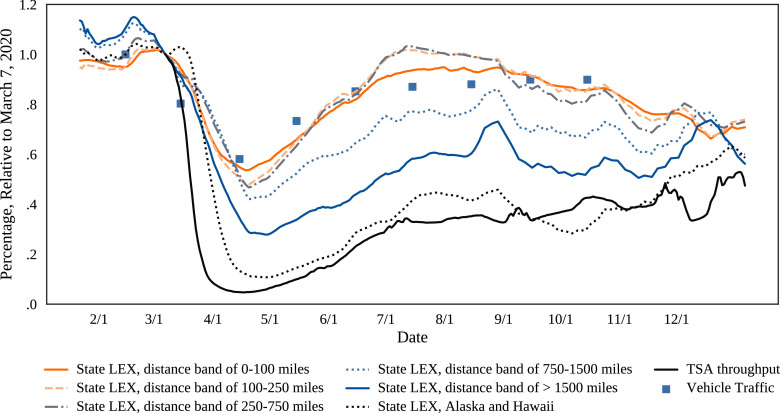
State-level LEX values by distance between states. Notes : This figure depicts average LEX values for pairs of states grouped by the distance between their population-weighted centroids. Each series depicts a 7-day moving average relative to its value on March 7, 2020. The Transportation Security Administration (TSA) throughput series reports the number of travelers passing through TSA checkpoints on each day. Monthly seasonally adjusted vehicle miles traveled comes from the Federal Highway Administration (series TRFVOLUSM227SFWA).
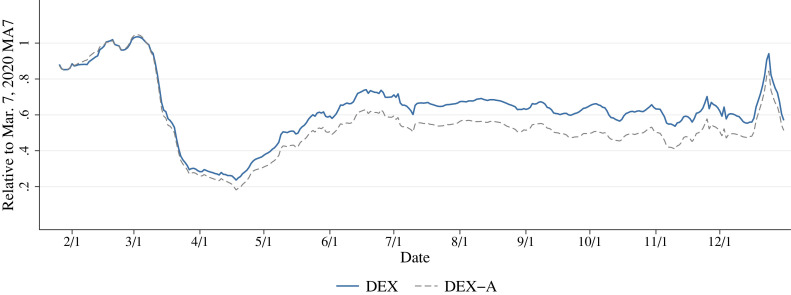
DEX and DEX-A over time. Notes : This figure shows the population-weighted mean unadjusted and adjusted device exposure indices (DEX and DEX-A) over time. The series are smoothed using a 7-day moving average and normalized relative to their value of March 7, 2020.
References
-
- Akovali U., Yilmaz K. Polarized politics of pandemic response and the covid-19 connectedness across the us states. Covid Economics. 2020;57:94–131.
-
- Almagro M., Coven J., Gupta A., Orane-Hutchinson A. Racial disparities in frontline workers and housing crowding during covid-19: Evidence from geolocation data. Available at SSRN 3695249. 2020
-
- Althoff, L., Eckert, F., Ganapati, S., Walsh, C., 2020. The city paradox: Skilled services and remote work.
-
- Apple, 2020. Getting the user’s location. https://developer.apple.com/documentation/corelocation/getting_the_user_....
-
- Athey S., Ferguson B.A., Gentzkow M., Schmidt T. Working Paper 27572. National Bureau of Economic Research; 2020. Experienced Segregation.
LinkOut - more resources
Full Text Sources