. 2022 Feb 16:16:817316.
doi: 10.3389/fnins.2022.817316. eCollection 2022.

Quantitative MR-Neurography at 3.0T: Inter-Scanner Reproducibility

Affiliations

Quantitative MR-Neurography at 3.0T: Inter-Scanner Reproducibility

Fabian Preisner et al. Front Neurosci. .

Abstract

Background: Quantitative MR-neurography (MRN) is increasingly applied, however, the impact of the MR-scanner on the derived parameters is unknown. Here, we used different 3.0T MR scanners and applied comparable MR-sequences in order to quantify the inter-scanner reproducibility of various MRN parameters of the sciatic nerve.

Methods: Ten healthy volunteers were prospectively examined at three different 3.0T MR scanners and underwent MRN of their sciatic nerve using comparable imaging protocols including diffusion tensor imaging (DTI) and T2 relaxometry. Subsequently, inter-scanner agreement was assessed for seven different parameters by calculating the intraclass correlation coefficients (ICCs) and the standard error of measurement (SEM).

Results: Assessment of inter-scanner reliability revealed good to excellent agreement for T2 (ICC: 0.846) and the quantitative DTI parameters, such as fractional anisotropy (FA) (ICC: 0.876), whereas moderate agreement was observed for proton spin density (PD) (ICC: 0.51). Analysis of variance identified significant inter-scanner differences for several parameters, such as FA (p < 0.001; p = 0.02), T2 (p < 0.01) and PD (p = 0.02; p < 0.01; p = 0.02). Calculated SEM values were mostly within the range of one standard deviation of the absolute mean values, for example 0.033 for FA, 4.12 ms for T2 and 27.8 for PD.

Conclusion: This study quantifies the measurement imprecision for peripheral nerve DTI and T2 relaxometry, which is associated with the use of different MR scanners. The here presented values may serve as an orientation of the possible scanner-associated fluctuations of MRN biomarkers, which can occur under similar conditions.

Keywords: biomarkers; magnetic resonance imaging; magnetic resonance neurography; peripheral nervous system; reproducibility of results.


Conflict of interest statement

The authors declare that the research was conducted in the absence of any commercial or financial relationships that could be construed as a potential conflict of interest.

Figures
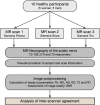
FIGURE 1
FIGURE 1
Flowchart of study design. Ten healthy participants underwent repeated multiparametric MR neurography of their sciatic nerve using three different MR scanners. Subsequent image analysis included standardized post-processing algorithms and quantitative assessment of DTI and T2 relaxometry parameters. Finally, inter-scanner agreement was analyzed, and results are expressed in the form of ICC and SEM.
FIGURE 2
FIGURE 2
MR imaging of the left leg at mid-thigh level acquired in the same individual on three different MR scanners (Prisma, Skyra, and Trio). From top to bottom, the rows show representative images for a T2 turbo spin echo (TSE) sequence, a single-shot echo planar imaging sequence (b0-image), a calculated FA-map and an exemplary T2-map generated by the OsiriX plugin T2 map. Insets show a magnification of the sciatic nerve.
FIGURE 3
FIGURE 3
Descriptive statistics for all DTI (A) and T2 relaxometry (B) parameters, SNR (C) values and all three scans, respectively. SNR was assessed separately for diffusion tensor imaging (SNRDTI) and the T2-relaxometry sequence (SNRT2). Values are illustrated as boxplots to visualize measurement distribution. FA, fractional anisotropy; MD, mean diffusivity; AD, axial diffusivity; RD, radial diffusivity; T2, transverse relaxation time; PD, proton spin density [proportional to proton density per voxel]; SNR, signal-to-noise ratio. Statistical significance is indicated on a level of *p ≤ 0.05, **p ≤ 0.01, and ***p ≤ 0.001.

References

    1. Andreisek G., White L. M., Kassner A., Sussman M. S. (2010). Evaluation of diffusion tensor imaging and fiber tractography of the median nerve: preliminary results on intrasubject variability and precision of measurements. AJR Am. J. Roentgenol. 194 W65–W72. 10.2214/ajr.09.2517 - DOI - PubMed
    1. Balsiger F., Steindel C., Arn M., Wagner B., Grunder L., El-Koussy M., et al. (2018). Segmentation of peripheral nerves from magnetic resonance neurography: a fully-automatic, deep learning-based approach. Front. Neurol. 9:777. 10.3389/fneur.2018.00777 - DOI - PMC - PubMed
    1. Bäumer P., Dombert T., Staub F., Kaestel T., Bartsch A. J., Heiland S., et al. (2011). Ulnar neuropathy at the elbow: MR neurography–nerve T2 signal increase and caliber. Radiology 260 199–206. 10.1148/radiol.11102357 - DOI - PubMed
    1. Baumer P., Kele H., Xia A., Weiler M., Schwarz D., Bendszus M., et al. (2016). Posterior interosseous neuropathy: supinator syndrome vs fascicular radial neuropathy. Neurology 87 1884–1891. 10.1212/wnl.0000000000003287 - DOI - PMC - PubMed
    1. Baumer P., Pham M., Ruetters M., Heiland S., Heckel A., Radbruch A., et al. (2014). Peripheral neuropathy: detection with diffusion-tensor imaging. Radiology 273 185–193. 10.1148/radiol.14132837 - DOI - PubMed

LinkOut - more resources