Review
. 2022 Feb 18:16:747215.
doi: 10.3389/fnhum.2022.747215. eCollection 2022.

Understanding Language Reorganization With Neuroimaging: How Language Adapts to Different Focal Lesions and Insights Into Clinical Applications

Affiliations
Review

Understanding Language Reorganization With Neuroimaging: How Language Adapts to Different Focal Lesions and Insights Into Clinical Applications

Luca Pasquini et al. Front Hum Neurosci. .

Abstract

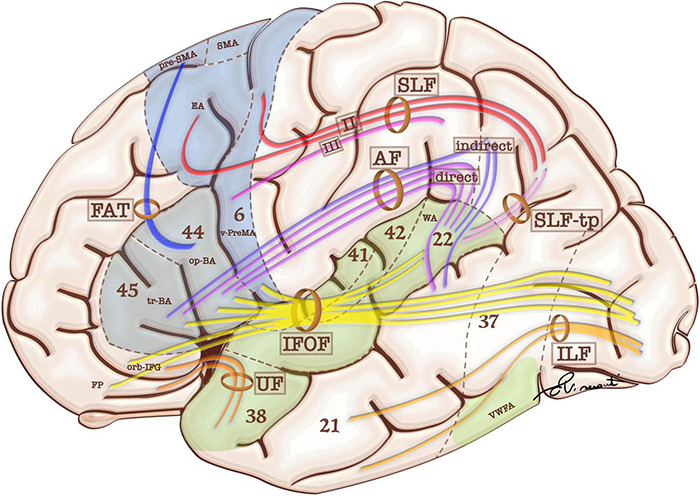
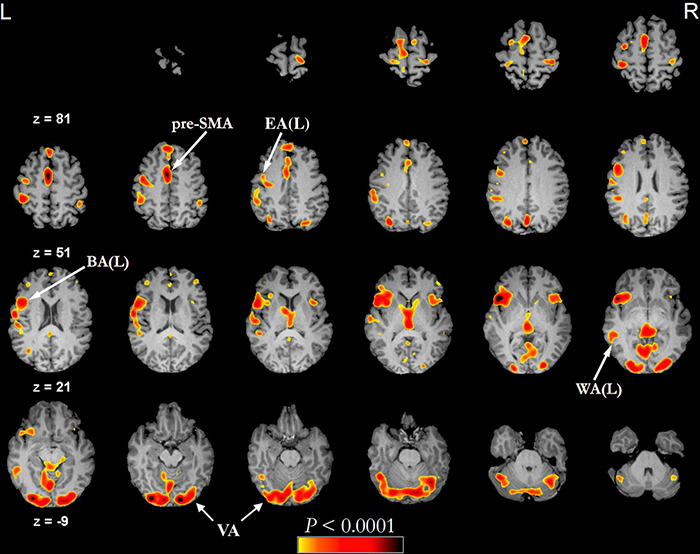
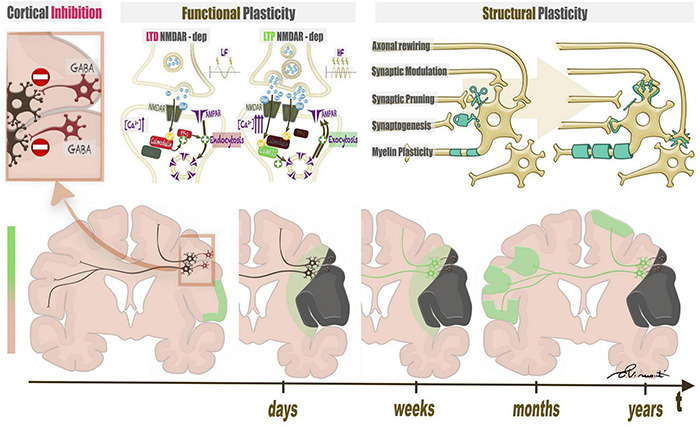
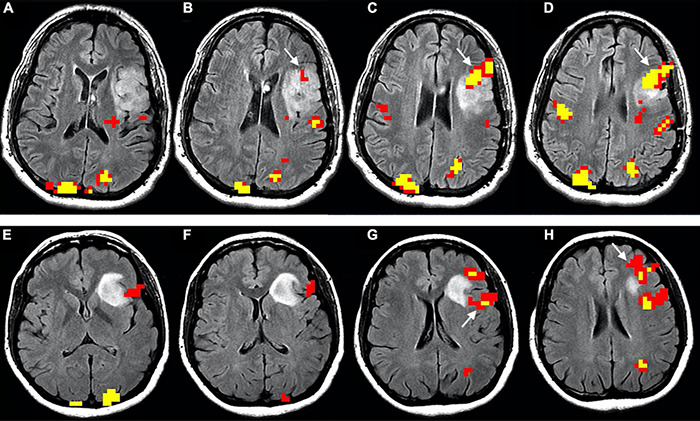
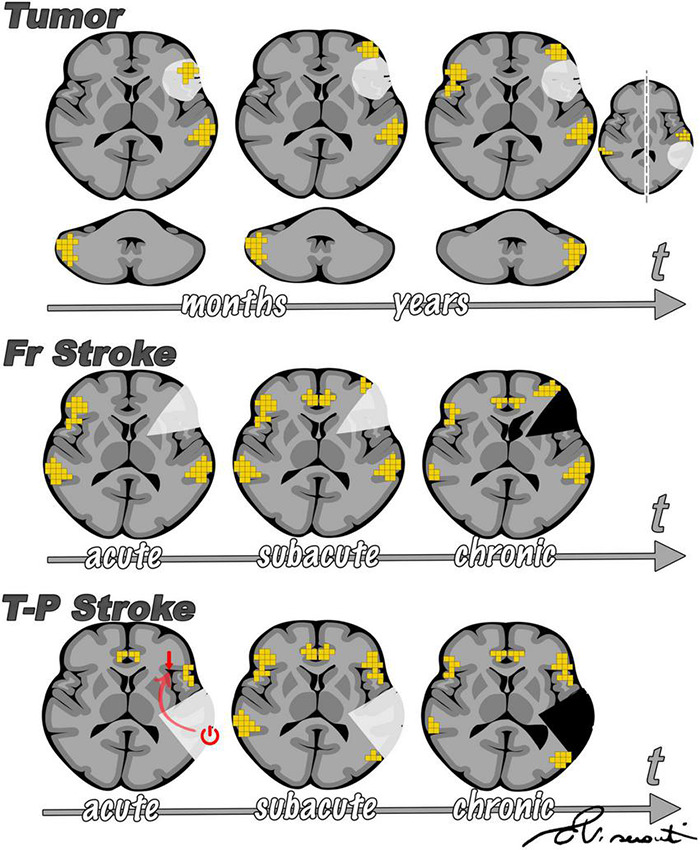
When the language-dominant hemisphere is damaged by a focal lesion, the brain may reorganize the language network through functional and structural changes known as adaptive plasticity. Adaptive plasticity is documented for triggers including ischemic, tumoral, and epileptic focal lesions, with effects in clinical practice. Many questions remain regarding language plasticity. Different lesions may induce different patterns of reorganization depending on pathologic features, location in the brain, and timing of onset. Neuroimaging provides insights into language plasticity due to its non-invasiveness, ability to image the whole brain, and large-scale implementation. This review provides an overview of language plasticity on MRI with insights for patient care. First, we describe the structural and functional language network as depicted by neuroimaging. Second, we explore language reorganization triggered by stroke, brain tumors, and epileptic lesions and analyze applications in clinical diagnosis and treatment planning. By comparing different focal lesions, we investigate determinants of language plasticity including lesion location and timing of onset, longitudinal evolution of reorganization, and the relationship between structural and functional changes.

Keywords: DTI—diffusion tensor imaging; epilepsy; fMRI; language; plasticity; reorganization; stroke; tumor.


Conflict of interest statement

AH is the Owner/President of fMRI Consultants, LLC, a purely educational entity. The remaining authors declare that the research was conducted in the absence of any commercial or financial relationships that could be construed as a potential conflict of interest.

Figures

FIGURE 1
FIGURE 1
Schematic representation of language-relevant cortical areas and white matter tracts comprising the functional and structural language network. Blue areas are more involved in language production, while green areas are more involved in language comprehension. White matter tracts include frontal aslant tract (FAT), superior longitudinal fasciculus (SFL and SFL-tp for the temporal part), and arcuate fasciculus (AF). These bundles participate in the dorsal stream of language. The ventral stream of language includes: uncinate fasciculus (UF), inferior longitudinal fasciculus (ILF), and inferior frontal-occipital fasciculus (IFOF). Language-relevant cortical areas include Broca’s area in the triangular (tr-BA) and opercular (op-BA) part of the inferior frontal gyrus (Brodmann’s areas 45 and 44 respectively); the pre-supplementary motor area (pre-SMA), Exner’s area (EA) and ventral premotor area (v-PreMA) in the premotor cortex (Brodmann’s area 6); Wernicke’s area (WA) in the superior temporal gyrus (Brodmann’s area 22).
FIGURE 2
FIGURE 2
Example of functional activations seen on a phonemic fluency language task (threshold of minimum correlation r = 0.5 (uncorrected p < 0.0001), minimum cluster size of 20 voxels (1280 mm3) administered visually in a healthy subject (43 years old male). In this type of task, the subject is asked to silently generate words starting with a specific letter. The fMRI language activation map is overlayed on the subject’s pre-contrast T1-weighted 3d images after skull stripping. BA, Broca’s area; EA, Exner’s area; pre-SMA, pre-supplementary motor area; VA, visual activation; WA, Wernicke’s area.
FIGURE 3
FIGURE 3
Structural and functional plasticity of language triggered by a focal lesion. The left upper panel represents the baseline condition of the brain, characterized by widespread inhibition mediated by GABA interneurons. When a lesion attacks eloquent brain areas, the damage triggers disinhibition of nearby neural networks, possibly leading to functional and structural plasticity. Functional plasticity (central upper panel) at the synaptic level consists of long term potentiation (LTP) or depotentiation (LTD), which depend on an increase in calcium ions in the post-synaptic neurons of inhibitory and excitatory synapses. Structural plasticity (right upper panel) includes changes in synapses, axons, and myelin coating. The lower panel represents a timeline of plastic changes in the brain. After lesion onset, perilesional and contralateral modifications follow.
FIGURE 4
FIGURE 4
Functional reorganization of language in two right-handed patients with low-grade glioma invading the left inferior frontal gyrus, displayed as functional overlay of phonemic fluency task on axial FLAIR images. The images above (A–D) show functional activation inside the tumor (white arrows) in a 50-year-old male, corresponding to the expected location of BA. The images below (E–H) display functional activation in a 38-year-old female. The activation surrounds the tumor in the opercular Broca’s area [white arrow in panel (G)] and anterior portion of the inferior frontal gyrus, extending to the middle frontal gyrus [white arrow in panel (H)]. Functional activation maps associated with the phonemic fluency task were generated at a threshold of minimum correlation r = 0.5 (uncorrected p = 2 × 10– 11). Voxels showing a minimum cluster size of 20 voxels (1,280 mm3) were selected.
FIGURE 5
FIGURE 5
Longitudinal representation of language plasticity in a 43-year-old right-handed male patient with low-grade glioma invading the left inferior frontal gyrus, displayed as functional overlay of phonemic fluency task on axial FLAIR images. The images above (A–D), obtained in the preoperative setting, show functional activation surrounding the tumor in the inferior frontal gyrus, including the expected location of Broca’s area (white arrow in panel (A)]. The images below (E–H) were obtained at four-year follow-up before a second surgery. A new strong functional activation is visible in the right inferior frontal gyrus, corresponding to Broca’s area homologue (white arrow in panels (E,F)]. The patient underwent awake surgery and direct cortical stimulation of the left inferior frontal gyrus, which demonstrated absence of speech arrest. This finding confirms compensatory shift of language representation to the right side. Functional activation maps associated with the phonemic fluency task were generated at a threshold of minimum correlation r = 0.5 (uncorrected p = 2 × 10– 11). Voxels showing a minimum cluster size of 20 voxels (1,280 mm3) were selected.
FIGURE 6
FIGURE 6
A 29-year-old right-handed woman with sudden onset of fluent aphasia. (Top row) MRI acquired in acute setting; (A) Axial DWI shows a left frontal and thalamic acute ischemia (due to patent foramen ovale); (B) tb-fMRI [verb generation task; p < 0.05; without restriction of cluster size (k = 0)] shows BOLD activation in the contralateral homotopic area (white arrow). The absence of significant activations in the left hemisphere could be caused by changes in the local blood flow secondary to ischemia. Functional activation at the level of the skull shell is related to mild motion artifact. Bottom row: MRI acquired four months after the event; (C) axial FLAIR shows post-ischemic changes in the left frontal and thalamic areas; (D) tb-fMRI [verb generation task; p < 0.05; without restriction of cluster size (k = 0)] shows BOLD activation in the left frontal area (white arrow head), as well as in the contralateral right frontal area (white arrow).
FIGURE 7
FIGURE 7
A 47-year-old woman with chronic (>six months) left ischemia and naming aphasia. (A) tb-fMRI [naming task; p < 0.05; FEW corrected (T = 4.70); without restriction of cluster size (k = 0)] shows high BOLD bilateral activation, especially in the right frontal area; (B) after anomia treatment, naming tb-fMRI [p < 0.05; FEW corrected (T = 4.70); without restriction of cluster size (k = 0)] shows reduced BOLD activation with particular reference to the right hemisphere BOLD signal. These results were interpreted as neural priming with better neural efficient associated with less effort. Courtesy of Nardo et al. (2017) Brain 2017; funded by Wellcome Trust Senior Research Fellowship in Clinical Science (106161/Z/14/Z); MRC Clinical Scientist Fellowship (G0701888).
FIGURE 8
FIGURE 8
Example of atypical lateralization in a patient with drug-resistant epilepsy from perinatal ischemic lesion, displayed on a verb generation task [p < 0.05; FEW corrected; without restriction of cluster size (k = 0)]. (A) T2-weighted images on the axial planes show a large area of cystic encephalomalacia in the outcome of left frontal-insular-parietal perinatal infarction. The fMRI exam performed with a verb generation task (B) documents the activation of right frontal areas, including the inferior frontal gyrus [arrow in panel (B)]. The story listening task (C) documents the activation of right a temporal area [arrow in panel (C)], representing Wernicke’s area homologous.
FIGURE 9
FIGURE 9
Summary of main differences emerging from the comparison of sudden onset (such as stroke) vs. slow onset focal lesions (such as tumors). The figure is intended as a summary of the results of several research studies discussed throughout this review, in line with our observations. In brain tumors (upper panel), fMRI activity is first observed inside the lesion, then in the perilesional tissue, and only later in the contralesional hemisphere. Such findings were proposed by Desmurget et al. (2007) and supported by other studies. Cerebellar activation has been reported to reorganize from a normal contralateral representation to homolateral, as supported by findings from our group (Cho et al., 2018). According to prior studies (Saur et al., 2006), after stroke (central and lower panel) there is initial left-to-right shift of fMRI activation and a progressive return to the left perilesional area, with support of domain-general regions. Diaschisis has more frequently been described arising from temporal-parietal stroke than from frontal lesions (Stockert et al., 2020), influencing language representation in the acute phase (lower panel).

References

    1. Abel S., Weiller C., Huber W., Willmes K., Specht K. (2015). Therapy-induced brain reorganization patterns in aphasia. Brain 138 1097–1112. 10.1093/brain/awv022 - DOI - PubMed
    1. Adcock J. E., Wise R. G., Oxbury J. M., Oxbury S. M., Matthews P. M. (2003). Quantitative fMRI assessment of the differences in lateralization of language-related brain activation in patients with temporal lobe epilepsy. NeuroImage 18 423–438. 10.1016/S1053-8119(02)00013-7 - DOI - PubMed
    1. Aerts A., Batens K., Santens P., van Mierlo P., Huysman E., Hartsuiker R., et al. (2015). Aphasia therapy early after stroke: behavioural and neurophysiological changes in the acute and post-acute phases. Aphasiology 29 845–871. 10.1080/02687038.2014.996520 - DOI
    1. Almairac F., Duffau H., Herbet G. (2018). Contralesional macrostructural plasticity of the insular cortex in patients with glioma a vbm study. Neurology 91 e1902–e1908. 10.1212/WNL.0000000000006517 - DOI - PubMed
    1. Andreae L. C., Burrone J. (2014). The role of neuronal activity and transmitter release on synapse formation. Curr. Opin. Neurobiol. 27 47–52. 10.1016/j.conb.2014.02.008 - DOI - PMC - PubMed

LinkOut - more resources