. 2022 Feb 17:12:803190.
doi: 10.3389/fmicb.2021.803190. eCollection 2021.

Incorporating Within-Host Diversity in Phylogenetic Analyses for Detecting Clusters of New HIV Diagnoses

Affiliations

Incorporating Within-Host Diversity in Phylogenetic Analyses for Detecting Clusters of New HIV Diagnoses

August Guang et al. Front Microbiol. .

Abstract

Background: Phylogenetic analyses of HIV sequences are used to detect clusters and inform public health interventions. Conventional approaches summarize within-host HIV diversity with a single consensus sequence per host of the pol gene, obtained from Sanger or next-generation sequencing (NGS). There is growing recognition that this approach discards potentially important information about within-host sequence variation, which can impact phylogenetic inference. However, whether alternative summary methods that incorporate intra-host variation impact phylogenetic inference of transmission network features is unknown.

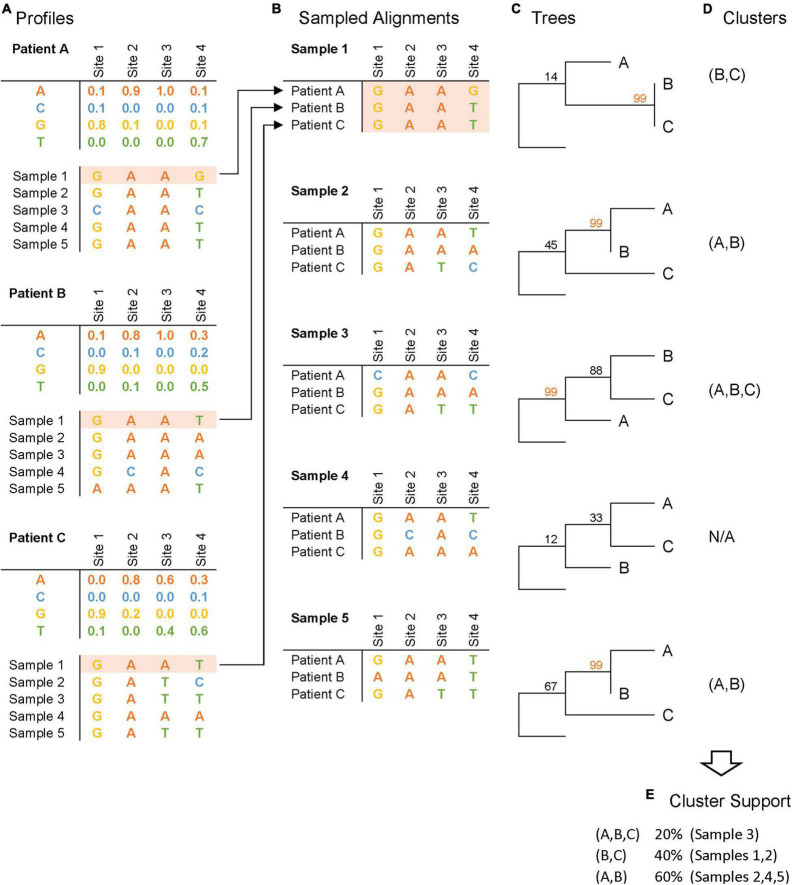
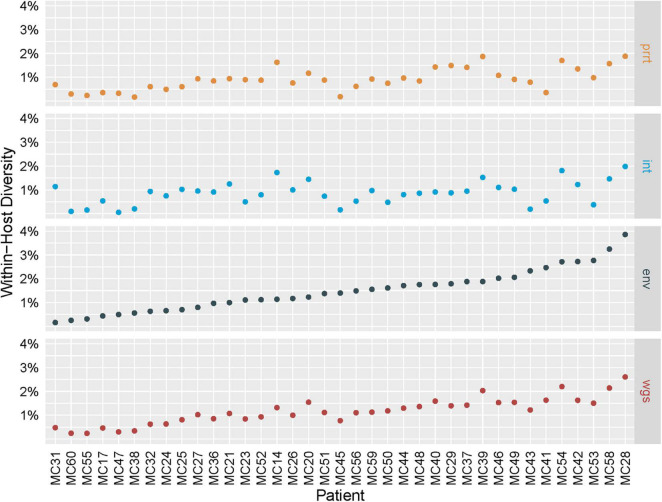
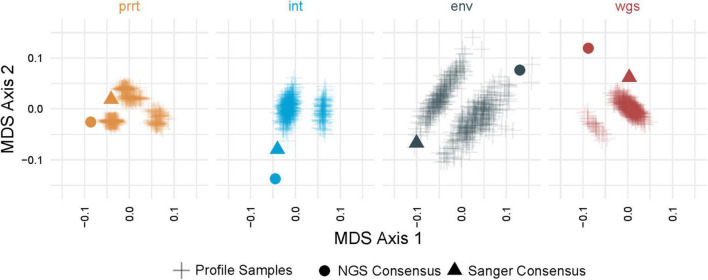
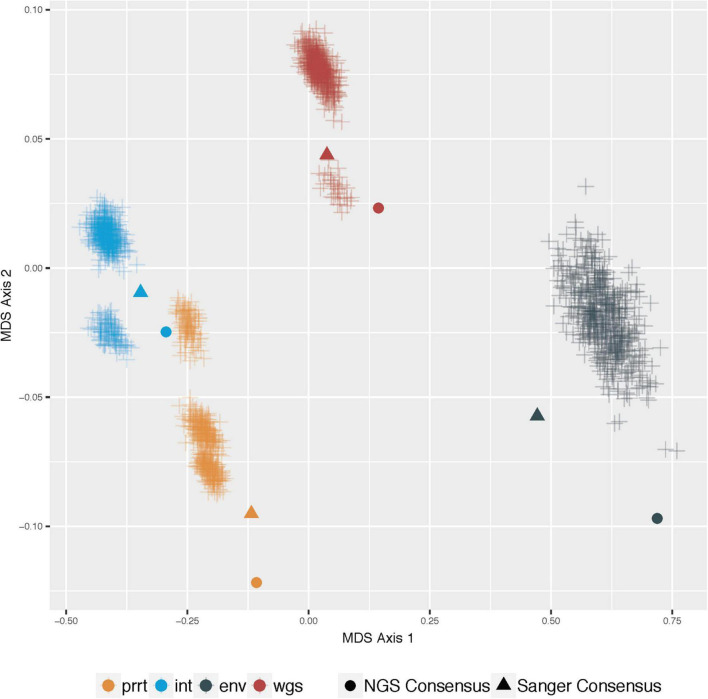
Methods: We introduce profile sampling, a method to incorporate within-host NGS sequence diversity into phylogenetic HIV cluster inference. We compare this approach to Sanger- and NGS-derived pol and near-whole-genome consensus sequences and evaluate its potential benefits in identifying molecular clusters among all newly-HIV-diagnosed individuals over six months at the largest HIV center in Rhode Island.

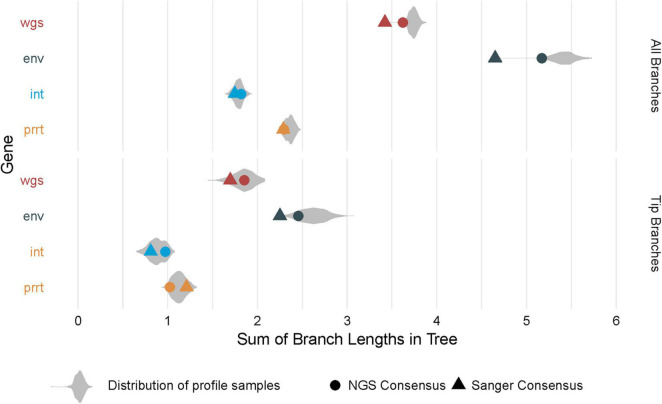
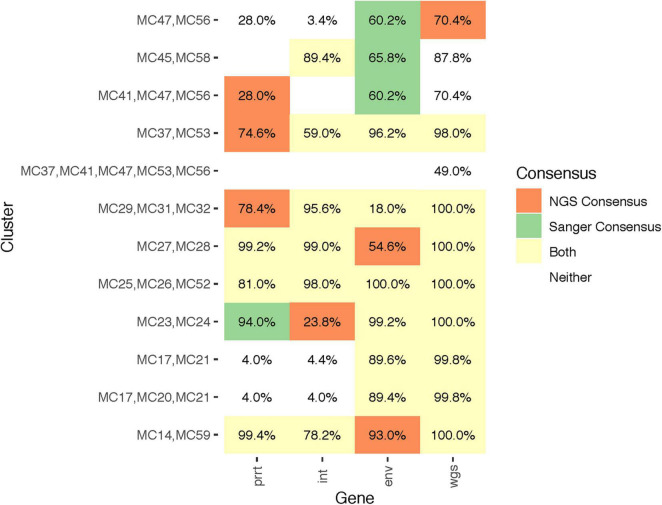
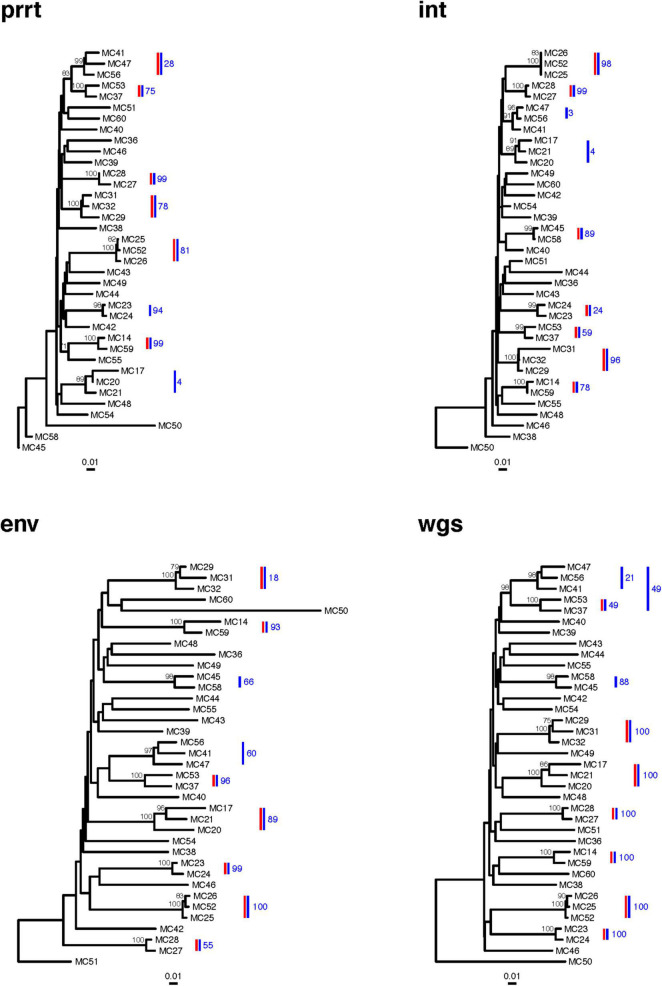
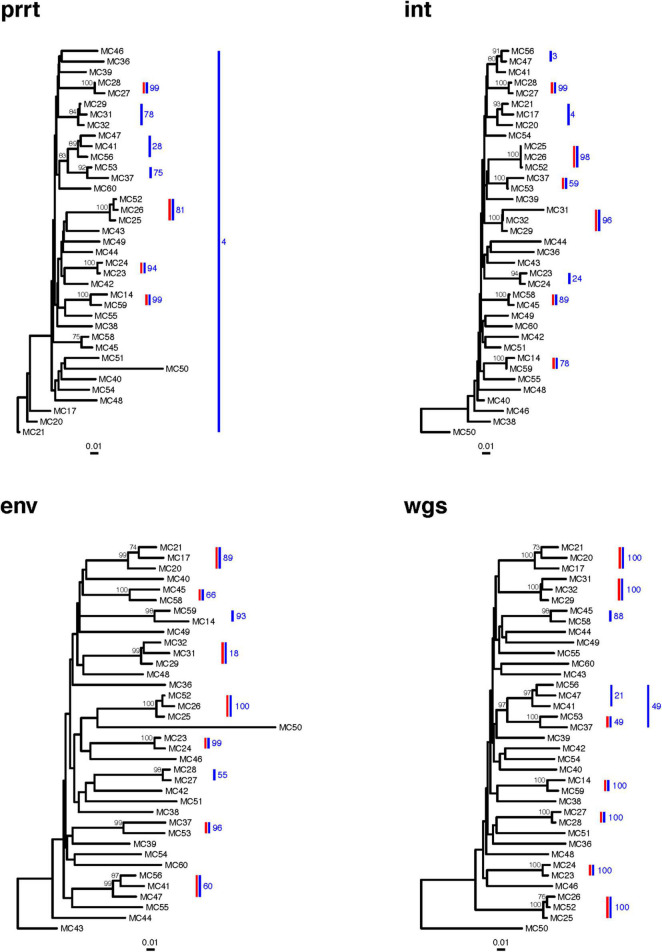
Results: Profile sampling cluster inference demonstrated that within-host viral diversity impacts phylogenetic inference across individuals, and that consensus sequence approaches can obscure both magnitude and effect of these impacts. Clustering differed between Sanger- and NGS-derived consensus and profile sampling sequences, and across gene regions.

Discussion: Profile sampling can incorporate within-host HIV diversity captured by NGS into phylogenetic analyses. This additional information can improve robustness of cluster detection.

Keywords: HIV; cluster inference; consensus sequence; near-whole-genome; next generation sequencing (NGS); phylogenetics; profile sampling; transmission disruption.


Conflict of interest statement

The authors declare that the research was conducted in the absence of any commercial or financial relationships that could be construed as a potential conflict of interest.

Figures

FIGURE 1
FIGURE 1
Profile sampling pipeline. This schematic figure depicts the four steps of the profile sampling process, illustrated here with 5 samples per patient: (A) NGS-derived frequencies at each HIV genome site for each patient are generated, and synthetic sequences are sampled from these frequency tables to summarize intra-host variation; (B) sampled sequences are collated across patients to construct sampled alignments; (C) phylogenetic trees are inferred with bootstrap support from the alignments; (D) clusters are inferred based on phylogenetic bootstrap support (illustrated here with bootstrap support ≥ 99); and (E) cluster support is measured as the frequency that a cluster is inferred across samples.
FIGURE 2
FIGURE 2
Intra-host genetic diversity by genomic region. Intra-host genetic diversity (Y axis; defined as the average percent difference across all pairwise comparisons of the 500 profile-sampled nucleotide sequences for an individual) of the four examined genomic regions (gray boxes on the right) in the 37 sampled individuals (X axis) is highest in env for most individuals and lies within the range of previously reported values.
FIGURE 3
FIGURE 3
Multi-dimensional scaling (MDS) of pairwise geodesic distance among maximum-likelihood phylogenies from the profile sampling approach within genomic regions. MDS Axis 1 (X axis) and Axis 2 (Y axis) show that the space of inferred phylogenies is multi-modal for all genomic regions. The phylogenies from NGS and Sanger consensus sequences (dot and triangle) are point estimates that do not capture the full variation in phylogenies that can be inferred from deeply-sequenced NGS data (plus signs) in all examined genomic regions (colors).
FIGURE 4
FIGURE 4
Multi-dimensional scaling (MDS) of pairwise geodesic distance among maximum-likelihood phylogenies from the profile-sampling approach across all genomic regions. MDS Axis 1 (X axis) and Axis 2 (Y axis) show that the space of inferred phylogenies is multi-modal for all genomic regions. The phylogenies from consensus sequences (dot and triangle) are point estimates that do not capture the full variation in phylogenies that can be inferred from deeply-sequenced NGS data (plus signs) in all examined genomic regions (colors).
FIGURE 5
FIGURE 5
Distribution of branch length sums across phylogenies. The figure demonstrates total branch lengths (X axis), in each of the profile-sampled phylogenies (Y axis and colors). The phylogenies from consensus sequences (dot and triangle) can lie at extreme values within these distributions, both when considering the lengths across all branches (top) and the lengths across only the branches at the tips (bottom).
FIGURE 6
FIGURE 6
Quantitative differences in profile-sampled cluster support across genomic regions. The figure illustrates the clusters and their subclusters (Y axis) identified by Sanger versus NGS consensus sequences (colors; see legend) across genomic regions (X axis). Numeric values indicate cluster support from the profile sampling method. A blank cell indicates that the cluster was not detected in that genomic region.
FIGURE 7
FIGURE 7
Next-generation sequencing (NGS) consensus sequence phylogenetic trees of 37 new HIV diagnoses in RI according to genomic region. The figure demonstrates clusters in phylogenetic trees from four genomic regions (prrt-protease reverse transcriptase; int-integrase; env-envelope; wgs-whole genome sequence). Clusters (≥99% bootstrap support) inferred from the phylogenies of NGS consensus sequences (vertical red bars) differ across genomic regions. The largest number of clusters was inferred from int, env, and wgs, and the smallest number from prrt. Profile sampling detected additional clusters (vertical blue bars) and provided a bootstrap-like measure of cluster support (annotation to blue bars). Bootstraps > 70% are shown to the left of the relevant node. Trees are rooted by an HIV-1 group O sequence, which is omitted from the plots.
FIGURE 8
FIGURE 8
Sanger sequence phylogenetic trees of 37 new HIV diagnoses in RI according to genomic region. The figure demonstrates clusters in phylogenetic trees from four genomic regions (prrt-protease reverse transcriptase; int-integrase; env-envelope; wgs-whole genome sequence). Clusters (≥99% bootstrap support) inferred from the phylogenies of Sanger consensus sequences (vertical red bars) differ across genomic regions. The largest number of clusters was inferred from env and wgs, and the smallest number from prrt. Profile sampling detected additional clusters (vertical blue bars) and provided a bootstrap-like measure of cluster support (annotation to blue bars). Bootstraps > 70% are shown to the left of the relevant node. Trees are rooted by an HIV-1 group O sequence, which is omitted from the plots.

References

    1. Allam O., Samarani S., Ahmad A. (2011). Hammering out HIV-1 incidence with Hamming distance. AIDS 25 2047–2048. 10.1097/QAD.0b013e32834bac66 - DOI - PubMed
    1. Bendall M. L., Gibson K. M., Steiner M. C., Rentia U., Pérez-Losada M., Crandall K. A. (2021). HAPHPIPE: haplotype reconstruction and phylodynamics for deep sequencing of intrahost viral populations. Mol. Biol. Evol. 38 1677–1690. 10.1093/molbev/msaa315 - DOI - PMC - PubMed
    1. Billera L. J., Holmes S. P., Vogtmann K. (2001). Geometry of the space of phylogenetic trees. Adv. Appl. Math. 27 733–767.
    1. Di Giallonardo F., Töpfer A., Rey M., Prabhakaran S., Duport Y., Leemann C., et al. (2014). Full-length haplotype reconstruction to infer the structure of heterogeneous virus populations. Nucleic Acids Res. 42:e115. 10.1093/nar/gku537 - DOI - PMC - PubMed
    1. Eddy S. R. (2004). What is a hidden Markov model? Nat. Biotechnol. 22 1315–1316. - PubMed

LinkOut - more resources