. 2022 Feb 17:13:838328.
doi: 10.3389/fimmu.2022.838328. eCollection 2022.

Disrupted Peyer's Patch Microanatomy in COVID-19 Including Germinal Centre Atrophy Independent of Local Virus

Affiliations

Disrupted Peyer's Patch Microanatomy in COVID-19 Including Germinal Centre Atrophy Independent of Local Virus

Silvia C Trevelin et al. Front Immunol. .

Abstract

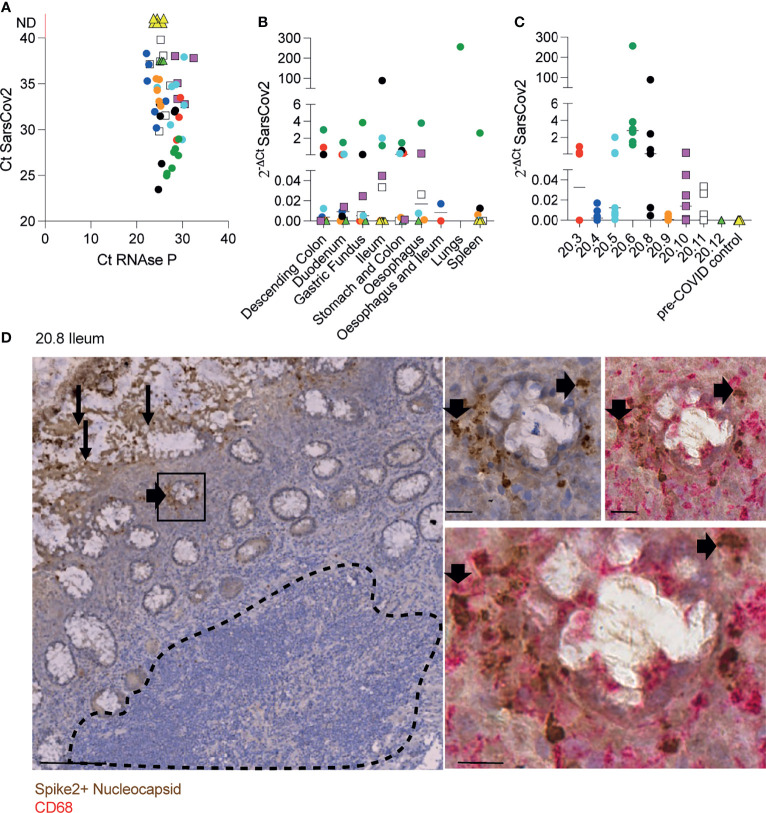
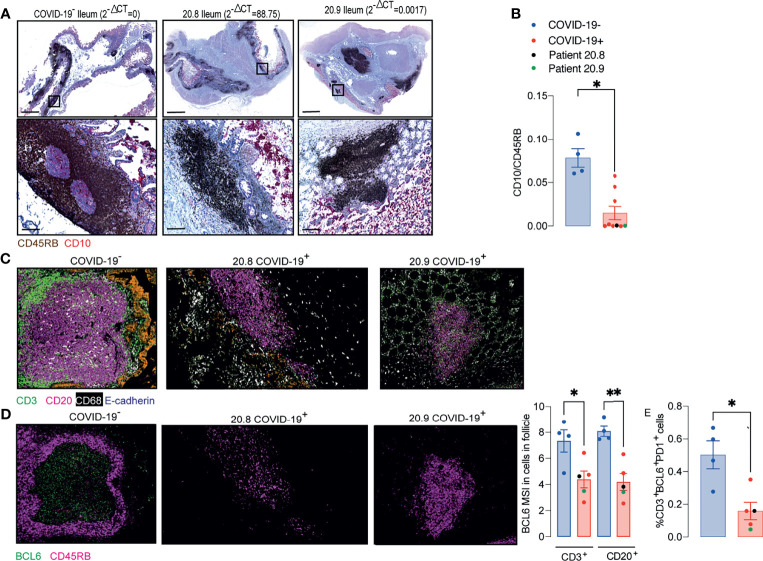
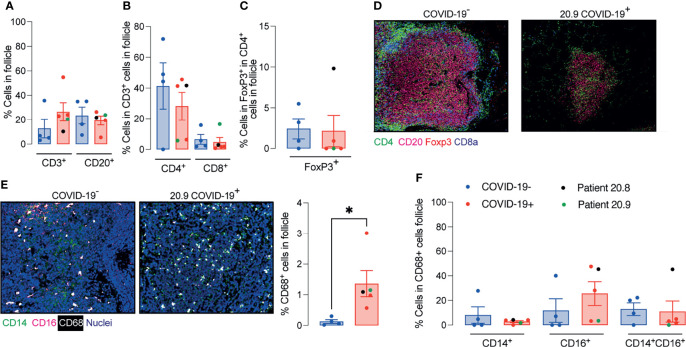
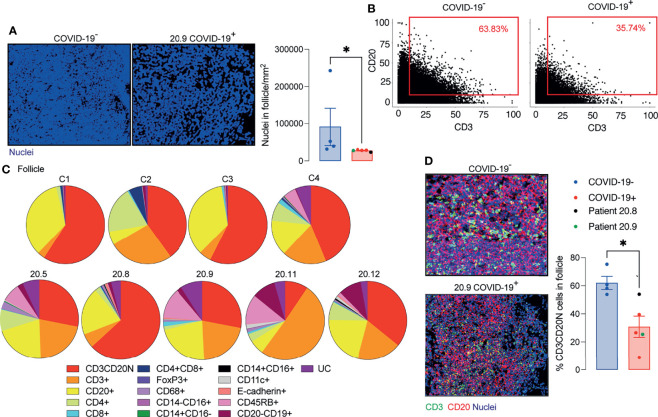
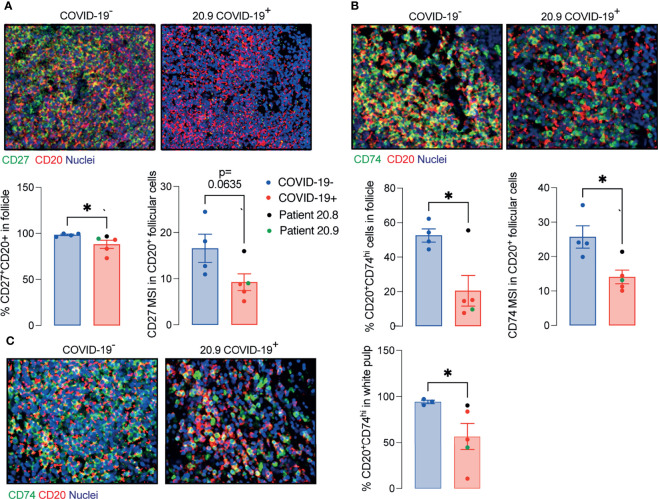
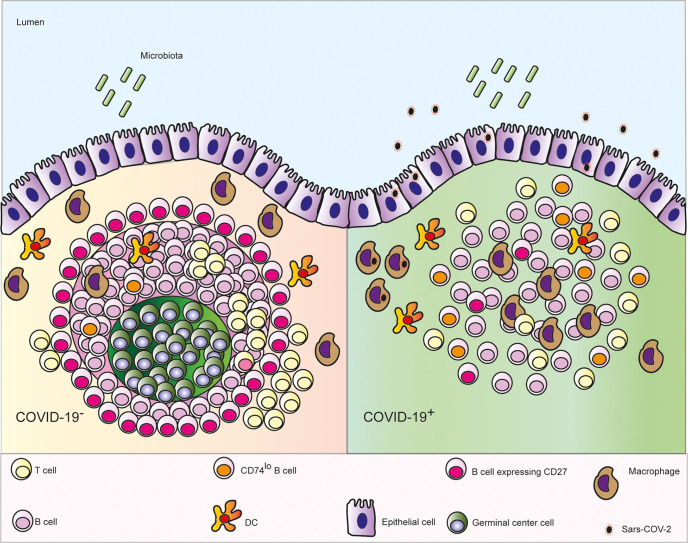
Confirmed SARS-coronavirus-2 infection with gastrointestinal symptoms and changes in microbiota associated with coronavirus disease 2019 (COVID-19) severity have been previously reported, but the disease impact on the architecture and cellularity of ileal Peyer's patches (PP) remains unknown. Here we analysed post-mortem tissues from throughout the gastrointestinal (GI) tract of patients who died with COVID-19. When virus was detected by PCR in the GI tract, immunohistochemistry identified virus in epithelium and lamina propria macrophages, but not in lymphoid tissues. Immunohistochemistry and imaging mass cytometry (IMC) analysis of ileal PP revealed depletion of germinal centres (GC), disruption of B cell/T cell zonation and decreased potential B and T cell interaction and lower nuclear density in COVID-19 patients. This occurred independent of the local viral levels. The changes in PP demonstrate that the ability to mount an intestinal immune response is compromised in severe COVID-19, which could contribute to observed dysbiosis.

Keywords: Peyer’s patches; atrophy of lymphoid follicle; germinal centre; gut Sars-Cov2 infection; severe COVID-19.


Conflict of interest statement

The authors declare that the research was conducted in the absence of any commercial or financial relationships that could be construed as a potential conflict of interest.

Figures

Figure 1
Figure 1
Identification of SARS-CoV-2 in tissue samples along the GI tract. (A-C) Evaluation of SARS-CoV-2 presence using RT-qPCR in different FFPET samples from 9 COVID-19 deceased patients and 4 pre-COVID patients used as controls. Dots represent the viral RNA level from each sample and were coloured by patient. The lines represent the median values per organ (B) or patient (C). (D) IHC for SARS-CoV-2 spike and nucleocapsid proteins in an ileal sample from patient 20.8 showing the virus presence in the epithelium (panel on the left) and sub-mucosal macrophages (panels on the right). Scale bar for image on the left: 100μm. Sale bars for images on the right: 20μm. The dashed line delimitates the GALT.
Figure 2
Figure 2
Peyer’s patches (PP) from COVID-19 patients lose germinal centre. (A, B) IHC for CD45RB (brown) and CD10 (red) in ileal FFPE samples from COVID-19 patients with different local levels of SARS-CoV-2 viral RNA. Images on the top show the whole sections and ileal follicles are highlighted in each of the bottom images. The images on the left represent a sample from one control; the images in the middle represent a sample from a COVID-19 patient with high local levels of viral RNA; and the images on the right represent a COVID-19 patient with low local levels of viral RNA. (B) CD10:CD45RB area ratio. Data is shown as mean ± SEM. (n = 4 controls and 9 patients). Two tailed Mann-Whitney t test. *P < 0.05. (C) Representative images from histoCAT showing CD3 (green), CD20 (magenta), E-cadherin (orange) and CD68 (white) signals in ileal samples. (D) Representative images from histoCAT showing CD45RB (magenta) and BCL6 (green) signals in PP follicle on the left, and mean BCL6 signals in T and B cells on the right. (E) Percentages of BCL6+PD1+ cells T cells. Data is shown as mean ± SEM. (n = 4 controls and 5 patients). Kruskal-Wallis followed Dunn’s post-test. *P < 0.05, **P < 0.001.
Figure 3
Figure 3
Enhanced relative numbers of macrophages in ileal follicles in Peyer’s patches (PP) of COVID-19 patients. (A-C) Percentages of follicular T and B cells, CD4+, CD8+ and CD4+FoxP3+ T cells in ileal Peyer’s Patch (PP) from COVID-19- and COVID-19+ patients. (D) Representative images from histoCAT showing CD4 (green), CD8a (blue), FoxP3 (red) and CD20 (magenta) signals in PPs. (E) Representative images from histoCAT showing CD68 (white), CD14 (green) and CD16 (magenta) signals in PPs on the left, and mean CD68 signals on the right. (F) Percentages of follicular CD14+, CD16+ and CD14+CD16+ cells from CD68+ cell population. Data is shown as mean ± SEM. (n = 4 controls and 5 patients). Kruskal-Wallis followed Dunn’s post-test in (D) and two tailed Mann-Whitney t test in (E). *P < 0.05.
Figure 4
Figure 4
Decreased T and B cell interaction in ileal follicles in Peyer’s patches (PP) of COVID-19 patients. (A) Representative images from histoCAT showing nuclear density in ileal follicles in Peyer’s Patch (PP) from COVID-19- and COVID-19+ patients on the left; and mean data on the right. (B) Dot-plots showing the interaction between T and B cells in ileal follicles. (C) Percentages of different cellular types in follicles from each control and COVID-19+ patient. CD3CD20N: T and B cell neighbours. UC, unclassified cells. (D) Representative images from histoCAT showing CD3 (green) and CD20 (red) merged signals (yellow) on the left the mean of proportions of CD3CD20 neighbours (CD3CD20N) on the right. Data is shown as mean ± SEM. (n = 4 controls and 5 patients). Mann-Whitney t test in (A, D) *P < 0.05.
Figure 5
Figure 5
Decreased memory and antigen-presenting B cells in ileal follicles in Peyer’s patches (PP) of COVID-19 patients. (A) Representative images from histoCAT showing CD27 (green) and CD20 (red) in ileal follicles in Peyer’s Patch (PP) from COVID-19- and COVID-19+ patients on the top. The percentage of CD27+CD20+ cells and mean signal of CD27 in B cells on the bottom. (B) Representative images from histoCAT showing CD74 (green) and CD20 (red) in ileal follicles on the top. The percentage of CD74hiCD20+ cells and mean signal of CD74 in B cells on the bottom. (C) Representative images from histoCAT showing CD74 (green) and CD20 (red) in white pulp from spleen on the left. The percentages of CD74hiCD20+ cells and mean signal of CD74 in B cells on the right. Two tailed Mann-Whitney t test. *P < 0.05.
Figure 6
Figure 6
Schematic depicting the microanatomical features identified in ileal post mortem samples from patients who died with COVID-19: depletion of the germinal centre (GC) in the Peyer’s patches, enhanced numbers of follicular macrophages, decreased interaction between B and T cells, fewer CD27+ memory B cells and lower expression CD74 on B cells.

References

    1. Wang C, Xu J, Wang S, Pan S, Zhang J, Han Y, et al. . Imaging Mass Cytometric Analysis of Postmortem Tissues Reveals Dysregulated Immune Cell and Cytokine Responses in Multiple Organs of COVID-19 Patients. Front Microbiol (2020) 11:600989. doi: 10.3389/fmicb.2020.600989 - DOI - PMC - PubMed
    1. Ferrando-Vivas P, Doidge J, Thomas K, Gould DW, Mouncey P, Shankar-Hari M, et al. . Prognostic Factors for 30-Day Mortality in Critically Ill Patients With Coronavirus Disease 2019: An Observational Cohort Study. Crit Care Med (2021) 49(1):102–11. doi: 10.1097/CCM.0000000000004740 - DOI - PMC - PubMed
    1. Parasa S, Desai M, Thoguluva Chandrasekar V, Patel HK, Kennedy KF, Roesch T, et al. . Prevalence of Gastrointestinal Symptoms and Fecal Viral Shedding in Patients With Coronavirus Disease 2019: A Systematic Review and Meta-Analysis. JAMA Netw Open (2020) 3(6):e2011335. doi: 10.1001/jamanetworkopen.2020.11335 - DOI - PMC - PubMed
    1. Wolfel R, Corman VM, Guggemos W, Seilmaier M, Zange S, Muller MA, et al. . Virological Assessment of Hospitalized Patients With COVID-2019. Nature (2020) 581(7809):465–9. doi: 10.1038/s41586-020-2196-x - DOI - PubMed
    1. Gaebler C, Wang Z, Lorenzi JCC, Muecksch F, Finkin S, Tokuyama M, et al. . Evolution of Antibody Immunity to SARS-CoV-2. Nature (2021) 591(7851):639–44. doi: 10.1038/s41586-021-03207-w - DOI - PMC - PubMed

Publication types