

Early Brain microRNA/mRNA Expression is Region-Specific After Neonatal Hypoxic-Ischemic Injury in a Mouse Model
- PMID: 35251138
- PMCID: PMC8890746
- DOI: 10.3389/fgene.2022.841043
Early Brain microRNA/mRNA Expression is Region-Specific After Neonatal Hypoxic-Ischemic Injury in a Mouse Model
Abstract
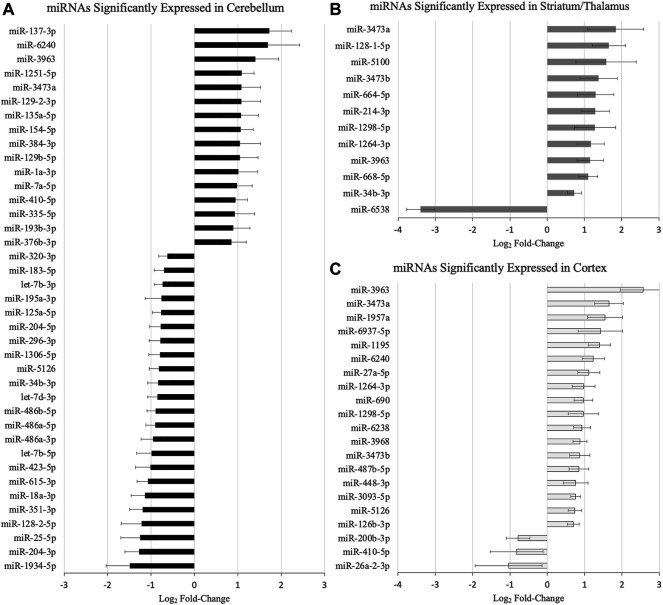
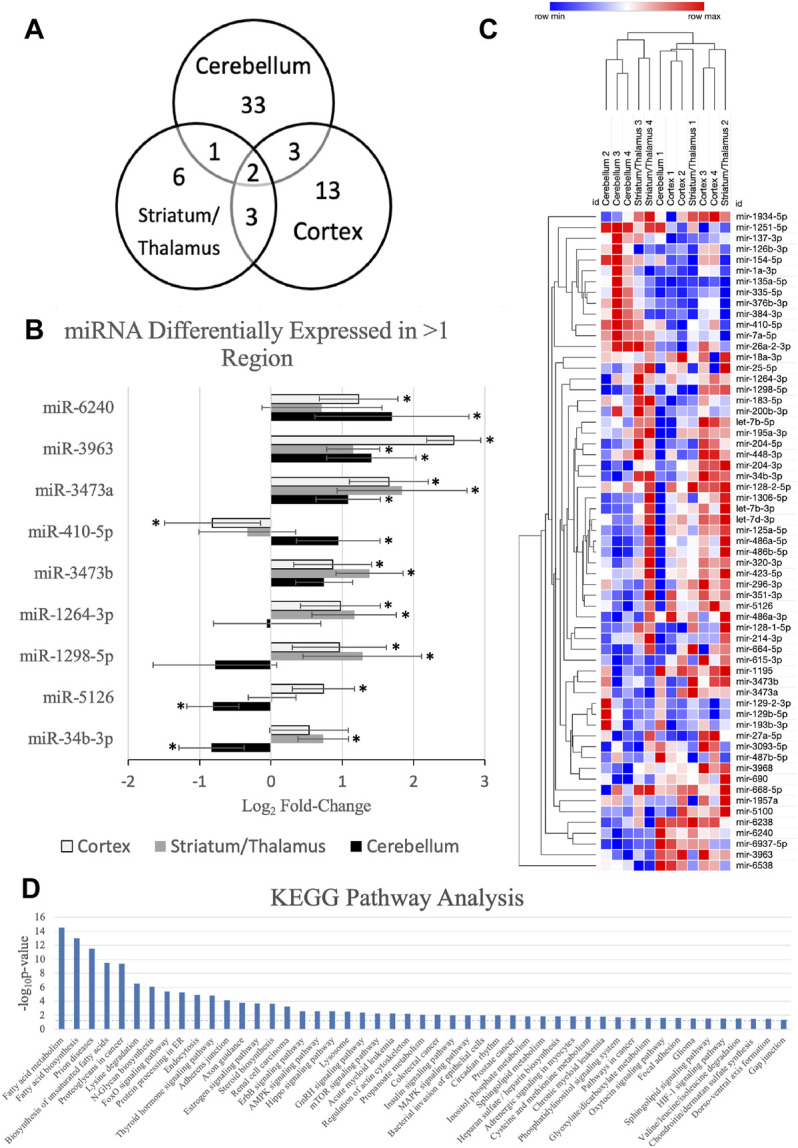
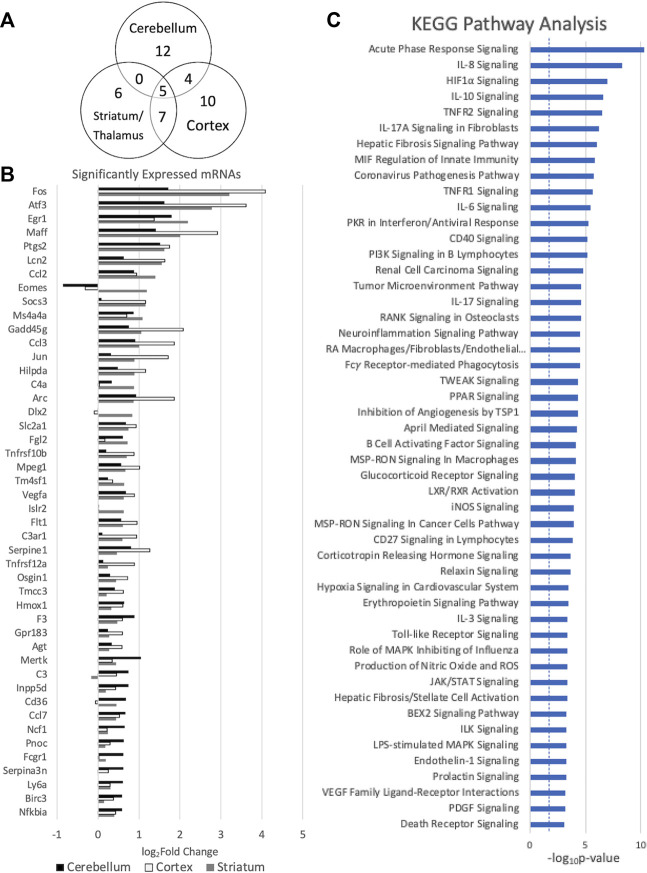
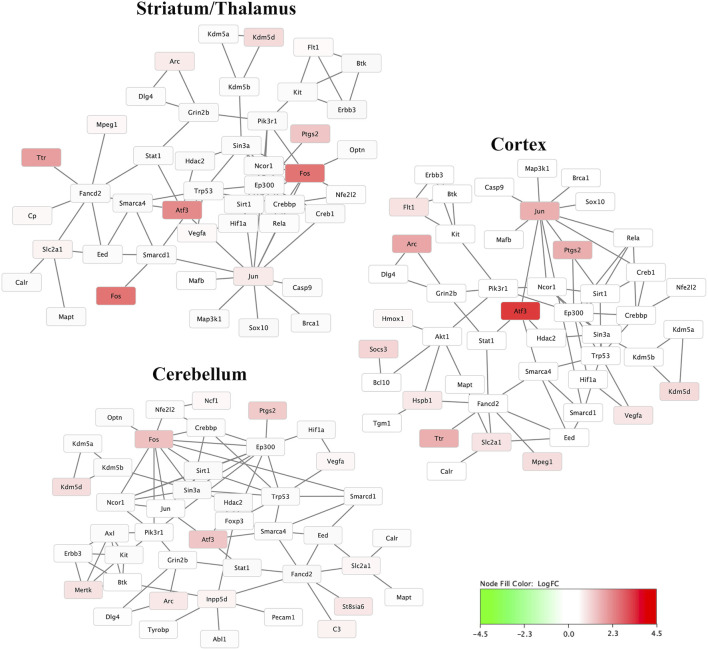
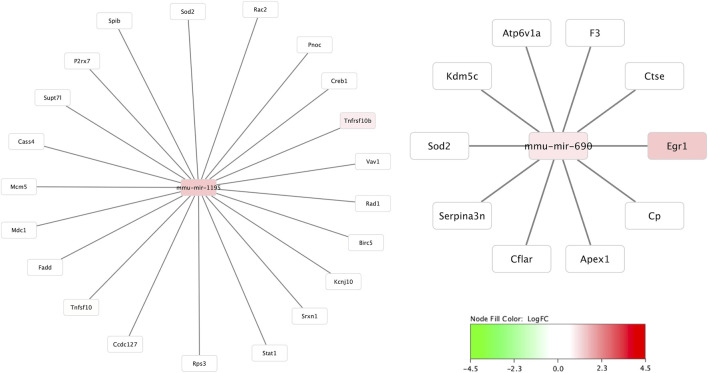
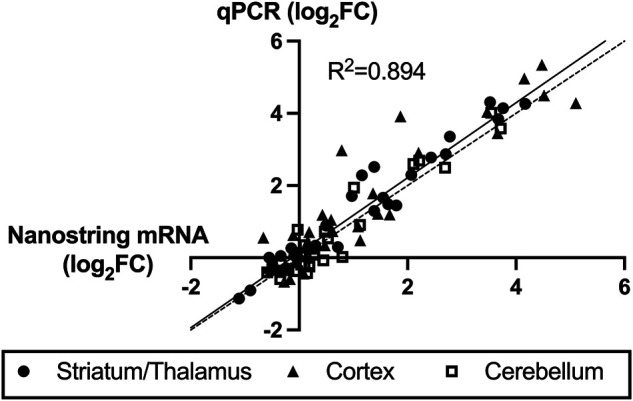
Background: MicroRNAs (miRNAs) may be promising therapeutic targets for neonatal hypoxic-ischemic brain injury (HIBI) but targeting miRNA-based therapy will require more precise understanding of endogenous brain miRNA expression. Methods: Postnatal day 9 mouse pups underwent HIBI by unilateral carotid ligation + hypoxia or sham surgery. Next-generation miRNA sequencing and mRNA Neuroinflammation panels were performed on ipsilateral cortex, striatum/thalamus, and cerebellum of each group at 30 min after injury. Targeted canonical pathways were predicted by KEGG analysis. Results: Sixty-one unique miRNAs showed differential expression (DE) in at least one region; nine in more than one region, including miR-410-5p, -1264-3p, 1298-5p, -5,126, and -34b-3p. Forty-four mRNAs showed DE in at least one region; 16 in more than one region. MiRNAs showing DE primarily targeted metabolic pathways, while mRNAs targeted inflammatory and cell death pathways. Minimal miRNA-mRNA interactions were seen at 30 min after HIBI. Conclusion: This study identified miRNAs that deserve future study to assess their potential as therapeutic targets in neonatal HIBI. Additionally, the differences in miRNA expression between regions suggest that future studies assessing brain miRNA expression to guide therapy development should consider evaluating individual brain regions rather than whole brain to ensure the sensitivity needed for the development of targeted therapies.
Keywords: cerebellum; cortex; encephalopathy; next-generation sequencing; striatum.
Copyright © 2022 Peeples, Sahar, Snyder and Mirnics.
Conflict of interest statement
The authors declare that the research was conducted in the absence of any commercial or financial relationships that could be construed as a potential conflict of interest.
Figures
Similar articles
-
Temporal brain microRNA expression changes in a mouse model of neonatal hypoxic-ischemic injury.Pediatr Res. 2022 Jan;91(1):92-100. doi: 10.1038/s41390-021-01701-5. Epub 2021 Aug 31. Pediatr Res. 2022. PMID: 34465878 Free PMC article.
-
MicroRNA therapeutic targets in neonatal hypoxic-ischemic brain injury: a narrative review.Pediatr Res. 2023 Mar;93(4):780-788. doi: 10.1038/s41390-022-02196-4. Epub 2022 Jul 19. Pediatr Res. 2023. PMID: 35854090 Review.
-
Analysis of microRNA expression detected by microarray of the cerebral cortex after hypoxic-ischemic brain injury.J Craniofac Surg. 2013 Nov;24(6):2147-52. doi: 10.1097/SCS.0b013e3182a243f3. J Craniofac Surg. 2013. PMID: 24220425
-
Intranasal Administration of Extracellular Vesicles Mitigates Apoptosis in a Mouse Model of Neonatal Hypoxic-Ischemic Brain Injury.Neonatology. 2022;119(3):345-353. doi: 10.1159/000522644. Epub 2022 Mar 25. Neonatology. 2022. PMID: 35340004
-
Neonatal Hypoxic-Ischemic Brain Injury Alters Brain Acylcarnitine Levels in a Mouse Model.Metabolites. 2022 May 22;12(5):467. doi: 10.3390/metabo12050467. Metabolites. 2022. PMID: 35629971 Free PMC article.
Cited by
-
Hyperbaric oxygen therapy for the treatment of hypoxic/ischemic injury upon perinatal asphyxia-are we there yet?Front Neurol. 2024 Apr 15;15:1386695. doi: 10.3389/fneur.2024.1386695. eCollection 2024. Front Neurol. 2024. PMID: 38685945 Free PMC article. Review.
References
-
- Cheong J. L., Coleman L., Hunt R. W., Lee K. J., Doyle L. W., Inder T. E., et al. (2012). Prognostic Utility of Magnetic Resonance Imaging in Neonatal Hypoxic-Ischemic Encephalopathy: Substudy of a Randomized Trial. Arch. Pediatr. Adolesc. Med. 166 (7), 634–640. 10.1001/archpediatrics.2012.284 - DOI - PubMed
Grants and funding
LinkOut - more resources
Full Text Sources
Molecular Biology Databases