

Alterations in Gut Microbiota Are Correlated With Serum Metabolites in Patients With Insomnia Disorder
- PMID: 35252021
- PMCID: PMC8892143
- DOI: 10.3389/fcimb.2022.722662
Alterations in Gut Microbiota Are Correlated With Serum Metabolites in Patients With Insomnia Disorder
Abstract
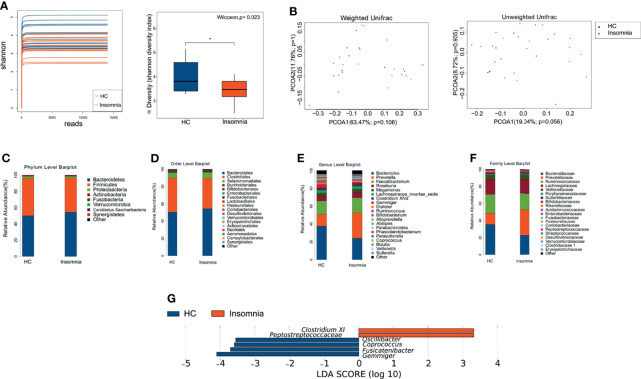
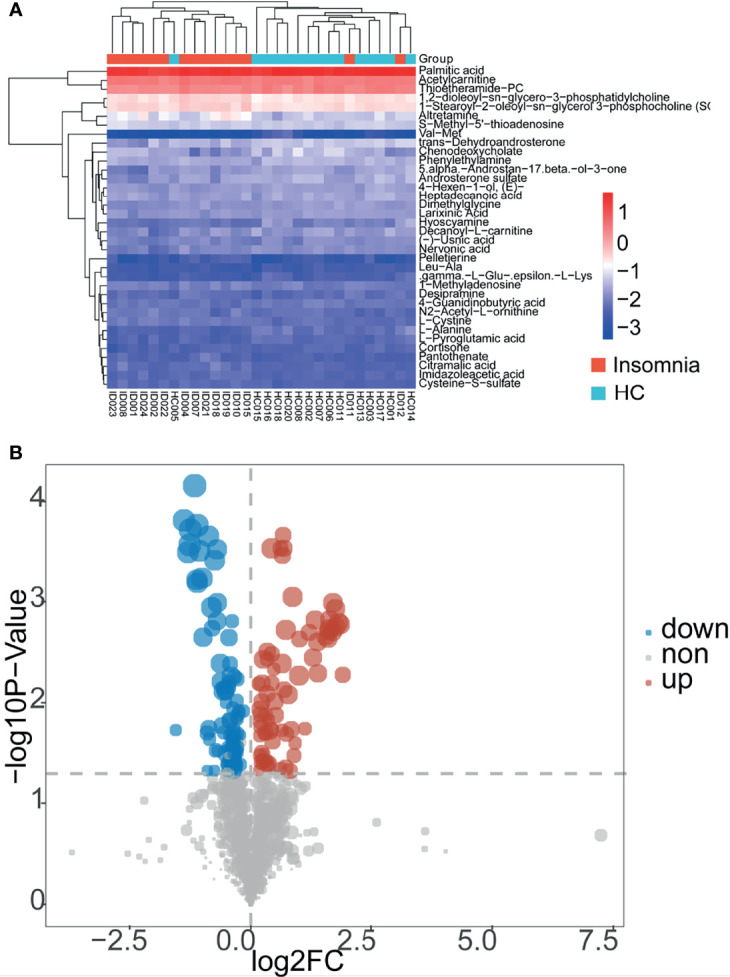
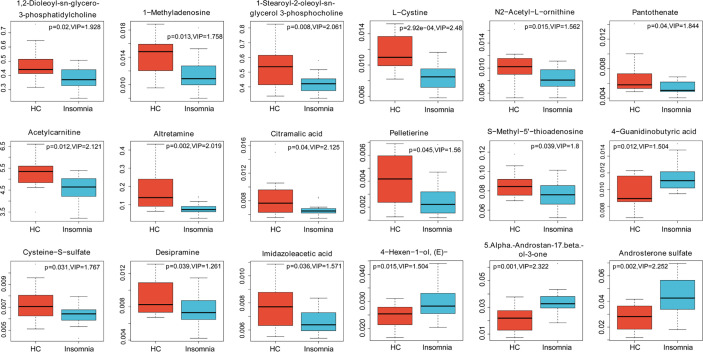
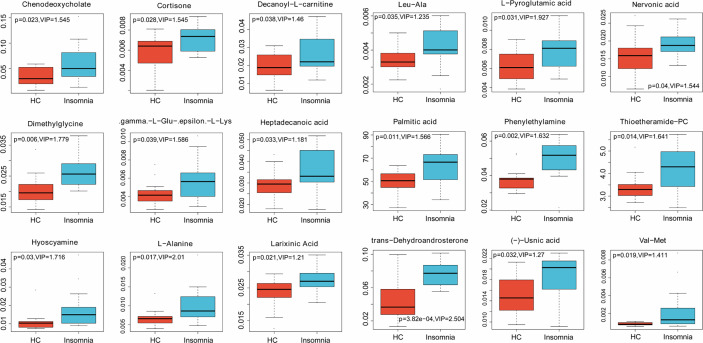
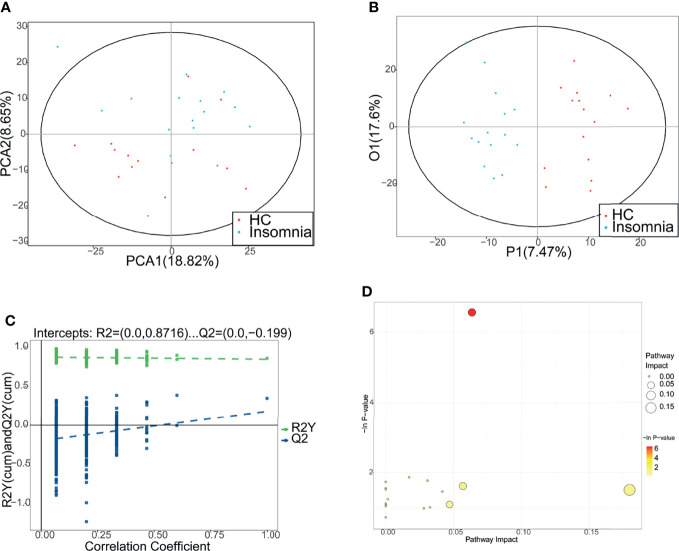
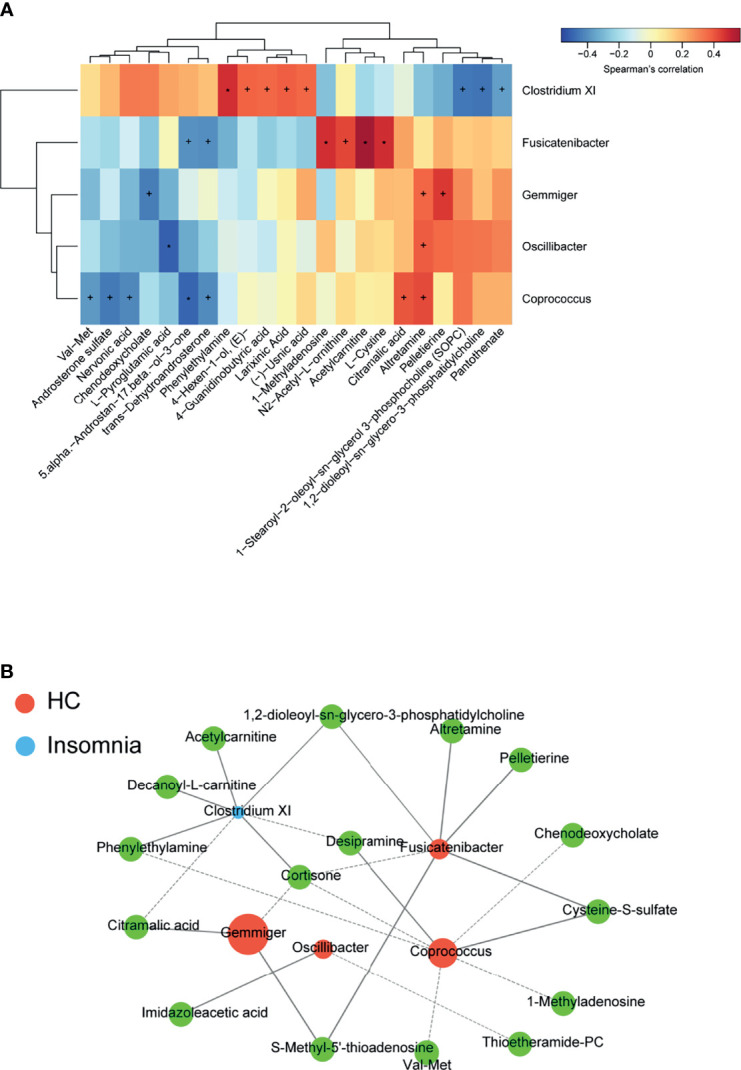
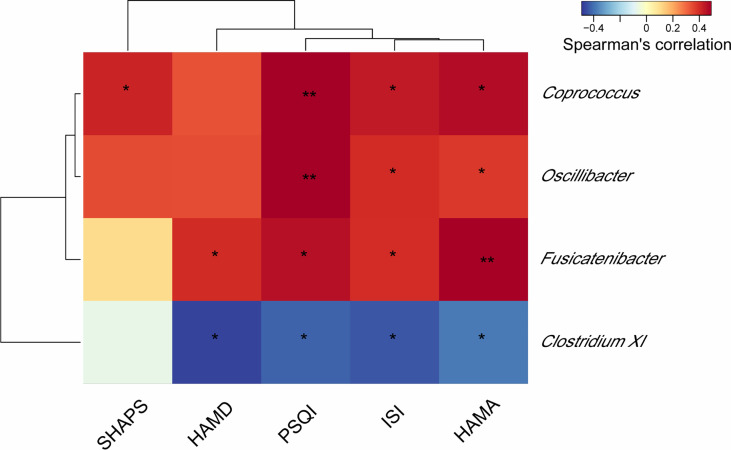
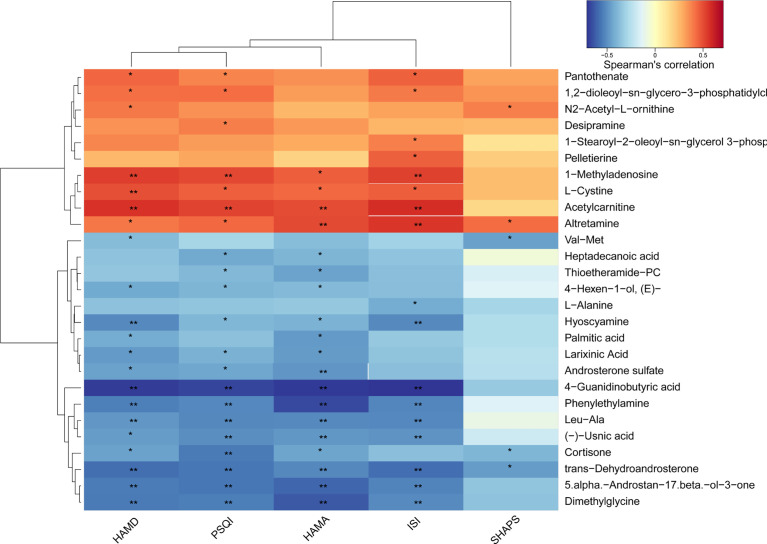
This study aimed to investigate insomnia-related alterations in gut microbiota and their association with serum metabolites. A total of 24 patients with insomnia disorder and 22 healthy controls were recruited. The fecal and serum samples were collected. The 16s rRNA sequencing and bioinformatics analysis were conducted to explore insomnia-related changes in the diversity, structure, and composition of the gut microbiota. UPLC-MS was performed to identify insomnia-related serum metabolites. Spearman correlation analysis was used to investigate the correlations between insomnia-related gut bacteria and the serum metabolites. Despite the nonsignificant changes in the diversity and structure of gut microbiota, insomnia disorder patients had significantly decreased family Bacteroidaceae, family Ruminococcaceae, and genus Bacteroides, along with significantly increased family Prevotellaceae and genus Prevotella, compared with healthy controls. Genus Gemmiger and genus Fusicatenibacter were dominant in patients with insomnia disorder, whereas genus Coprococcus, genus Oscillibacter, genus Clostridium XI, and family Peptostreptococcaceae were dominant in healthy controls. The UPLC-MS analysis identified 97 significantly decreased metabolites and 74 significantly increased metabolites in the serum samples of patients with insomnia disorder, compared with those of healthy controls. KEGG enrichment analysis revealed 1 significantly upregulated metabolic pathway and 16 downregulated metabolic pathways in patients with insomnia disorder. Furthermore, Spearman correlation analysis unveiled significant correlations among the altered bacteria genus and serum metabolites. Patients with insomnia disorder have differential gut microbiota and serum metabolic profiles compared with healthy controls. The alterations in gut microbiota were correlated with specific serum metabolites, suggesting that some serum metabolites might mediate gut microbiota-brain communication in the pathogenesis of insomnia disorder.
Keywords: gut microbiota; insomnia disorder; metabolic profile; microbiota-brain communication; serum metabolites.
Copyright © 2022 Zhou, Wu, Li, Zou, Dou, Li, Yan, Chen and Li.
Conflict of interest statement
The authors declare that the research was conducted in the absence of any commercial or financial relationships that could be construed as a potential conflict of interest.
Figures
Similar articles
-
Variations in gut microbiota and fecal metabolic phenotype associated with depression by 16S rRNA gene sequencing and LC/MS-based metabolomics.J Pharm Biomed Anal. 2017 May 10;138:231-239. doi: 10.1016/j.jpba.2017.02.008. Epub 2017 Feb 10. J Pharm Biomed Anal. 2017. PMID: 28219800
-
Fecal metabonomics combined with 16S rRNA gene sequencing to analyze the changes of gut microbiota in rats with kidney-yang deficiency syndrome and the intervention effect of You-gui pill.J Ethnopharmacol. 2019 Nov 15;244:112139. doi: 10.1016/j.jep.2019.112139. Epub 2019 Aug 8. J Ethnopharmacol. 2019. PMID: 31401318
-
Gut Microbiome and Serum Metabolome Alterations Associated with Isolated Dystonia.mSphere. 2021 Aug 25;6(4):e0028321. doi: 10.1128/mSphere.00283-21. Epub 2021 Aug 4. mSphere. 2021. PMID: 34346706 Free PMC article.
-
The gut microbiome as a target for adjuvant therapy in insomnia disorder.Clin Res Hepatol Gastroenterol. 2022 Jan;46(1):101834. doi: 10.1016/j.clinre.2021.101834. Epub 2021 Nov 18. Clin Res Hepatol Gastroenterol. 2022. PMID: 34800683 Review.
-
Insomnia and intestinal microbiota: a narrative review.Sleep Breath. 2024 Nov 26;29(1):10. doi: 10.1007/s11325-024-03206-x. Sleep Breath. 2024. PMID: 39589434 Review.
Cited by
-
Influence of warm acupuncture on gut microbiota and metabolites in rats with insomnia induced by PCPA.PLoS One. 2022 Apr 28;17(4):e0267843. doi: 10.1371/journal.pone.0267843. eCollection 2022. PLoS One. 2022. PMID: 35482778 Free PMC article.
-
Gut microbiota-generated short-chain fatty acids are involved in para-chlorophenylalanine-induced cognitive disorders.Front Microbiol. 2022 Nov 7;13:1028913. doi: 10.3389/fmicb.2022.1028913. eCollection 2022. Front Microbiol. 2022. PMID: 36419424 Free PMC article.
-
Polymer-based chemical-nose systems for optical-pattern recognition of gut microbiota.Chem Sci. 2022 Apr 26;13(20):5830-5837. doi: 10.1039/d2sc00510g. eCollection 2022 May 25. Chem Sci. 2022. PMID: 35685788 Free PMC article.
-
Linking Gut Microbiota, Oral Microbiota, and Serum Metabolites in Insomnia Disorder: A Preliminary Study.Nat Sci Sleep. 2024 Dec 7;16:1959-1972. doi: 10.2147/NSS.S472675. eCollection 2024. Nat Sci Sleep. 2024. PMID: 39664229 Free PMC article.
-
An analysis of electroacupuncture as adjunctive treatment for insomnia: a new perspective targeting GABA-mediated microbiome-gut-brain axis.Front Neurol. 2025 Apr 30;16:1504316. doi: 10.3389/fneur.2025.1504316. eCollection 2025. Front Neurol. 2025. PMID: 40371088 Free PMC article.
References
-
- Chao A. (1984). Nonparametric Estimation of the Number of Classes in a Population. Scand. J. Stat. 11, 265–270.
-
- Chao A., Shen T. J. (2003). Nonparametric Estimation of Shannon’s Index of Diversity When There Are Unseen Species in Sample. Environ. Ecol. Stat. 10, 429–443. doi: 10.1023/A:1026096204727 - DOI
Publication types
MeSH terms
Substances
LinkOut - more resources
Full Text Sources
Medical