. 2022 Feb 15;7(8):7012-7023.
doi: 10.1021/acsomega.1c06681. eCollection 2022 Mar 1.

In-Depth Serum Proteomics by DIA-MS with In Silico Spectral Libraries Reveals Dynamics during the Active Phase of Systemic Juvenile Idiopathic Arthritis

Affiliations

In-Depth Serum Proteomics by DIA-MS with In Silico Spectral Libraries Reveals Dynamics during the Active Phase of Systemic Juvenile Idiopathic Arthritis

Hironori Sato et al. ACS Omega. .

Abstract

In serum proteomics using mass spectrometry, the number of detectable proteins is reduced due to high-abundance proteins, such as albumin. However, recently developed data-independent acquisition mass spectrometry (DIA-MS) proteomics technology has made it possible to remarkably improve the number of proteins in a serum analysis by removing high-abundance proteins. Using this technology, we analyzed sera from patients with systemic juvenile idiopathic arthritis (sJIA), a rare pediatric disease. As a result, we identified 2727 proteins with a wide dynamic range derived from various tissue leakages. We also selected 591 proteins that differed significantly in their active phases. These proteins were involved in many inflammatory processes, and we also identified immunoproteasomes, which were not previously found in serum, suggesting that they may be involved in the pathogenesis of sJIA. A detailed high-depth DIA-MS proteomic analysis of serum may be useful for understanding the pathogenesis of sJIA and may provide clues for the development of new biomarkers.


Conflict of interest statement

The authors declare no competing financial interest.

Figures

Figure 1
Figure 1
Evaluation of the dynamic range and quantitative analysis of serum proteomics. (A) Commonly known inflammation-related proteins and sJIA-related biomarkers reported in refs (−, −30) are highlighted in red. Detected cytokines and chemokines are also highlighted in orange. (B) Detection of typical tissue leakage proteins in serum. The referenced gene groups were assessed by mRNA expression levels that were classified as enriched in specific tissue types. The numbers with the labels represent the number of genes that were matched/referenced. (C) Correlation between the quantitative values of the MS analysis and the laboratory data for each biomarker. The horizontal axis shows the quantitative values of the MS analysis. The vertical axis shows the laboratory data. The regression line is shown in blue.
Figure 2
Figure 2
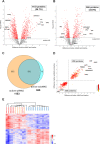
Changes in protein profiling during sJIA activity. (A) Volcano plot showing the expression in the active w/MAS and inactive phases with fold changes and p-values. The line on the horizontal axis represents p = 0.05. (B) Volcano plot showing the expression in the active w/oMAS and inactive phases with fold changes and p-values. The line on the horizontal axis represents p = 0.05. (C) Venn diagram with the significant proteins obtained in panels (A) and (B). (D) Scatter plot with the abundant difference ratio of significant proteins in active phases w/MAS and w/oMAS. (E) Heat map shows the protein groups that were significantly differentially abundant. The log-transformed protein quantitative values were standardized by z-score and color-coded.
Figure 3
Figure 3
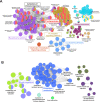
Network diagram of Gene Ontology (GO) and KEGG pathways by ClueGO. The same color nodes indicate similar functions. (A) Network diagram composed of upregulated proteins. (B) Network diagram composed of downregulated proteins.
Figure 4
Figure 4
Results of a STRING-based interaction analysis of identified proteins. This schematic diagram represents the proteins and the functional groups of the proteins. Differentially abundant proteins were classified according to Gene Ontology and KEGG pathways, and significant proteins were selected. The lines indicate the confidence level of the predicted interactions (confidence score ≥ 0.7). The color of the node represents each term, and the size represents the fold change between the active phase w/MAS and the inactive phase. The node size becomes larger with a higher fold change for upregulated proteins (A) and with a lower fold change for downregulated proteins (B). (A) Representative PPI using proteins that were all associated with the immune system process (GO:0002376), which were upregulated. (B) Representative PPI using downregulated proteins.

References

    1. Huang L.; Shao D.; Wang Y.; Cui X.; Li Y.; Chen Q.; Cui J. Human body-fluid proteome: quantitative profiling and computational prediction. Briefings Bioinf. 2020, 22, 315–333. 10.1093/bib/bbz160. - DOI - PMC - PubMed
    1. Nieto-Fontarigo J. J.; Gonzalez-Barcala F. J.; Andrade-Bulos L. J.; San-Jose M. E.; Cruz M. J.; Valdes-Cuadrado L.; Crujeiras R. M.; Arias P.; Salgado F. J. iTRAQ-based proteomic analysis reveals potential serum biomarkers of allergic and nonallergic asthma. Allergy 2020, 75, 3171–3183. 10.1111/all.14406. - DOI - PubMed
    1. Kimura Y.; Yanagimachi M.; Ino Y.; Aketagawa M.; Matsuo M.; Okayama A.; Shimizu H.; Oba K.; Morioka I.; Imagawa T.; Kaneko T.; Yokota S.; Hirano H.; Mori M. Identification of candidate diagnostic serum biomarkers for Kawasaki disease using proteomic analysis. Sci. Rep. 2017, 7, 43732 10.1038/srep43732. - DOI - PMC - PubMed
    1. Hewitson L.; Mathews J. A.; Devlin M.; Schutte C.; Lee J.; German D. C. Blood biomarker discovery for autism spectrum disorder: A proteomic analysis. PLoS One 2021, 16, e0246581 10.1371/journal.pone.0246581. - DOI - PMC - PubMed
    1. Duangkumpha K.; Stoll T.; Phetcharaburanin J.; Yongvanit P.; Thanan R.; Techasen A.; Namwat N.; Khuntikeo N.; Chamadol N.; Roytrakul S.; Mulvenna J.; Mohamed A.; Shah A. K.; Hill M. M.; Loilome W. Discovery and Qualification of Serum Protein Biomarker Candidates for Cholangiocarcinoma Diagnosis. J. Proteome Res. 2019, 18, 3305–3316. 10.1021/acs.jproteome.9b00242. - DOI - PubMed