. 2021 Sep;4(3):264-283.
doi: 10.1007/s42113-020-00097-5. Epub 2020 Nov 25.

Timing of readiness potentials reflect a decision-making process in the human brain

Affiliations

Timing of readiness potentials reflect a decision-making process in the human brain

Kitty K Lui et al. Comput Brain Behav. 2021 Sep.

Abstract

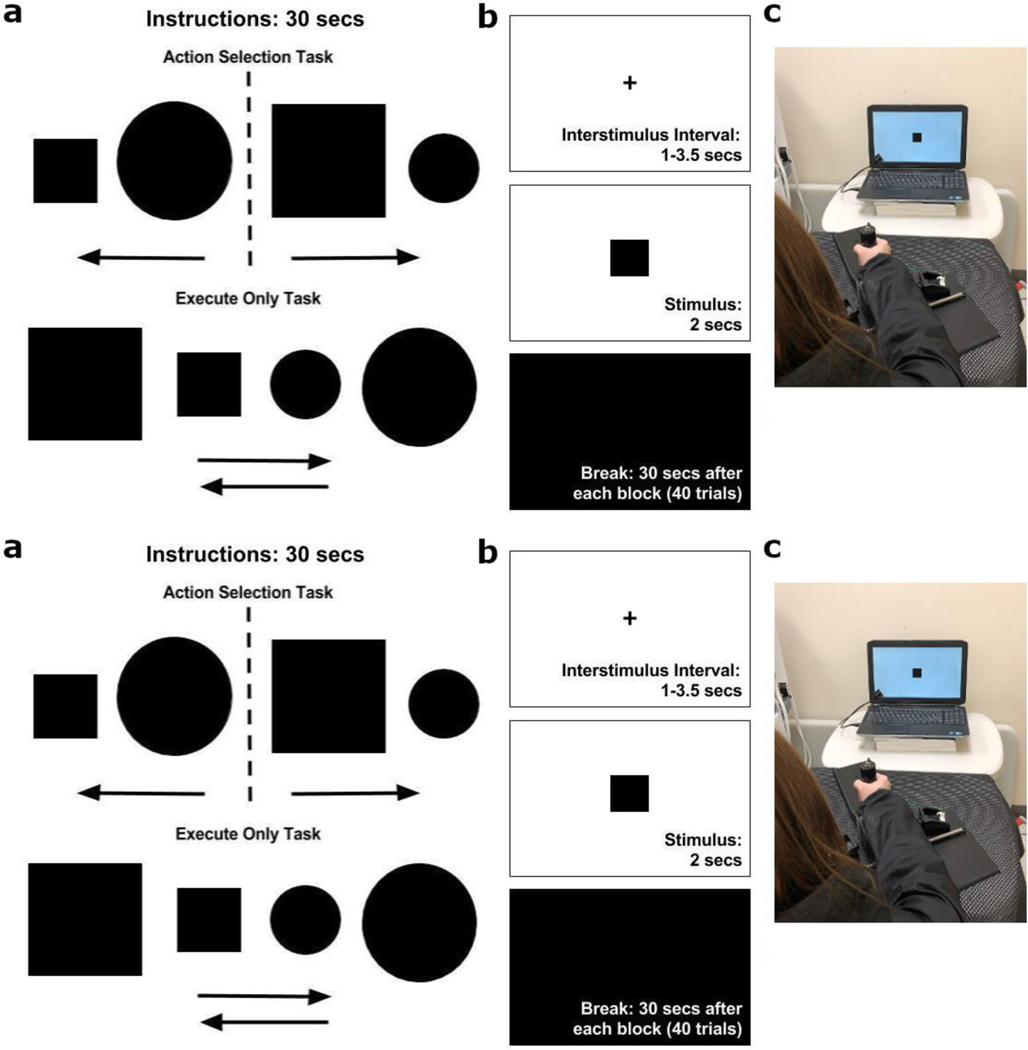
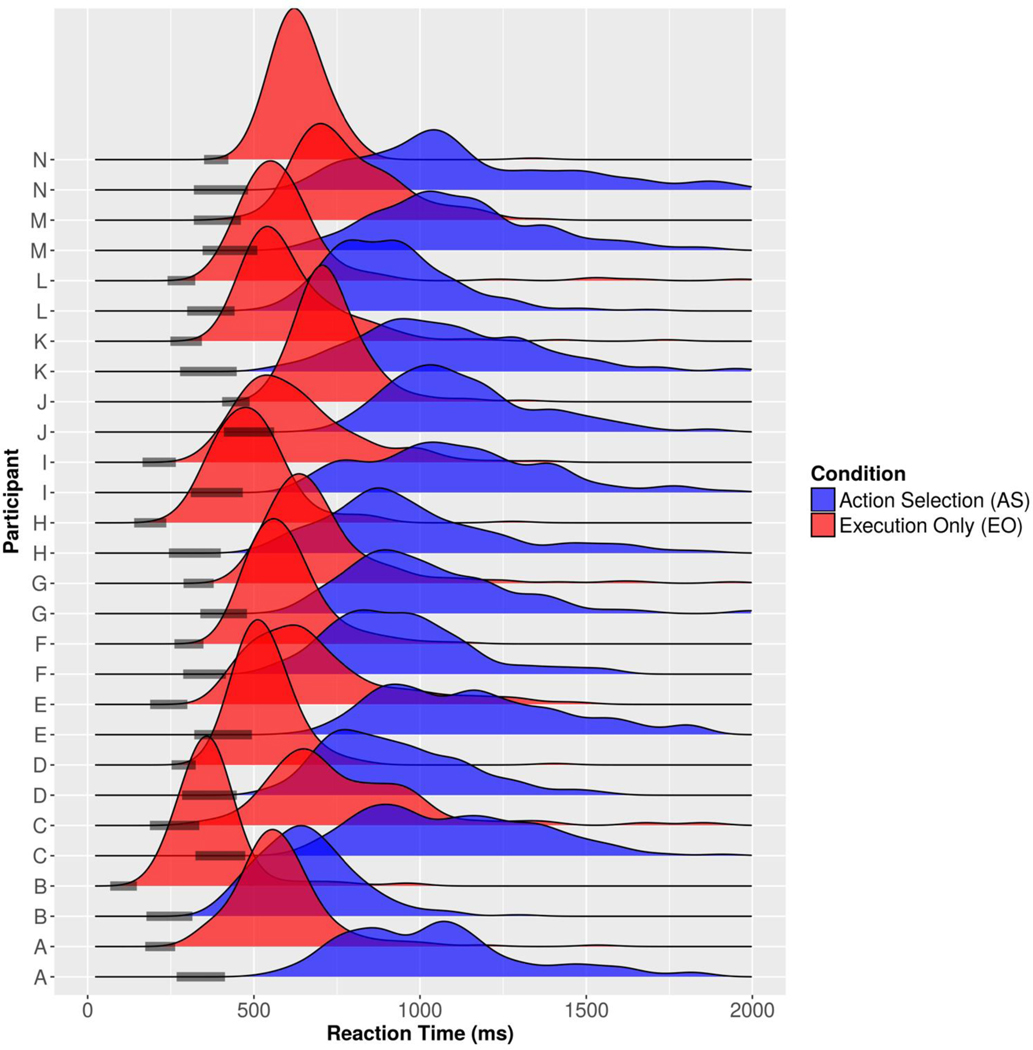
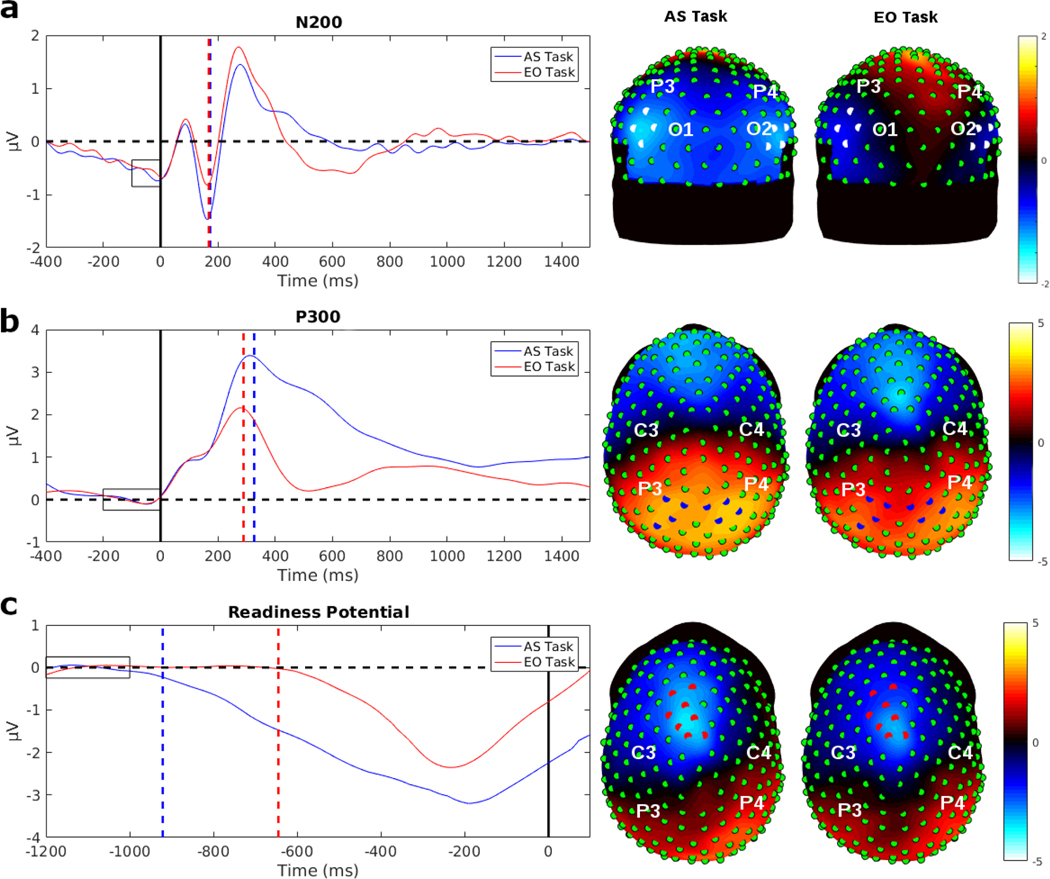
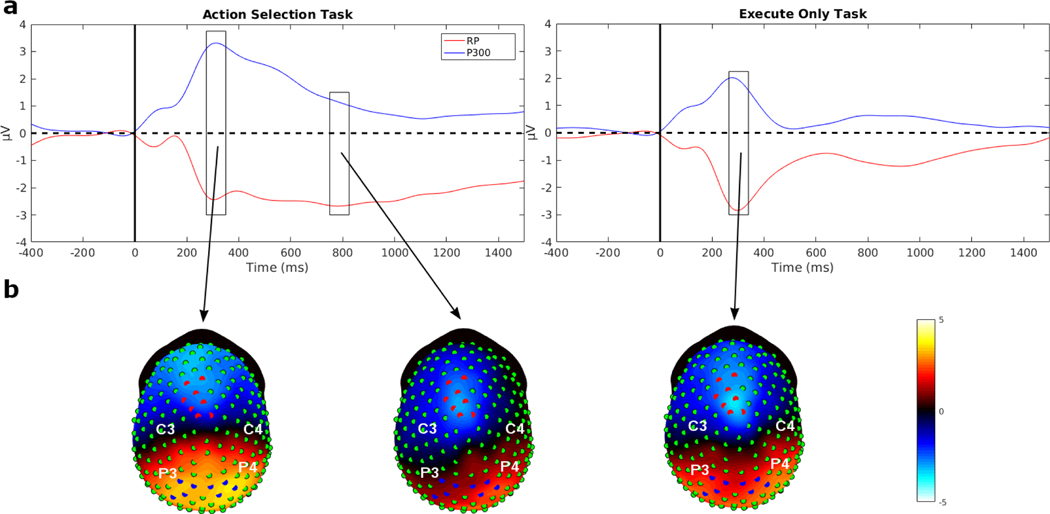
Decision-making in two-alternative forced choice tasks has several underlying components including stimulus encoding, perceptual categorization, response selection, and response execution. Sequential sampling models of decision-making are based on an evidence accumulation process to a decision boundary. Animal and human studies have focused on perceptual categorization and provide evidence linking brain signals in parietal cortex to the evidence accumulation process. In this exploratory study, we use a task where the dominant contribution to response time is response selection and model the response time data with the drift-diffusion model. EEG measurement during the task show that the Readiness Potential (RP) recorded over motor areas has timing consistent with the evidence accumulation process. The duration of the RP predicts decision-making time, the duration of evidence accumulation, suggesting that the RP partly reflects an evidence accumulation process for response selection in the motor system. Thus, evidence accumulation may be a neural implementation of decision-making processes in both perceptual and motor systems. The contributions of perceptual categorization and response selection to evidence accumulation processes in decision-making tasks can be potentially evaluated by examining the timing of perceptual and motor EEG signals.

Keywords: Decision-making; electroencephalography; motor preparation; perceptual categorization; readiness potential; response selection.


Figures

Fig. 1:
Fig. 1:
a) Participants received instructions prior to each block of 40 trials. The Action Selection (AS) task instructions directed the participants to make an external rotation movement when a large square or small circle appeared, and an internal rotation movement when a large circle or small square appeared. For each Execution Only (EO) block, instructions directed participants to perform either an external rotation movement or an internal rotation irrespective of the stimulus. b) The time course of each trial. The participants fixated on a cross during an interstimulus interval of random duration ranging from 1 to 3.5 seconds. A single stimulus was presented for two seconds during which responses were collected. After each block of 40 trials, participants received a 30 second break. c) The participants used the lower arm splint apparatus to make an internal (left) or external (right) shoulder rotation of 17.5 degrees to press a switch that captured their response. The splint was used to minimize any forearm or hand movements.
Fig. 2:
Fig. 2:
Response time distributions and estimated non-decision times for each participant. Each participant had a distribution of response times for both the AS and EO tasks. 95% credible intervals of non-decision time are given by the shaded bars on the response time axis.
Fig. 3:
Fig. 3:
Evoked potential (EP) waveforms averaged across participants of the eight strongest electrodes for each EP in the AS task and the EO task. The dashed lines show the median peak latency or median duration time of the signals. The rectangles indicate the baseline interval. On each topographic map the location of these eight strongest electrodes are indicated and the map show the average potentials in a time window surrounding the peak. a) The N200 waveforms showed a bilateral distribution over occipital regions in both hemispheres. The N200 peak latency was nearly identical between the two tasks, with a median N200 peak latency of 173 ms in the AS task and 168.5 ms in the EO task. The topographies show mean potentials of the time interval from 100 ms to 150 ms, where the minimum peak amplitude was for both tasks. b) The P300 waveforms showed a bilateral distribution over parietal cortex for both tasks. The median P300 peak latency for the AS task was 326.5 and 289.5 ms in the EO task, respectively, showing about a 40 ms difference. The topographies show the mean potentials of the time interval from 240 ms to 340 ms, a window covering the peak latency in the two tasks. c) The response-locked RP waveforms showed strongest negativity over the midline area close to motor areas of the brain. The response-locked RP duration between the tasks varied greatly. The median response-locked RP duration in the AS task was 921 ms and in the EO task was 645 ms. In the AS task, the response-locked RP slowly ramped down to the negative minimum, compared to the EO task where the RP sharply ramped down to the minimum. The EEG topographies represent mean potentials of the time interval from −250 ms to −200 ms, where the minimum peak amplitudes occurred for both tasks.
Fig. 4:
Fig. 4:
a) The time series of the stimulus-locked RP and the P300 averaged over the eight strongest channels. The stimulus-locked RP is in red and the P300 is in blue. The main difference seen between the two tasks are in stimulus-locked RP. In the AS task, after the stimulus-locked RP reached its minimum, there is a sustained negativity, whereas in the EO task, the signal has returned close to baseline. The P300 seemed to display similar time course in both tasks. b) In the AS task, the scalp topography is shown for the average potentials between 300 ms to 350 ms, revealing a topography similar to the one seen in Fig. 3b. When a later time period was averaged from 750 ms to 800 ms, the topographic distribution closely corresponded to the response-locked RP (see Fig. 3c). In the EO task, when averaging the potentials around the peak of the two signals, the topography looked similar to the response-locked RP (see Fig. 3c).
Fig. 5:
Fig. 5:
The RPs of the eight most negative motor channels averaged together and split into RT tertiles of fastest, middle, and slowest. a) The response-locked RPs for the fastest and middle tertiles are shown for a window of −1200 ms to 100 ms around the response indicated by a black vertical line. For the slowest RT tertile a longer window, −1500 ms to 100 ms, around the response, was used to accurately estimate response-locked RP duration. The dashed vertical lines represent the response-locked RP duration. In the AS task, the response-locked RP duration varied between conditions revealing the pattern of longer RTs having a longer RP duration. For the EO task, the fastest and middle condition had similar response-locked RP durations, and while the slowest was 300 ms longer. b) The stimulus-locked RPs are shown with a window of −400 ms to 1500 ms around stimulus onset indicated by the black vertical line. The stimulus-locked RP onset times were similar in both tasks for all tertiles as shown by the dashed vertical lines. The dotted vertical lines represent the average RTs in all of the conditions. One subject was excluded from this figure because of very fast RTs compared to the other participants. RP duration and onset times were estimated from this subject and included in the estimates of average duration and onset time and in the regression models shown in Fig. 7.
Fig. 6:
Fig. 6:
The P300 signal of the average of the eight most positive channels over parietal cortex are shown for the data split into RT tertiles in each task. In the AS task, the P300 peak latency is nearly the same in all of the conditions (shown by the vertical dashed line). In the EO task, it was similar in the fastest and middle condition, while the slowest condition showed a delay in peak latency of about 40 ms. This delayed peak in the slowest condition can possibly be due to a lack of attention and arousal during those trials due to the repetitive nature of the EO task. The average RTs for each condition in the two tasks are shown in the vertical dotted lines.
Fig. 7:
Fig. 7:
a) Regression model between response-locked RP duration and median RT for the AS task data divided into RT tertiles. b) Regression model between response-locked RP duration (absolute value of RP onset time) and median decision-making time for the AS task divided into DT tertiles. c) Regression model between response-locked RP duration (absolute value of RP onset time) and median response time for the EO task data divided into RT tertiles. d) Regression model between RP duration (absolute value of RP onset time) and decision-making time for the EO task divided into DT tertiles. This within participant effect showed that in the AS task, RP duration was strongly correlated to both RT and DT, with nearly a one-to-one relationship, indicating that the duration of RP was tracking decision-making process. For the EO task, the correlation was much weaker, and the slope not equal to one.
Fig. 8:
Fig. 8:
a) Regression model between P300 peak latency and median response time for the AS task data divided into RT tertiles. b) Regression model between P300 peak latency and median DT for the AS task divided into DT tertiles. c) Regression model between P300 peak latency and median response time for the EO task divided into RT tertiles. d) Regression model between P300 peak latency and DT for the EO task divided into DT tertiles. In the AS task, the P300 peak latency did not significantly correlate with either RT or DT. In the EO task, P300 peak latency was significantly correlated with RT and DT.
Fig. 9:
Fig. 9:
By applying a surface Laplacian, the strongest current density was localized close to the midline, potentially generated by bilateral structures in the motor cortex close to the midline. There were two electrodes that showed strong negativity over the left midline area and one electrode that showed strong positivity over the right midline area that could be suggestive of lateralization of the motor system. a) The time course of the three electrodes that generated the strongest current source density. b) The topography of current source density with the surface Laplacian applied. The three midline electrodes with greatest activity are marked in red, green, and blue and labeled 1–3. For reference, C3 and C4 electrodes are labeled.

References

    1. Alexander P, Schlegel A, Sinnott-Armstrong W, Roskies AL, Wheatley T, & Tse PU (2016). Readiness potentials driven by non-motoric processes. Consciousness and Cognition, 39, 38–47. 10.1016/j.concog.2015.11.011 - DOI - PubMed
    1. Azizian A, Freitas AL, Watson TD, & Squires NK (2006). Electrophysiological correlates of categorization: P300 amplitude as index of target similarity. Biological Psychology, 71(3), 278–288. 10.1016/j.biopsycho.2005.05.002 - DOI - PubMed
    1. Brown SD, & Heathcote A. (2008). The simplest complete model of choice response time: Linear ballistic accumulation. Cognitive Psychology, 57(3), 153–178. 10.1016/j.cogpsych.2007.12.002 - DOI - PubMed
    1. Burle B, Vidal F, Tandonnet C, & Hasbroucq T. (2004). Physiological evidence for response inhibition in choice reaction time tasks. Brain and Cognition, 56(2 SPEC. ISS.), 153–164. 10.1016/j.bandc.2004.06.004 - DOI - PubMed
    1. Buc Calderon C, Verguts T, & Gevers W. (2015). Losing the boundary: Cognition biases action well after action selection. Journal of Experimental Psychology: General, 144(4), 737–743. 10.1037/xge0000087 - DOI - PubMed